
Remember me
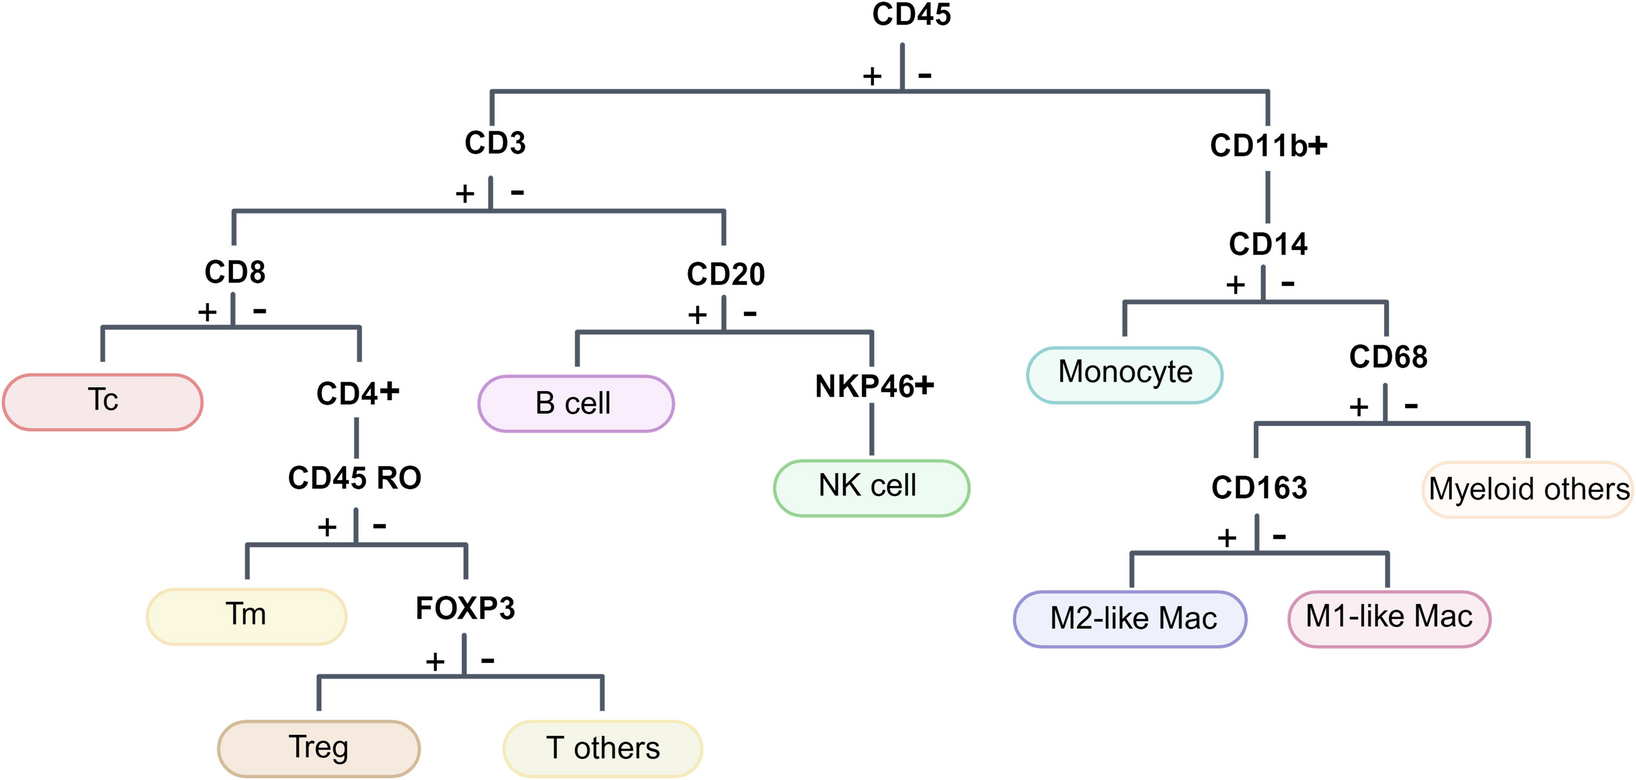
Firstly, utilizing a pre-designed panel of metal-conjugated antibodies for SCLC tumor epithelial cells, stromal cells, and various immune cells (Fig. 1, Supplementary Table 2), we obtained quantified protein expression and high-dimensional imaging information at single-cell resolution from ten samples. After image segmentation using CellProfiler, we identified 86,355 individual cells across the ten tumor samples and visualized the interactions between tumor cells and immune cells or stromal cells. Overall, tumor cell clusters were surrounded by immune cells and stromal cells, but only a minority of immune cells were observed infiltrating the center of tumor (Supplementary Fig. 1). PhenoGraph clustering was applied separately to classify tumor cells and non-tumor cells, resulting in 24 clusters representing distinct cellular subpopulations with discrepant proliferative capacity (Ki-67, cMyc) and immune regulatory potential (CD47) in the tumor cell compartment. In contrast, the non-tumor cell population yielded 27 clusters, representing subsets of T cells (cluster 25, cluster 28, cluster 32, cluster 38, cluster 46), B cells (cluster 29), macrophages (cluster 27, cluster 30, cluster 35, cluster 37, cluster 40, cluster 41, cluster 44, cluster 47), or stromal cells (cluster 33, cluster 36, cluster 42, cluster 43, cluster 45, cluster 49, cluster 51) (Fig. 2A, B). The heterogeneity of tumor cell subpopulations was evident across different samples, with even patients within the same group. To be specific, in Non-relapse group, patient 1 exhibited a preference for expressing cluster 1 and cluster 2, which comprised cells with low CD47 expression. Patient 5 preferred expressing cluster 16 and cluster 17, representing cells with high Ki-67 expression but lacking E-cadherin expression. The remaining three patients shared the remaining subpopulations. While in the Relapse group, patient 6 displayed a preference for expressing cluster 20 and cluster 21, characterized by cells with high E-cadherin and Ki-67 expression. Patient 7 favored expressing cluster 10, cluster 11, and cluster 12, which comprised cell populations with no or low expression of E-cadherin and Ki-67. The remaining patients exhibited similar subpopulation expression patterns (Supplementary Fig. 2A, C). Conversely, non-tumor cell subpopulations, primarily immune cells and stromal cells, showed a more uniform distribution pattern according to the t-SNE plots (Supplementary Fig. 2B, D). However, the subpopulations generated by macrophages and stromal cells were far more numerous than other non-tumor cell populations, thus warranting particular attention in subsequent analyses. Overall, these findings reflect the tumor heterogeneity and"immune desert"characteristics within SCLC.
High expression of Ki-67 is a major characteristic of recurrent tumorsWhile individual patients manifest pronounced heterogeneity in their tumor cells, our endeavors center on discerning shared characteristics within either the Relapsed or Non-relapsed cohorts. This emphasis stems from our observation that tumor cell subsets were predominantly marked by Ki67, c-myc, or CD47.
By incorporating grouping into the tumor cell clustering, we observed distinct distribution differences of subpopulations between two groups (Fig. 2C). Subsequently, we quantified the differential abundance of tumor cell subpopulations. However, the distribution percentages of the 24 tumor cell subpopulations did not exhibit statistical significance between the two groups. Nonetheless, volcano plots revealed enrichment of subpopulations with low expression of Ki-67 and subpopulations with high expression of Ki-67 in opposite directions (Supplementary Figs. 3 and 4). Assessing subpopulation abundance did not adequately capture the differences between the two groups. Hence, we employed hierarchical clustering on the tumor cell subpopulations. Hierarchical clustering was performed based on the average correlation of markers within each cluster. Consistent with the overall distribution pattern, clustering based on the expression status of Ki-67 generated three subtrees, with differences between the two groups observed mainly in smaller branch nodes and leaf nodes. Cluster 3 represented the low expression of Ki-67 in the Non-relapse group, while branches T14 and T18 represented the expression or high expression of Ki-67 in the Relapse group. This may reflect the tumor subpopulations exhibiting variations in Ki-67 protein expression represent the primary distinction between the two groups (Fig. 3A-C).
Fig. 3
The subset characterized by high Ki-67 expression emerged as a significant determinant for tumor recurrence. A Dendrogram of the hierarchical clustering results obtained from automatic clustering analysis for tumor subpopulations. Shorter branch lengths indicate higher similarity, while longer branch lengths indicate greater dissimilarity. Nodes exhibiting significantly different abundance were highlighted in red. B Abundance volcano plot showing the subgroups enriched for each of the two groups. C The box plot indicating the enrichment differences among subpopulations or nodes. D Expression differences of 34 markers in tumor clusters between the two groups. E-G Differential expression tree of Ki-67 (e), c-Myc (f), GranzymeB (g) between two groups, nodes with differences were highlighted in red. Statistical analysis was performed using an unpaired t-test
To explore potential markers that could anticipate early tumor recurrence, we analyzed the differential expression of markers in all cells. Surprisingly, the median expression of Ki-67 in tumor cells showed no difference between the two groups. However, when considering the 80 th percentile, Ki-67 exhibited differences between the two groups, consistent with the results of hierarchical clustering, suggesting that recurrent tumors may originate from the fraction of the original tumor with active proliferation (Supplementary Fig. 5). On the other hand, we examined the differential expression of markers within each tumor subpopulation between the two groups. Consistent with the distribution of subpopulation abundances, T19, as the root node, exhibited significant differences in Ki-67 expression, supporting the notion that high expression of Ki-67 is an important factor in tumor recurrence (Fig. 3D, E). While the Non-relapse group did have tumor subpopulations with high Ki-67 expression, they were relatively fewer compared to the Relapse group. Intriguingly, these high Ki-67 expressing subpopulations in the Non-relapse group concurrently exhibited elevated c-Myc levels. In contrast, Ki-67 positive subpopulations seldom expressed c-Myc but were marked by heightened GranzymeB expression. This could account, in part, for the enhanced metastatic potential of Ki-67 positive cells in the Relapse group (Fig. 3F, G).
M1 macrophages confer protection to early-stage SCLC patientsApart from the innate characteristic of the tumor, the role of TME in tumor recurrence and metastasis is increasingly recognized (Quail and Joyce 2013). As mentioned earlier, immune cells and stromal cells represent key components of the TME, and overall, the distribution of non-tumor cell subpopulations doesn’t exhibit significant heterogeneity among different patients or groups (Fig. 2B, D, Supplementary Fig. 2D). When quantifying the differences in subpopulation abundance of non-tumor cells between the two groups, we observed an evident enrichment of the immune-related subsets in the Non-relapse group. Notably, this wasn’t about T cells, B cells, or NK cells, but was evident in the M1 macrophage subpopulation (cluster 27) (Fig. 4A-C, Supplementary Figs. 3 and 4). M1 and M2 macrophage polarization is a process influenced by environmental conditions. M1 macrophages are pro-inflammatory, enhancing T-cell cytotoxicity through factors like TNF-α and IL-1β. On the other hand, M2 macrophages, polarized by agents like IL-10, are associated with tumorigenesis, metastasis, and immunoregulation (S. Chen et al. 2023). The presence of M2 macrophages in the TME has an impact on treatment results and patient prognosis (van Eijck et al. 2024). Our finding suggests that an increased proportion of M2 macrophages in the TME of early-stage SCLC patients could be a critical factor for post-surgical recurrence. Conversely, the presence of M1 macrophages in the TME may enhance patient prognosis.
Fig. 4
Relapsed patients exhibited a paucity of specific VIM+ stromal cells and M1 macrophages. A Differential abundance analysis tree of non-tumor cells. B Abundance volcano plot showing the enrichment of M1 macrophages and VIM+ stroma cells in the Non-relapse group. C The box plot displayed the specific P values and meaningful clusters or nodes. D Expression differences of 34 markers in non-tumor clusters between two groups. E Differential expression tree of c-Myc between two groups, nodes with differences were highlighted in red. Statistical analysis was performed using an unpaired t-test
To further investigate whether this subpopulation possesses distinct expression profiles compared to other homogenous cells, we performed dimensionality reduction and clustering analysis on macrophages. Cluster 27 presented a group of macrophages with CD68med CD163- VIMmed CD14med HLADRlow/- CTLA4-, indicating an activated and migratory M1 macrophage phenotype (Supplementary Fig. 6). Low expression of HLADR and CTLA4 also indicate that this cluster of M1 macrophage could be a group of initial cells, having a strong ability to present antigens, which is consistent with the latest research (H. Chen et al. 2025). We also analyzed the expression of 35 markers within each non-tumor subpopulation between the two groups. Interestingly, c-Myc was highly expressed in the two M2 macrophage subpopulations of the Non-relapse group, suggesting a potential role for c-Myc in the polarization of early-stage SCLC macrophages (Fig. 4D, E) (Pello et al. 2012).
The distribution and expression patterns of non-tumor cells may be influenced by the artificial selection of ROI regions. To address this bias, we utilized the spatial information provided by the IMC technology and calculated the distribution of cell subpopulations within a defined distance from tumor cells (Fig. 5A). Distance-based subpopulation abundance analysis still indicated the differences in macrophage between the two groups (Fig. 5B-D).
Fig. 5
Analysis of non-tumor cell subpopulation abundance based on spatial distance. A Distribution plot showing the proportions of non-tumor cell subpopulations within varying distances from tumor cells for each sample. B-D Re-calculated dendrogram (b), volcano plot (c), and bar plot (d) specifically for non-tumor cells within 30 μm of tumor cells. Cluster 45 and Cluster 27 exhibit distinct distributions between the two groups, consistent with the pre-correction findings
Additionally, we noted a VIM+ stromal cell subpopulation (cluster 45) in the Non-relapse group (Fig. 4A-C, Supplementary Figs. 3, 4). This subpopulation is characterized by VIMhigh aSMA- HLADR- (Supplementary Fig. 7).
Non-relapse SCLC patients exhibit a more positive TME interactionIMC preserves the true cellular interactions instead of predicting cell-cell interactions based on ligand-receptor interactions. By utilizing a permutation test based on cellular distances, we identified interaction or avoidance behaviors among cells (Jackson et al. 2020). Consistent with in situ mapping of subpopulations, SCLC tumor cells exhibited strong avoidance towards non-cancer lineages, with only a minimal interaction observed between T cells and tumor cells, reflecting an immune-suppressive microenvironment in SCLC. Furthermore, non-tumor lineages displayed more spatial proximity and signaling in the Non-relapse group. Notably, a more pronounced interaction was observed in the Non-relapse group between M1 macrophages, VIM+ stromal cells, CD8+ T cells, and tumor cells. However, two enriched subpopulations in the Non-relapse group, cluster45 and cluster27, exhibited strong avoidance behavior toward tumor cells (Fig. 6). These findings underscore the intricate interplay between the TME and the tumor. M1 macrophages and VIM+ stromal cells may contribute to the recognition and elimination of tumor cells by T cells.
Fig. 6
Neighborhood analysis highlighted a differential interactive pattern between tumor cells and TME in the two groups. Heatmap indicating significant interaction (red) or avoidance (blue) between Metaclusters of two groups according to a permutation-test-based analysis of spatial single-cell interactions
Given the suppressive performance of M1 macrophages in TME, we attempted to explore whether there were mechanisms that enable tumor cells to escape the influence of macrophages. Therefore, we examined the marker expression status of neighboring cells within the M1 macrophage-associated subpopulations. We observed the presence of tumor cells with high Ki-67 expression and high GranzymeB expression surrounding M1 macrophages, which is the hallmark subpopulation we identified in the Relapse group. However, we did not observe differences in other immune-suppressive signals, such as CD47 (Supplementary Fig. 8). This finding indicates that tumor cells indeed influence macrophage function through certain mechanisms, particularly affecting macrophage polarization. The exact mechanism, however, warrants further exploration.
Comments (0)