Animals
The protocol was approved by the ethics committee of Tangdu Hospital (#20241199). Gper1 conditional knockout mice (Gper1KO) were purchased from Saiye Biotech (Suzhou, China). The strain name is C57BL/6J-Gper1em1Cya, and the strain number is KOCMP-76,854-Gper1-B6J-VA. The genetic background of the strain is C57BL/6J. A total of 62 wild type mice and 32 Gper1KO mice were used in this study. Cryopreserved strains of mouse sperm were purchased. Homozygous Gper1KO mice were obtained after expansion and screening. The wild type mice in this study are C57BL/6J mice. All mice were housed in a 12-hour cycle of alternating light and dark. Mice were housed at 22 ± 2 °C and 50 ± 1% relative humidity. Sterile food and drinking water were freely available. Eight-week-old female C57BL/6J mice and Gper1KO mice were selected for this study. Before experimental mice underwent TBI modeling, they first underwent bilateral ovariectomy with bilateral dorsolateral incisions in the abdominal frontal wall.
The study included two experimental groups: Wild-type (WT) Group: C57BL/6J mice with intact Gper1 expression. Gper1KO Group: Homozygous Gper1 knockout mice with Gper1 function completely ablated. Both groups were subjected to the same experimental procedures, including TBI modeling, behavioral tests, and molecular/biochemical analyses, as outlined in the methods section.
Controlled Cortical Impact (CCI)
Unilateral CCI was used to simulate TBI in mice. Mice previously anesthetized with isoflurane were head-fixed in a transparent rigid positioning frame. Trained laboratory personnel used sterile equipment in a sterile operating table to open the mouse skin to expose the skull and bregma. Sterile drills for mouse bones were used for the parietal lobe craniotomy. The diameter of the opening was 3.5 mm. The opening was centered 0.5 mm anterior and 2.0 mm lateral to the middle bregma. The mouse’s dura mater and cerebral cortex were exposed. The CCI instrument applied in this study was pneumatically driven and the diameter of the impactor was 3 mm. Each impact could compress the mouse’s brain tissue to 1.5 millimeters. The maximum impact velocity was 3.75 m/s. The residence time of each compression shock head in the mouse brain was 150 ms. After surgery, the skin of the mouse brain was sutured. Mice were maintained under sterile conditions. The control group only received the same anesthesia and brain skin incision as the TBI group.
Blood Brain Barrier (BBB) dysfunction
Brain tissue water content was used to evaluate the BBB dysfunction in this study. The wet/dry method was used to detect the water content of brain tissue on the third day after TBI modeling. Immediately after the animal was sacrificed, the brain tissue was removed and sliced into 4 mm thick brain slices. Electronic analytical balance weighed each part, i.e. wet weight (WW). Then the brain slices were placed at 100 °C for 24 h and weighed, that was dry weight (DW). The formula [WW − DW]/WW×100% calculated the brain tissue water content (%).
Evans blue extravasation assay
The Evans blue extravasation assay was used to evaluate BBB permeability following TBI. Mice were anesthetized with isoflurane and injected intravenously with 2% Evans blue dye (4 mL/kg body weight) via the tail vein. The dye was allowed to circulate for 2 h. After circulation, the mice were perfused transcardially with cold phosphate-buffered saline (PBS) to remove intravascular Evans blue. The brains were then carefully dissected, and the ipsilateral cortex was isolated, weighed, and homogenized in 1 mL of formamide. The homogenates were incubated at 55 °C for 24 h to extract the Evans blue dye. The samples were centrifuged at 12,000 × g for 30 min, and the absorbance of the supernatants was measured at 620 nm using a spectrophotometer. The concentration of Evans blue was calculated based on a standard curve and normalized to the weight of the tissue. Results were expressed as micrograms of Evans blue per gram of brain tissue (µg/g). This assay was performed in triplicate for each experimental group.
TUNEL staining
Seven days after mice underwent TBI modeling, TUNEL staining was performed. Brains of euthanized mice were removed and fixed in 4% paraformaldehyde for 12 h. 30% sucrose was readily used for tissue dehydration. The mouse brains were sliced at 0.5 mm anterior to bregma. TUNEL staining was checked with the In Situ Cell Death Detection Kit (11684817910, Roche, Penzberg, Upper Bavaria, Germany). Images were taken using an Olympus fluorescence microscope, and the apoptosis index was calculated as the proportion of TUNEL-positive cells.
Open Field Test (OFT)
Mice that underwent TBI modeling underwent OFT on day 7 post modeling. TBI mice and control mice were housed in 55 × 55 × 36 cm transparent rigid plastic boxes. Their movement trajectories were recorded and analyzed. Two days before the formal test, mice were placed in the open field box for 5 min each day (data not recorded) to gradually acclimate to the environment. Mice were sequentially placed in the center of the field, and their locomotor activity was recorded for 5 min. The site is divided into four quadrants with the same area and shape by the scale on the plastic plate. The area of each quadrant is 27.5 × 27.5 cm. The timing and frequency of activity of mice in different areas (central, extracentral and corner) in four quadrants were recorded. The distance, speed, and round-trip frequency of the mice were recorded and analyzed. Laboratory lighting, temperature, and humidity were kept constant. After each mouse was tested, the apparatus was wiped with 75% ethanol or an odorless cleaning agent to eliminate residual odors. All animal handling was performed by the same person to ensure consistent placement of the mice. Data recording was carried out by the same individual.
Y maze test
The Y-maze test was conducted to assess spatial working memory and cognitive function in TBI and control mice, reflecting hippocampus-dependent cognitive performance. Before the Y-maze test, it was ensured that the mice had not been exposed to similar apparatuses to avoid learning effects influencing the results. On the seventh day after TBI modeling and following the open field test, mice were subjected to the Y-maze test. The Y-maze consists of three arms, with one arm closed during the training phase. Mice were initially allowed to explore the two open arms for 10 min, followed by a 30-minute rest in their home cages. During the test phase, all three arms were opened, and the mice were allowed to explore freely. Movements were recorded using the Y-maze system (Muromachi Kikai), and the percentage of new arm entries was calculated as a measure of spatial working memory. Higher alternation rates indicate better cognitive function, while lower rates suggest spatial memory impairments. Laboratory lighting, temperature, and humidity were kept constant. After each mouse was tested, the apparatus was wiped with 75% ethanol or an odorless cleaning agent to eliminate residual odors. All animal handling was performed by the same person to ensure consistent placement of the mice. Data recording was carried out by the same individual.
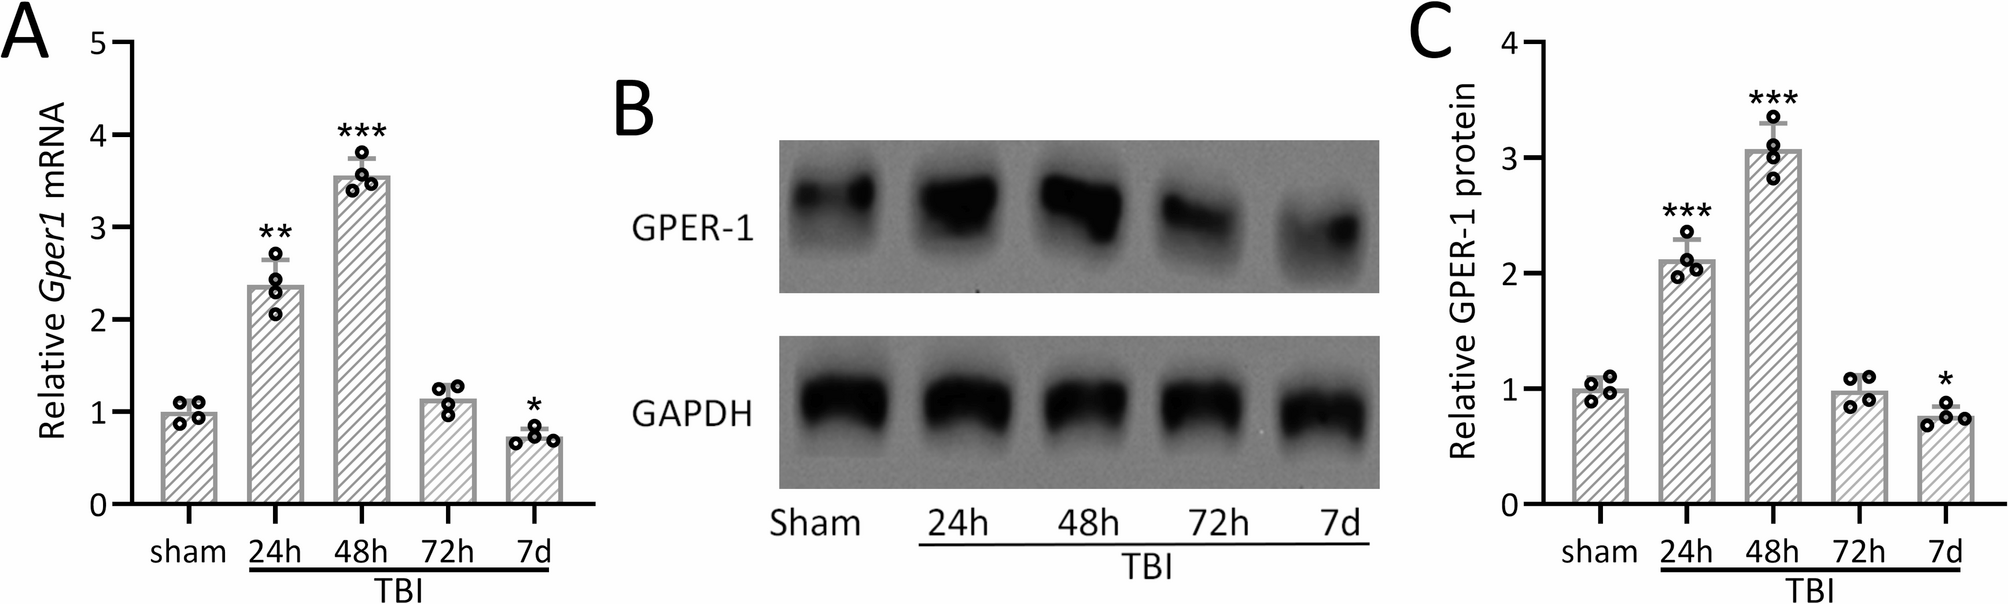
Real-Time Polymerase Chain Reaction (RT-PCR)
SuperScript IV rt-PCR Kit (Thermo Fisher) was used to analyze gene expression according to the instructions. The relative expression of target genes was normalized by Gapdh and calculated by the 2−ΔΔCT method.
Gper1:
Forward: ATGGATGCGACTACTCCAGC,
Reverse: AAGAGGGCAATCACGTACTGC;
PGC-1α
Forward: GAAAGGGCCAAACAGAGAGA,
Reverse: GTAAATCACACGGCGCTCTT;
NLRP3:
Forward: ATTACCCGCCCGAGAAAGG,
Reverse: CATGAGTGTGGCTAGATCCAAG;
ASC:
Forward: CTTGTCAGGGGATGAACTCAAAA,
Reverse: GCCATACGACTCCAGATAGTAGC;
Gapdh:
Forward: AATGGATTTGGACGCATTGGT,
Reverse: TTTGCACTGGTACGTGTTGAT.
Western blot analysis
Western blotting was performed to evaluate the protein expression levels of PGC-1α, NLRP3, and ASC in the lesioned cortices post-TBI. Briefly, cortical tissues were homogenized in RIPA lysis buffer containing protease and phosphatase inhibitors. Protein concentrations were quantified using the BCA assay. Equal amounts of protein (20–30 µg) were separated by SDS-PAGE and transferred onto PVDF membranes. The membranes were blocked with 5% non-fat milk in TBST (Tris-buffered saline with 0.1% Tween-20) for 1 h at room temperature and then incubated overnight at 4 °C with primary antibodies specific to PGC-1α, NLRP3, ASC, and GAPDH (used as a loading control). After washing, the membranes were incubated with HRP-conjugated secondary antibodies for 1 h at room temperature. Protein bands were visualized using enhanced chemiluminescence (ECL) and quantified with ImageJ software. The expression levels of target proteins were normalized to GAPDH and compared to the WT-Sham group. Each group included three independent replicates, with tissue homogenates pooled from ten samples per group.
Enzyme Linked Immunosorbent Assay (ELISA)
Mouse Interleukin 6 (IL-6) ELISA Kit (ab222503), Mouse IL-1 beta ELISA Kit (ab197742), Mouse Tumor necrosis factor (TNF) alpha ELISA Kit (ab208348) and Mouse Monocyte chemotactic protein 1 (MCP-1) ELISA Kit (ab208979) (Abcam, Cambridge, MA) were used for the detection of the neuroinflammation.
Statistical analysis
Statistical software SPSS 24.0 was used to analyze the data. The measurement data was represented by mean ± standard deviation (SD). Shapiro-Wilk test was used to assess the normality of the data, and the results indicated that all data followed a normal distribution. The significances were analyzed by one-way ANOVA followed Dunn’s multiple comparisons test for the data set only involved the time variable, or two-way ANOVA followed Tukey’s multiple comparisons test for the data set involved two variables (genotype and TBI modeling status). P < 0.05 was considered statistically significant. For the results derived from multiple comparisons, we calculated the effect size using the formula: Cohen’s d = Mean Difference / SD, based on the mean differences and standard deviations between groups.


Comments (0)