
Remember me
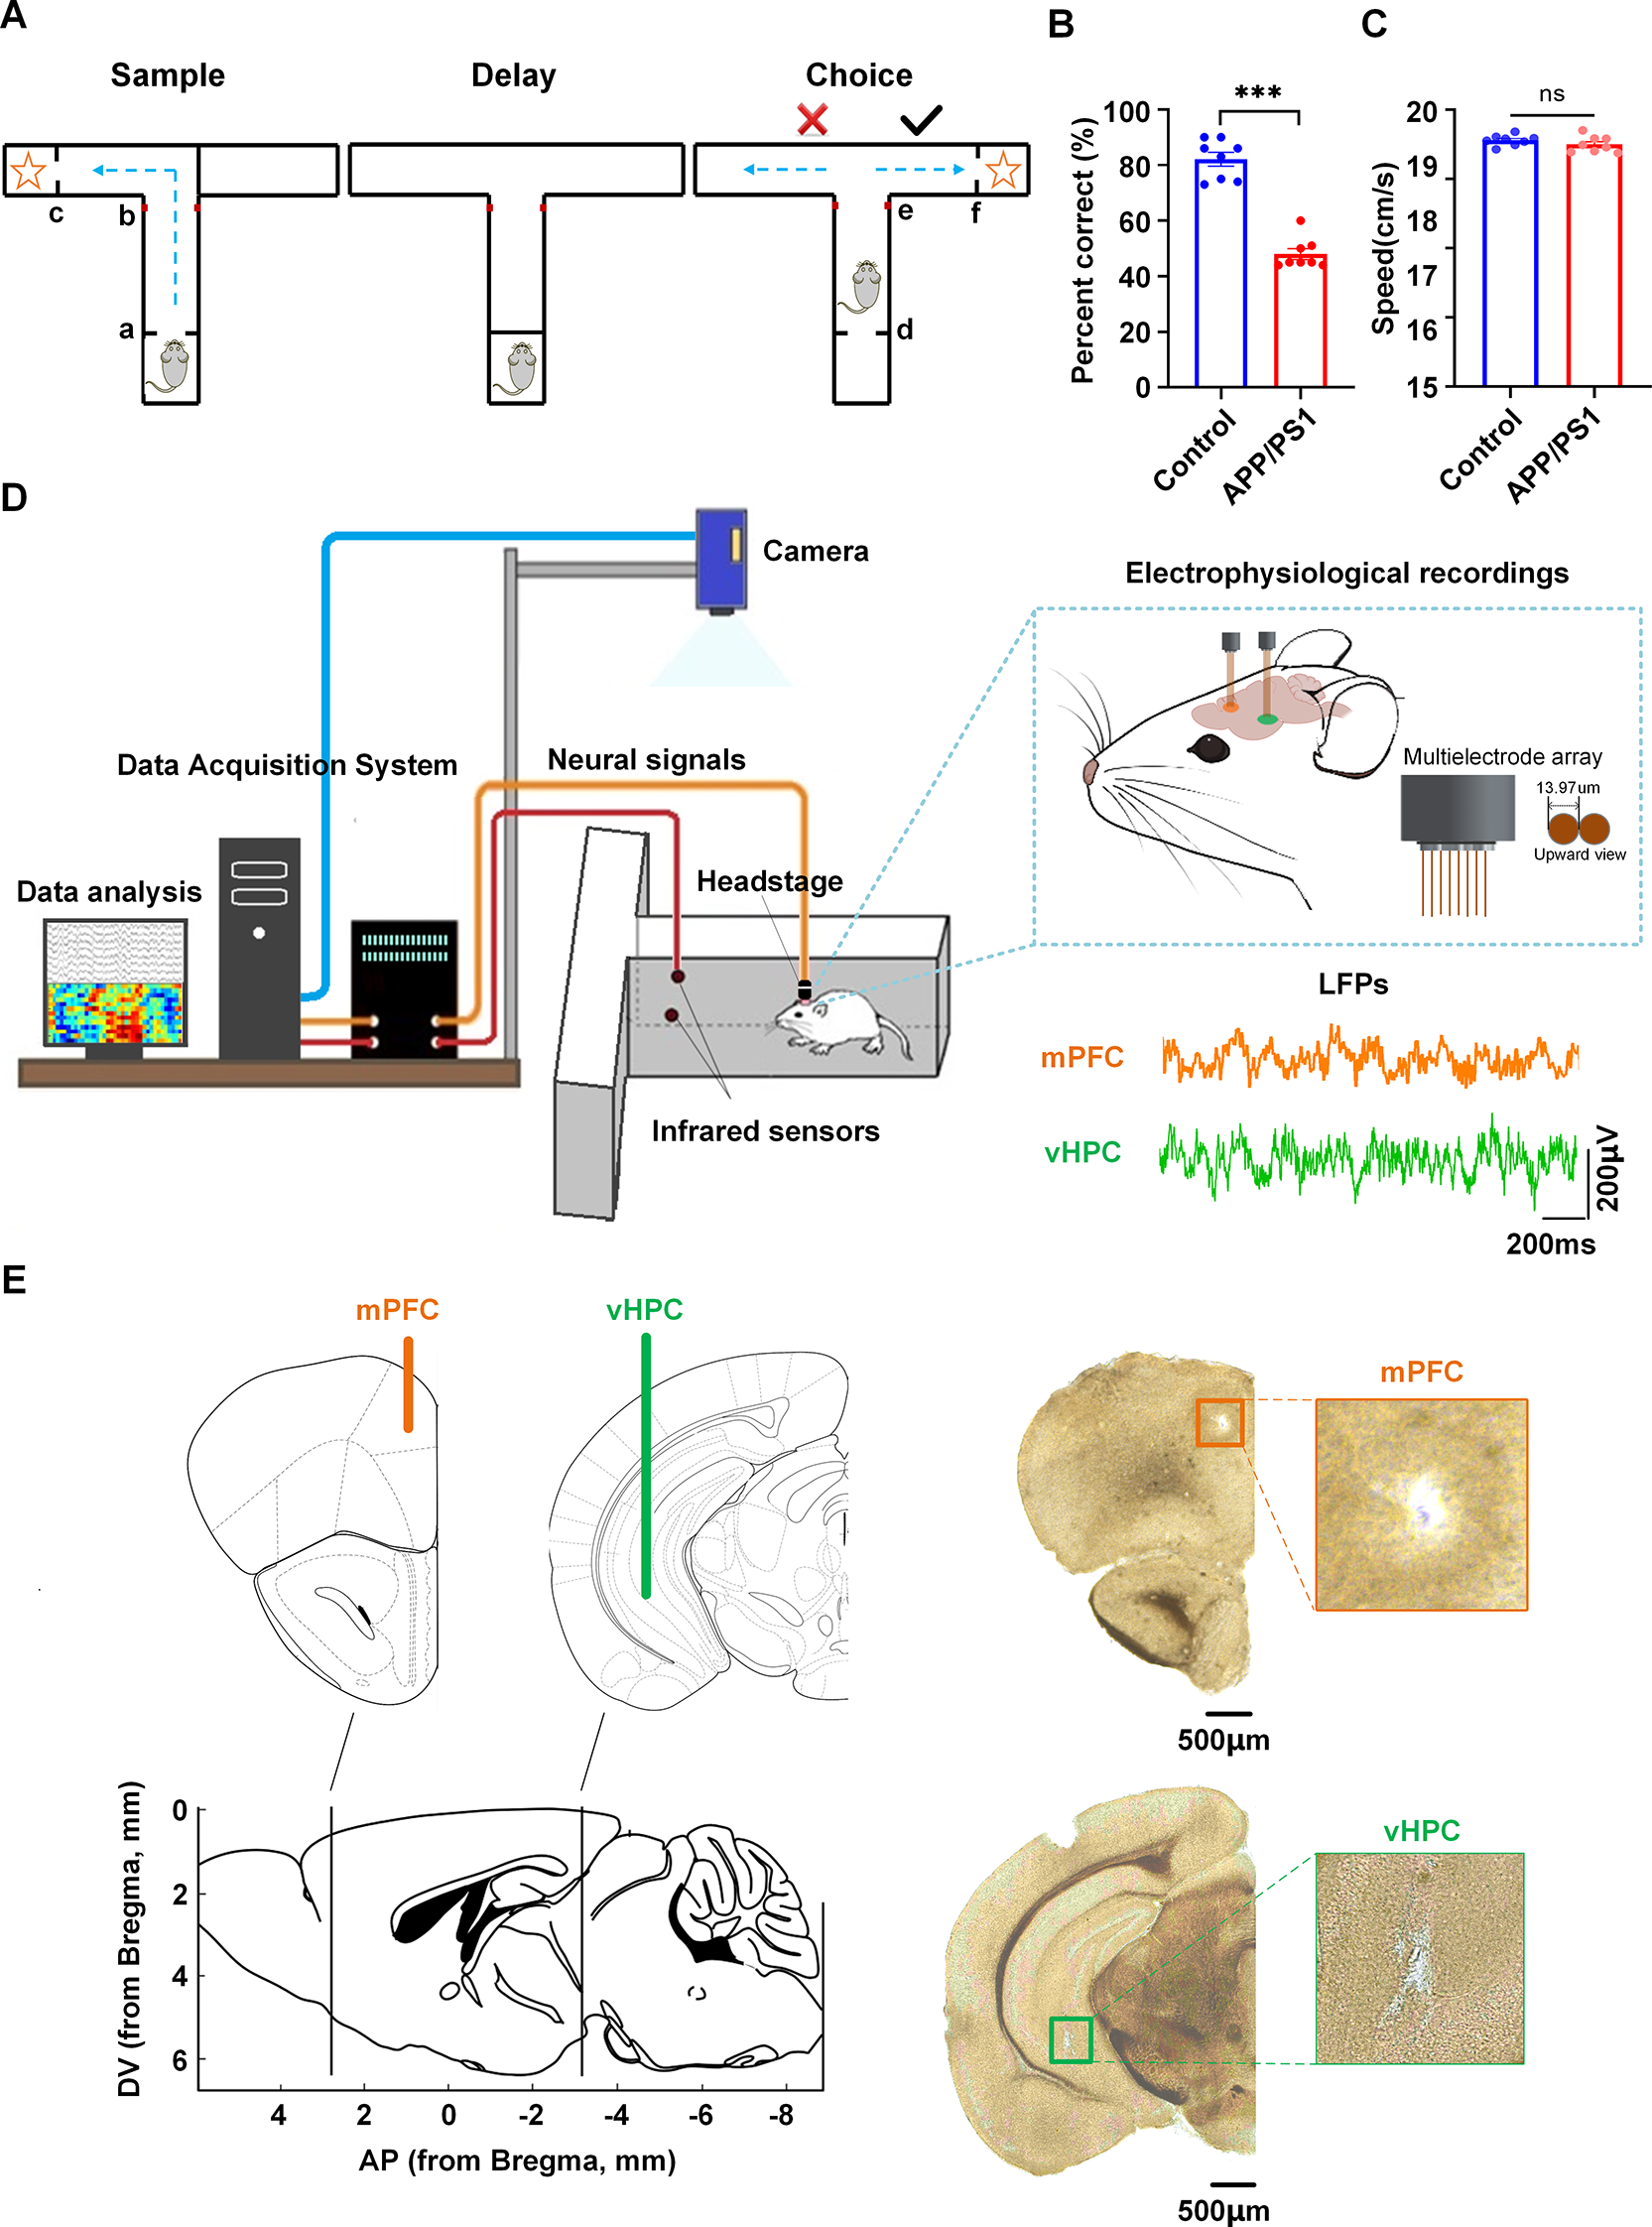


To evaluate spatial working memory performance, we trained male APP/PS1 mice and wild-type controls on a T-maze delayed non-match-to-place (DNMTP) task. The task paradigm consisted of three phases: a sample phase for encoding, a 10-second delay period for memory maintenance, and a choice phase for retrieval (Fig. 1A). Behavioral analysis demonstrated significant cognitive impairment in APP/PS1 mice, as evidenced by their substantially lower correct response rate (48.13% ± 1.96%) compared to controls (82.13% ± 2.51%; Mann-Whitney test, p = 0.0002; Fig. 1B). Locomotor analysis showed comparable running speeds between control (17.81 ± 0.14 cm/s) and APP/PS1 mice (17.51 ± 0.20 cm/s; Mann-Whitney test, p = 0.2331; Fig. 1C).
Fig. 1
Behavioral task and recording sites. (A) Schematic of DNMTP task. During the sample phase, mice navigated from the start point ‘a’ through the central junction ‘b’ to a rewarded goal arm ‘c’. Following a 10-second delay, mice were reintroduced at the start position ‘d’ and required to choose the alternate arm to obtain reward ‘f’, with decision point ‘e’ tracked. (B) Correct response rates (C) Running speed (D) Experimental setup. Left: schematic of electrophysiological recordings from vHPC and mPFC during the task. Upper right, electrode configuration; Bottom right, representative LFP traces from mPFC (orange) and vHPC (green). (E) Histological verification. Left: Coronal sections. (adapted from Paxinos and Franklin, 2001) showing the electrode placements. Right: Representative histological images with recording sites in mPFC and vHPC indicated by rectangles. Scale bar: 500 μm
For neural activity recordings, we surgically implanted chronic microelectrode arrays targeting the vHPC and mPFC. Following postoperative recovery, neural activity was acquired during DNMTP task performance using a multichannel acquisition system (Fig. 1D). Histological verification confirmed proper electrode placement within target regions (Fig. 1E; Supplementary Fig. 1), with only correctly localized recordings included in final analyses. The final dataset included 394 trials (196 APP/PS1, 198 control) from 16 mice (n = 8 per group), with all animals exhibiting stable vHPC-mPFC recordings across all behavioral phases (sample, delay, choice).
Fig. 2
Altered oscillatory dynamics in APP/PS1 mice during encoding. (A) Time-frequency representations of power spectra in vHPC and mPFC during sample phase (control vs. APP/PS1; n = 8 mice per group). Mice start from point ‘a’ through the junction ‘b’ to get a rewarded ‘c’. (B) Frequency-band power comparisons (one-way ANOVA followed by Bonferroni’s test, ****p < 0.0001). (C) Left: Temporal dynamics of power spectral density in the low-gamma band in vHPC. Right: Comparison of peak PSD (Mann-Whitney test, **p < 0.01). (D) Same as (C), but for mPFC (**p < 0.01). (E) Left: Temporal dynamics of PSD in the theta band in vHPC. Right: Comparison of peak PSD (Mann-Whitney test, **p < 0.01). (F) Same as (E), but for mPFC (**p < 0.01). (G) Left: Frequency-dependent coherence analysis revealed significant variations in neural synchronization. Right: Comparison of peak coherence in theta and low-gamma (Mann-Whitney test, *p < 0.05). (H) Phase-amplitude coupling analysis revealed significant theta phase to low-gamma amplitude coupling. Left: Color map depicts theta phase modulation of low-gamma amplitude, with warmer colors indicating stronger coupling. Right: Comparison of mean modulation index (t-test, ****p < 0.0001)
Time-frequency analysis of LFP power spectra revealed robust theta oscillations (4–12 Hz) in both vHPC and mPFC across groups (Fig. 2A). Power spectral density (PSD) quantification confirmed theta rhythms as the dominant oscillatory mode in both regions (Fig. 2B). Notably, we also observed a striking enhancement of low-gamma activity (30–40 Hz) in both groups. To characterize the dynamic modulation of oscillatory activity during spatial navigation, we analyzed the changes of theta and low-gamma power during sample runs using z-score normalized power spectra. This normalization accounted for both electrode impedance variations and inter-subject variability in absolute power.
Control mice exhibited pronounced spatial tuning of theta oscillations, with peak power occurring specifically near reward locations (‘c’) (Fig. 2C; control: repeated measures ANOVA, F(2.789, 19.52) = 24.48, p < 0.0001; APP/PS1: repeated measures ANOVA, F(2.827, 19.79) = 7.850, p = 0.0014), with significantly greater power (1.0330 ± 0.0980) compared to APP/PS1 mice (0.6305 ± 0.0244; Mann-Whitney test, p = 0.0047). In contrast, control mice demonstrated a low-gamma (30–40 Hz) power enhancement in vHPC around decision point ‘b’, which was markedly attenuated in APP/PS1 mice (Fig. 2D; Control: repeated measures ANOVA, F(3.312, 23.18) = 6.345, p = 0.0021; APP/PS1: repeated measures ANOVA, F(2.297, 16.08) = 7.479, p = 0.0039). Between-group comparisons confirmed significantly stronger low-gamma power in controls (0.7625 ± 0.0669) versus APP/PS1 mice (0.4494 ± 0.0258) (Mann-Whitney test, p = 0.0018).
In mPFC, both groups exhibited significant theta power increases at decision point ‘b’ (Fig. 2E; Control: repeated measures ANOVA, F(3.738, 26.17) = 12.33, p < 0.0001; APP/PS1: repeated measures ANOVA, F(3.278, 22.95) = 14.67, p < 0.0001). Quantitative comparisons confirmed significantly stronger theta power in controls (0.9046 ± 0.1140) versus APP/PS1 mice (0.5014 ± 0.0446) (Mann-Whitney test, p = 0.0093). Furthormore, both groups showed robust low-gamma (30–40 Hz) power increases preceding reward locations (‘c’) (Fig. 2F; repeated measures ANOVA: control, F(2.152, 15.07) = 12.23, p = 0.0006; APP/PS1, F(3.307, 23.15) = 24.98, p < 0.0001). Quantitative analysis also revealed stronger low-gamma power in controls (0.9444 ± 0.0932) compared to APP/PS1 mice (0.4913 ± 0.0487) (Mann-Whitney test, p = 0.0014).
Furthermore, the oscillatory activity exhibited region-specific temporal patterns: vHPC gamma preceded mPFC gamma, while mPFC theta led vHPC theta. However, these inter-regional latencies did not differ between groups (Supplementary Fig. 2; Mann-Whitney test, low-gamma p = 0.5204; theta p = 0.6255), suggesting preserved temporal coordination despite power reductions in APP/PS1 mice.
Inter-regional coherence analysis revealed significant frequency-dependent coupling between vHPC and mPFC in both groups (Fig. 2G; Control: repeated measures ANOVA, F(119, 833) = 22.96, p < 0.0001; APP/PS1: repeated measures ANOVA, F(119, 833) = 23.71, p < 0.0001). However, APP/PS1 mice exhibited markedly reduced coherence compared to controls in both theta (Control: 0.6127 ± 0.0334, APP/PS1: 0.4925 ± 0.0285; Mann-Whitney test, *p < 0.05) and low-gamma band (Control: 0.3269 ± 0.0287, APP/PS1: 0.2220 ± 0.0388; Mann-Whitney test, *p < 0.05).
Phase-amplitude coupling analysis demonstrated significant theta phase to low-gamma amplitude coupling in both groups during the sample phase (Fig. 2H). However, quantitative comparison showed APP/PS1 mice exhibited significantly weaker coupling strength (0.0029 ± 0.0001) than controls (0.0035 ± 0.0001) (t-test, ****p < 0.0001). Notably, this coupling impairment occurred alongside decreased intra-regional coupling within both vHPC and mPFC (Supplementary Fig. 3A). Importantly, behavioral performance correlated with coupling strength, as correct trials showed enhanced low-gamma coupling compared to errors in both groups (Supplementary Fig. 3B). Furthermore, this coupling enhancement was specifically restricted to theta-low gamma interactions, while theta-high gamma coupling remained unaffected (Supplementary Fig. 3C).
Impaired amplitude-based information flow from vHPC to mPFC in APP/PS1 miceTo assess directional information transfer between vHPC and mPFC, we performed directed amplitude transfer entropy (dATE) analysis (units: bits) across all task phases (Fig. 3A). Spectral analysis demonstrated that theta and low-gamma oscillations served as the primary frequency bands mediating interregional communication during memory encoding (Fig. 3B); Both groups exhibited significant frequency-dependent modulation of information transfer (Control: repeated measures ANOVA, F(1.833, 12.83) = 33.70, p < 0.0001; APP/PS1: repeated measures ANOVA, F(2.408, 16.85) = 73.11, p < 0.0001).
Fig. 3
Impaired amplitude-based information transfer between vHPC and mPFC during encoding in APP/PS1 mice. (A) Directed amplitude transfer entropy (dATE) schematic. Positive dATE values indicate information flow from vHPC to mPFC, while negative dATE values indicate information flow from mPFC to vHPC. (B) Frequency-resolved dATE comparisons (n = 8 mice per group; repeated measures ANOVA, *p < 0.05, **p < 0.01, ***p < 0.001, ****p < 0.0001). (C) Temporal dynamics of low-gamma dATE for control and APP/PS1 mice. Left: Time-resolved dATE during sample phase. Right: Comparison of mean dATE(a→b), mean dATE(b→c) and peak dATE(b→c). Paired t-test or Mann-Whitney test, **p < 0.01,***p < 0.001, ****p < 0.0001. (D) Temporal dynamics of theta dATE for control and APP/PS1 mice. Left: Time-resolved dATE during sample phase. Right: Comparison of mean dATE(a→b), mean dATE(b→c) and trough dATE(a→b). (E) Dynamic changes of dATE in low-gamma and theta bands during sample runs versus choice runs. (F) Behavioral correlations: Low-gamma dATE positively (left), theta negatively (right) correlated with task performance (Pearson’s r)
During spatial navigation, both groups demonstrated progressive increases in vHPC→mPFC information transfer (dATE) in the low-gamma band from decision point ‘b’ to reward location ‘c’ (Fig. 3C). However, APP/PS1 mice exhibited significantly attenuated directional communication (Control: mean dATEa→b: 0.0002 ± 0.0022, mean dATEb→c: 0.0118 ± 0.0024, paired t-test, p < 0.0001; APP/PS1: mean dATEa→b: -0.0006 ± 0.0002, mean dATEb→c: 0.0061 ± 0.0008, paired t-test, p < 0.001; peak dATE(b→c): Control: 0.0238 ± 0.0036, APP/PS1: 0.0104 ± 0.0010, Mann-Whitney test, p < 0.01).
Theta-band information flow revealed distinct directional patterns, with maximal mPFC→vHPC transfer occurring between start point ‘a’ and decision points ‘b’ that were reduced in APP/PS1 mice (Fig. 3D; Control: mean dATEa→b: -0.0121 ± 0.0028, mean dATEb→c: -0.0022 ± 0.0028, paired t-test, p = 0.0004; APP/PS1: mean dATEa→b: 0.0065 ± 0.0008, mean dATEb→c: -0.0001 ± 0.0007, paired t-test, p = 0.0003; trough dATE (a→b): Control: -0.0211 ± 0.0029, APP/PS1: -0.0129 ± 0.0010, Mann-Whitney test, p < 0.05).
These significant modifications in both low-gamma and theta bands were exclusively observed during sample runs but not observed during choice runs (Fig. 3E; Top-left (theta): Sample_control: Repeated Measures ANOVA test, F = 34.3, p < 0.0001; Choice_control: F = 1.176, p = 0.3353; Top-right (theta): Sample_APP/PS1: F = 45.62, p < 0.0001; Choice_APP/PS1: F = 1.942, p = 0.30862; Bottom-left (low-gamma): Sample_control: F = 26.51, p < 0.0001; Choice_control: F = 1.334, p = 0.2582; Bottom-right (low-gamma): Sample_APP/PS1: F = 34.07, p < 0.0001; Choice_APP/PS1: F = 0.9408, p = 0.4824) or delay phase (Supplementary Fig. 4). Shuffling analysis further confirmed that the observed information flow was not due to random fluctuations (Supplementary Fig. 5; low-gamma: Peak dATE: Real: 0.0238 ± 0.0036, Shuffled: 0.0010 ± 0.00004, Mann-Whitney test, p < 0.001; theta: trough dATE: Real: -0.0211 ± 0.0029, Shuffled: -0.0008 ± 0.00004, Mann-Whitney test, p < 0.0001).
Regression analysis revealed a significant correlation between dATE magnitudes and behavioral accuracy in both groups (Fig. 3F; low-gamma: Pearson’s correlation, r = 0.8475; Y = 0.0004*X–0.0108, p < 0.0001; theta: Pearson’s correlation, r = 0.7960; Y=-0.0003*X + 0.0021, p = 0.0002), suggesting that enhanced theta and low-gamma flow supports task performance.
Impaired phase-based information flow from vHPC to mPFC during encoding in APP/PS1 miceTo investigate the phase-dependent information transfer, we conducted phase slope index (PSI) analysis on theta (4–12 Hz) and low-gamma (30–40 Hz) components during the task (Fig. 4A). Mean vector length analysis demonstrated significant phase preference (Fig. 4B). Both groups exhibited enhanced vHPC→mPFC information flow in the low-gamma band from the decision point ‘b’ to reward location ‘c’ (Fig. 4C-D). APP/PS1 mice showed significantly attenuated PSI values compared to controls (Fig. 4E; Control: mean PSIa→b: 0.0002 ± 0.0059, mean PSIb→c: 0.0355 ± 0.0028, paired t-test, p < 0.001; APP/PS1: mean PSIa→b: -0.0071 ± 0.0021, mean PSIb→c: 0.0158 ± 0.0031, paired t-test, p < 0.01; peak PSIb→c: Control: 0.0749 ± 0.0034, APP/PS1: 0.0424 ± 0.0056; Mann-Whitney test, p < 0.001).
Fig. 4
Reduced phase-based information transfer from vHPC to mPFC during encoding in APP/PS1 mice. (A) Representative superimposed traces of theta (4–12 Hz) and low-gamma (30–40 Hz) filtered LFPs recorded simultaneously from mPFC and vHPC. (B) MVL: each black dot represents an individual data point of the analytical signal. When phase-amplitude coupling is present, a subset of these vectors (typically corresponding to high-amplitude gamma oscillations in mPFC) cluster at a specific phase angle of the theta rhythm in vHPC, resulting in longer vectors within a narrow phase range. The red vector is the mean of all black vectors. Its length quantifies the strength of phase-amplitude coupling, while its phase angle indicates the preferred theta phase at which gamma amplitude is maximized. (C) Time-frequency plots of phase slope index (PSI) showing directional coupling between regions (positive values indicate vHPC→mPFC information flow). (D) Frequency-resolved mean PSI differences between control and APP/PS1 groups. (E) Low-gamma band directional coupling. Left: Time course of mean PSI during sample runs; Right: Comparison of mean PSI (a→b), mean PSI (b→c) and peak PSI (b→c) (Mann-Whitney test, *p < 0.05, ***p < 0.001). (F) Same analysis as (E) for theta frequencies (Mann-Whitney test, *p < 0.05, ns = not significant). (G) Enhanced low-gamma flow from vHPC to mPFC during sample runs but not choice runs. Left: Temporal dynamics of low-gamma PSI during sample vs. choice runs. Right: Significant enhancement of mean PSI specifically during sample runs (Mann-Whitney test, ***p < 0.001). (H) Low-gamma PSI strength positively correlated with task performance (Pearson’s r = 0.8610, p < 0.0001), while theta PSI showed weak significant correlation (Pearson’s r = 0.3546, p = 0.1776)
Time-frequency PSI analysis indicated a pronounced enhancement in low-gamma band during encoding and the APP/PS1 mice exhibited a significantly lower PSI compared to controls (Fig. 4C-D). In contrast, theta-band PSI analysis revealed significant task-related modulation during encoding, the peak PSI remarkbly weaker and showed no differences between groups (Fig. 4F; Control: mean PSIa→b: -0.0068 ± 0.00418, mean PSIb→c: 0.0128 ± 0.0023, paired t-test, p < 0.001; APP/PS1: mean PSIa→b:-0.001760 ± 0.002643, mean PSIb→c: 0.0058 ± 0.0014, paired t-test, p < 0.05; peak PSIb→c: Control: 0.0270 ± 0.0028, APP/PS1: 0.0213 ± 0.0028; Mann-Whitney test, p = 0.1605).
To determine the behavioral specificity of enhanced low-gamma flow, we performed PSI analysis comparing sample and choice runs. Despite behavioral similarity, the PSI analysis revealed the enhanced low-gamma flow from vHPC to mPFC during sample runs but not choice runs in both control and APP/PS1 mice (Fig. 4G; Top (Control): Sample: Repeated Measures ANOVA test, F = 35.16, p < 0.0001; Choice: F = 1.590, p = 0.1630; Sample: 0.0355 ± 0.0028, Choice: 0.0034 ± 0.00003; Mann–Whitney test, p < 0.001; Bottom (APP/PS1): Sample: F = 21.86, p < 0.0001; Choice: F = 3.744, p = 0.2834; Sample: 0.0158 ± 0.0031, Choice: 0.0015 ± 0.0001, t-test, p < 0.001) or delay phase (Supplementary Fig. 6). Shuffling analysis further confirmed that the observed modulation was not due to random fluctuations (Supplementary Fig. 7). Regression analysis identified a strong positive association between low-gamma PSI and behavioral accuracy (Fig. 4H; Pearson’s correlation, r = 0.8610; Y = 0.0001*X–0.0041, p < 0.0001). In contrast, theta-band PSI showed no significant behavioral correlation (Pearson’s correlation, r = 0.3546; Y = 0.0002*X + 0.0140, p = 0.1776). These results demonstrate the frequency-specific directional connectivity specifically supports successful memory encoding.
Integrated phase and amplitude information flow supports working memory encodingTo quantify the behavioral relevance of low-gamma directional connectivity, we developed a decoding model integrating PSI and dATE measures (Fig. 5A). The model successfully decoded goal locations, with control mice exhibiting peak decoding accuracy (84%) near the decision point ‘b’ (Fig. 5B; Real: 0.7882 ± 0.0069, Shuffled: 0.1925 ± 0.0002; Mann–Whitney test, p < 0.0001). In contrast, APP/PS1 mice showed markedly impaired decoding performance (Fig. 5C; Control: 0.7882 ± 0.0069, APP/PS1: 0.6386 ± 0.0033; Mann–Whitney test, p < 0.0001), aligning with their behavioral deficits.
Model ablation analysis revealed that both phase (PSI) and amplitude (dATE) measures contributed uniquely to goal decoding accuracy(Fig. 5D). The combined PSI + dATE model achieved significantly higher performance (0.7882 ± 0.0069) compared to either measure alone (PSI-only: 0.4365 ± 0.0055; dATE-only: 0.5916 ± 0.0030; one-way ANOVA followed by Bonferroni’s test, F(2, 150) = 10.64, p < 0.0001), demonstrating that phase and amplitude dynamics encode complementary spatial information. This synergistic effect suggests successful memory encoding requires integration of both temporal coordination (phase) and signal strength (amplitude) in vHPC-mPFC communication.
Fig. 5
Goal location decoding based on vHPC→mPFC amplitude- and phase-based information flow. (A) Schematic illustration of the decoding model (see Methods for details). (B) Left: Location-specific decoding accuracy across T-maze positions (Solid line: group mean; shading area: 95% confidence interval) in control animals. Right: Significant difference between real and shuffled data accuracy (Mann-Whitney test, ****p < 0.0001). (C) Comparative decoding performance between control and APP/PS1 groups (Mann-Whitney test, ****p < 0.0001). (D) Decoding efficacy using PSI and/or dATE (one-way ANOVA followed by Bonferroni’s test, ****p < 0.0001)
In summary, our results demonstrate that successful spatial working memory encoding requires coordinated phase- and amplitude-based low-gamma communication from vHPC to mPFC. APP/PS1 mice exhibit a specific deficit in this directed information transfer during encoding, which correlates with their impaired behavioral performance. These findings suggest that disrupted low-gamma synchronization in vHPC-mPFC may represent a key mechanism underlying working memory deficits in AD models.
Comments (0)