
Remember me


Participants were persons at the outpatient clinic of the Department of Rehabilitation Medicine, Juntendo University Hospital, from July 2017 to July 2023.
The inclusion criteria of this study were as follows. Participants were diagnosed with cerebral infarction or cerebral hemorrhage by brain computed tomography (CT) and magnetic resonance imaging (MRI). The time from stroke onset was greater than 5 months. Participants showed hemiparesis, and their ages ranged from 20 to 80 years. Their stroke impairment assessment set (SIAS) hip flexion test, knee extension test, and lower extremity position score [21] was ≥ 1. Participants could maintain half sitting in a chair without assistance and walk on a treadmill.
The exclusion criteria were as follows: (a) severe cardiac disease; (b) uncontrolled hypertension; (c) acute illness and fever; (d) recent medical history of pulmonary embolism, acute cor pulmonale, or severe pulmonary hypertension; (e) severe liver failure or renal failure; (f) orthopedic complications preventing exercise; (g) severe cognitive impairment or mental illness; (h) another metabolic disease; (i) a pacemaker, cerebral clipping, or shunt operation; and (j) a contraindication for electrical stimulation.
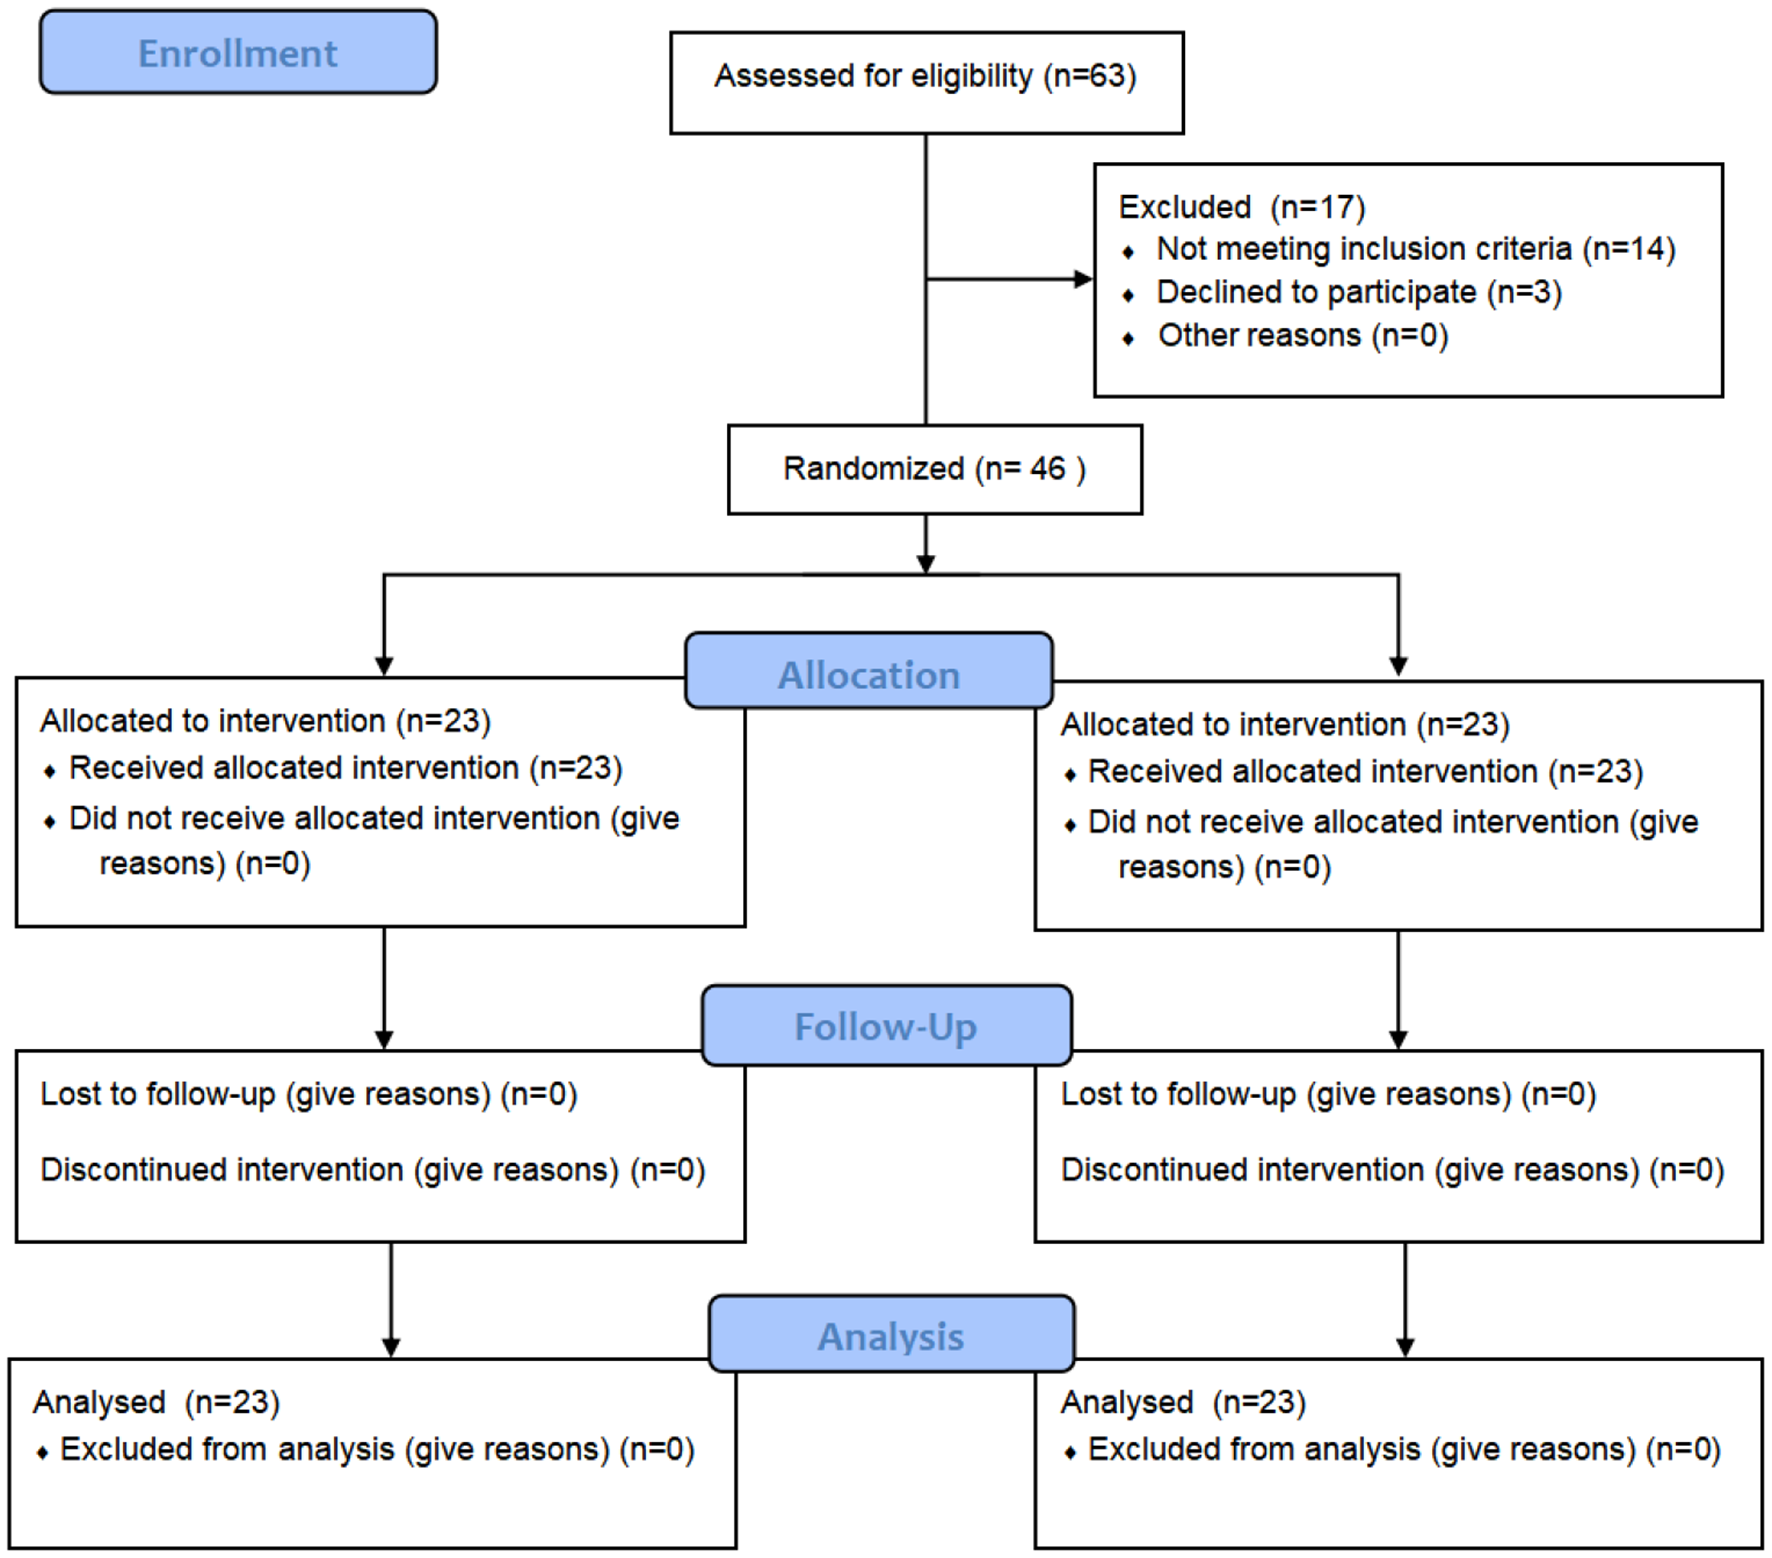
All participants were randomly allocated to the three groups: spinal stimulation and hip extensor electrical stimulation combined with treadmill gait training (FAST walk); spinal stimulation combined with treadmill gait training (spinal stim); and treadmill gait training (treadmill). The randomized blocking allocation was performed using a random number table.
We hypothesized that the difference change of the 10 m walk test is 3.0 s, and standard deviation is 2 s, and significant difference level 0.05 and power is 0.8. The estimated sample size of each three group is 7. Therefore, we determined total sample size 30.
This study was approved by the Juntendo University Hospital Ethics Committee (CRB3180012) and was registered in the Japan Registry of Clinical Trial (JRCT registration ID: jRCTs032180289).
All participants provided written informed consent according to the protocol approved by the local institutional review board. The study was performed according to the Declaration of Helsinki.
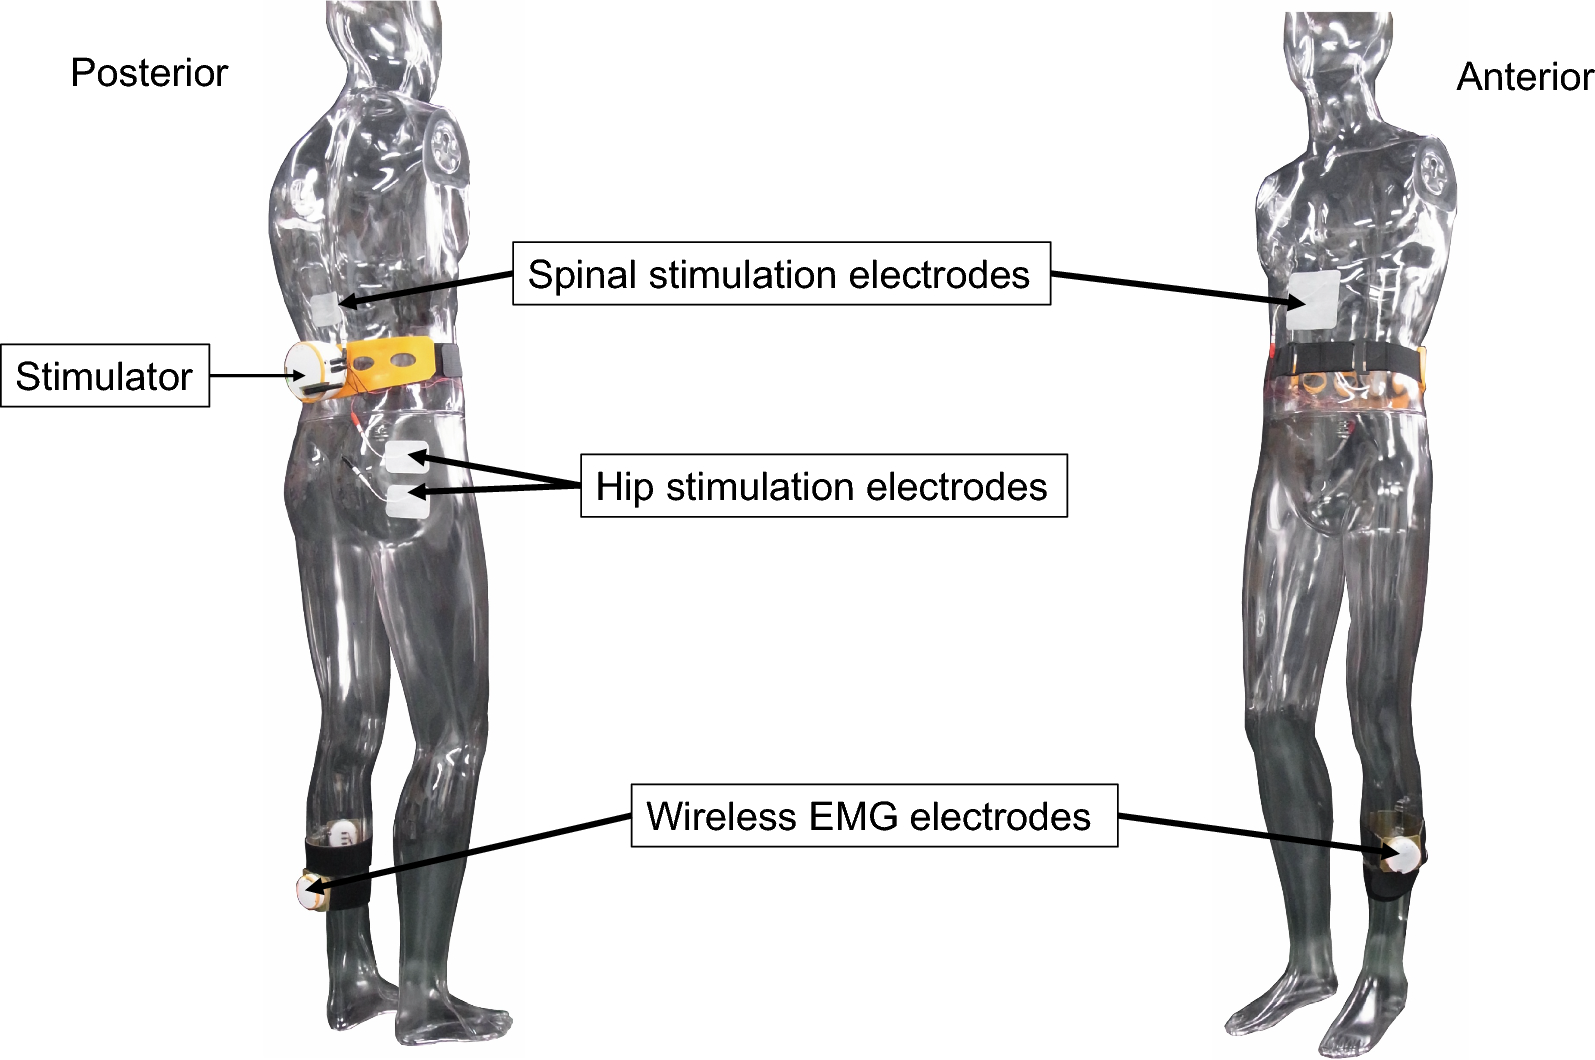
Electromyography-triggered transcutaneous spinal cord stimulation and hip stimulation (Fig. 1).
Fig. 1
Electromyography-triggered transcutaneous spinal cord stimulation and hip stimulation. Spinal electrical stimulation electrodes are placed on the Th11-12 spinal process and lower margin of the sternum. An anodal electrode (10 cm × 10 cm) is placed on the lower margin of the sternum, and a cathodal electrode (5 cm × 7 cm) is placed on the Th11-12 spinal process. Wireless surface electromyography (EMG) electrodes are placed on the unaffected soleus muscle. Hip stimulation is applied to the gluteus maximus of the affected side with surface stimulation electrodes (5 cm × 7 cm). The hip stimulation is triggered with the wireless surface EMGs of the unaffected tibialis anterior (TA) muscle
Spinal electrical stimulation electrodes were placed on the Th11-12 spinal process and lower margin of the sternum. Spinal electrical stimulation is supposed to stimulate the dorsal root afferent nerve and activate the spinal locomotor circuit. The electrical current flows from the anodal electrode to the cathodal electrode. Depolarization is easy to occur under a cathodal electrode. An anodal electrode (10 cm × 10 cm) was placed on the lower margin of the sternum, and a cathodal electrode (5 cm × 7 cm) was placed on the Th11-12 spinal process.
Wireless surface electromyography (EMG) electrodes (band-pass filtered at 20–250 Hz) were placed on the unaffected soleus muscle. Spinal electrical stimulation was triggered with EMG activities of the unaffected soleus muscle. A trigger line was set at 0.2 mV for unaffected soleus EMG amplitude. Spinal stimulation was applied during the unaffected soleus EMG amplitude exceeded the trigger line. This means that spinal electrical stimulation was applied at the initial swing and mid-stance phase of the affected lower extremity.
The stimulation frequency was set at 100 Hz with a monophasic pulse width of 1 ms. The intensity of spinal electrical stimulation was set at twice the sensory threshold. Sensory thresholds were determined as the minimum intensity of spinal electrical stimulation that participants felt stimulation.
In the FAST walk group, in addition to the spinal stimulation, the hip stimulation was applied to the gluteus maximus of the affected side with surface stimulation electrodes (5 cm × 7 cm). The hip stimulation intensity was set at the affected gluteus maximus motor threshold. Motor threshold was determined as the minimum intensity to induce palpable muscle twitching in the affected gluteus maximus. The hip stimulation frequency was set at 20 Hz to assist the paretic hip extension, and the monophasic pulse width was 1 ms. Previous study showed that torque was preserved to a greater degree during low-frequency electrical stimulation compared to high-frequency electrical stimulation [22]. It was suggested that low-frequency 20 Hz electrical stimulation effectively assisted hip movement at low intensity avoiding pain. Hip stimulation was triggered with the peak surface EMGs of the unaffected tibialis anterior (TA) muscle. Wireless surface EM electrodes (band-pass filtered at 20–250 Hz) were placed on the unaffected TA muscle. A trigger line was set at 0.2 mV for unaffected TA muscle EMG amplitude. The hip stimulation was applied during the unaffected TA muscle EMG amplitude exceeded the trigger line.
The FAST walk system was made by Pacific Supply Co. and is not commercially available. It was patented (Japan 6751881, USA 10,668,281, China ZL201680015103).
Electromyogram signals were collected in a PC controller. EMG was monitored online on the PC screen, and the trigger line for each trial was set manually. The PC was wirelessly connected to the wireless surface EMG device and the stimulator. The stimulator had two stimulation channels, one for spinal cord stimulation and the other for hip joint stimulation.
Participants performed two sets of 15-min treadmill gait training with 5-min intervals in the FAST walk, spinal stim, and treadmill groups. During the 5-min interval, participants were asked to be seated and rest for 5 min. Gait training was performed twice weekly, for a total of 10 sessions.
The treadmill gait speed was set at a comfortable speed, each participant walk on the treadmill for 15 min with modified Borg scale moderate 3 [23]. Participants were allowed to use the orthosis that they used during their usual gait.
Clinical assessmentsA 10-m walking test, gait analysis, and spinal reciprocal inhibition were performed before intervention, post-intervention, and 4 weeks after the end of the intervention.
The participants did not receive any additional physical therapy between post-intervention and 4 weeks after the end of the intervention.
10-m walking testThe primary outcome was the time for a 10-m walk at a comfortable speed. The test was performed twice, and the faster time obtained was recorded to the nearest 1/100 s [24].
Gait analysisParticipants were asked to walk on the pressure-instrumented treadmill (Noraxon Co., Scottsdale, Arizona, USA) at their comfortable speed for 5 min. The times of the stance and swing phases of both affected and unaffected feet were measured. The time symmetry index (TSI) was calculated as (unaffected stance phase (%)—affected stance phase (%))/0.5 (unaffected stance phase (%) + affected stance phase (%)) [25]. When the TSI is 0, gait is completely symmetrical.
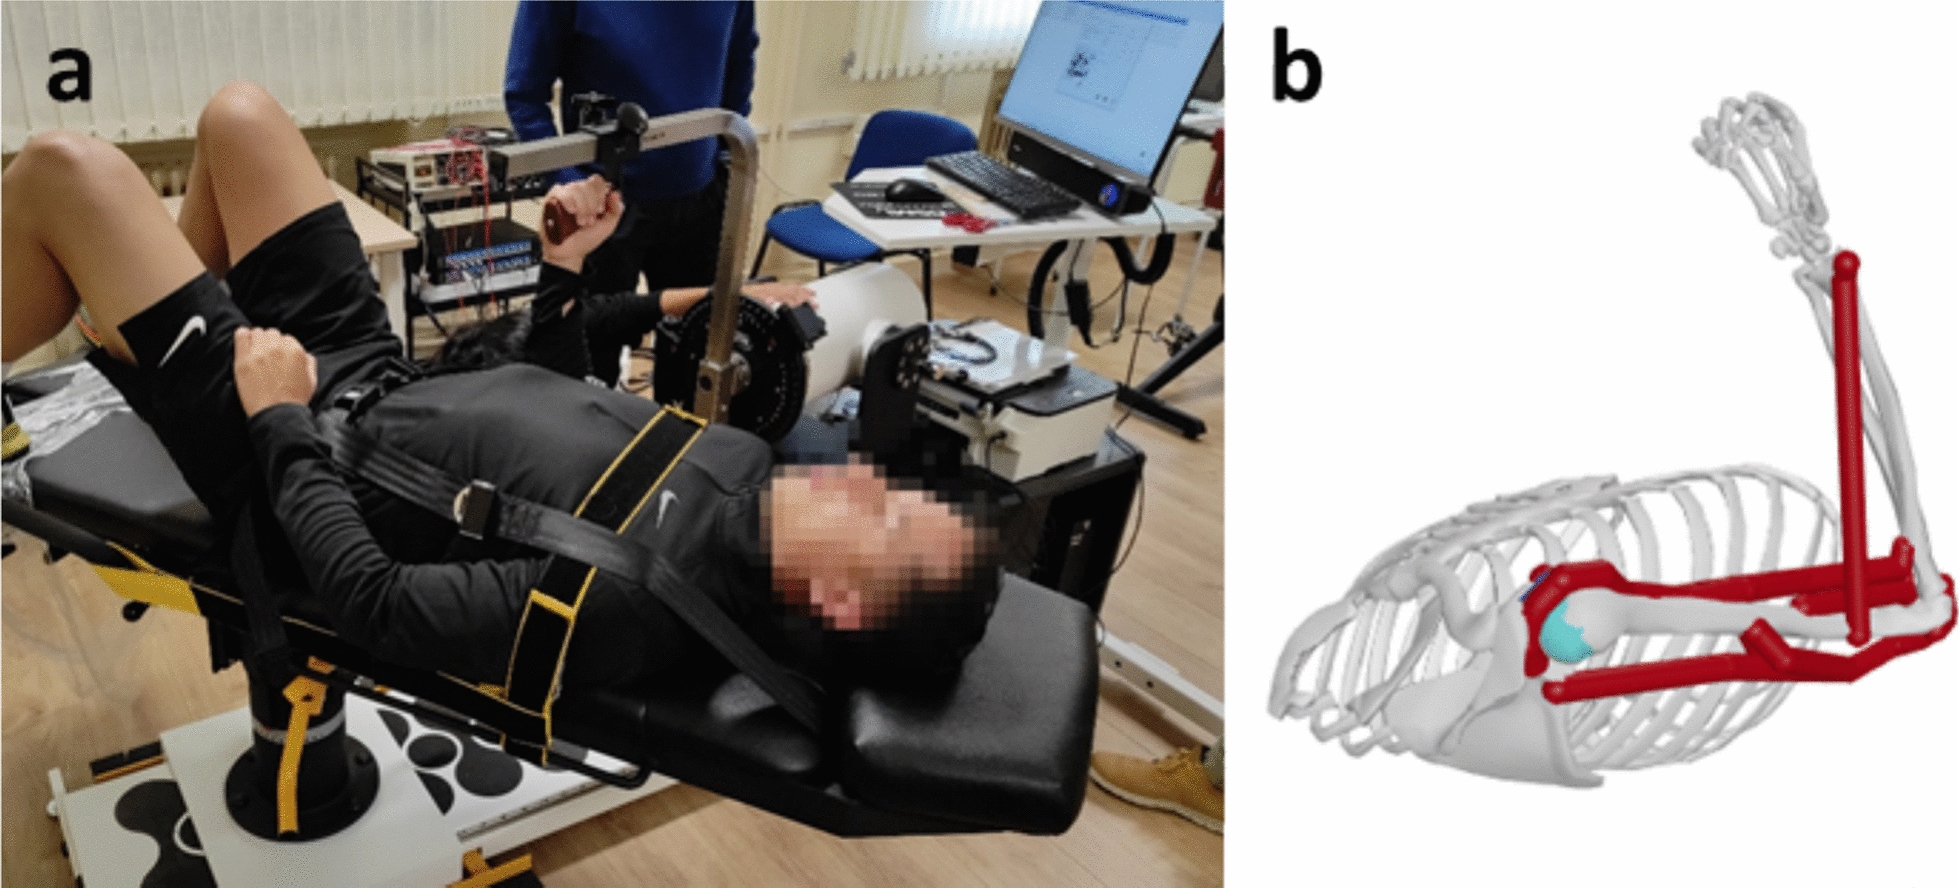
Spinal reciprocal inhibition (RI)RI was assessed with a soleus H reflex conditioning-test paradigm. Ten conditioned and 10 test H reflexes were averaged. The H reflex was elicited by stimulating the tibial nerve at the popliteal fossa (1-ms rectangular pulse). The test soleus H reflex amplitude was maintained at 15–20% of the maximal compound muscle action potential (M max) [26]. Conditioning stimulation to the common peroneal nerve was delivered below the head of the fibula. The stimulus intensity of conditioning stimulation was set at the motor threshold (MT), defined as a 100 μV response of the TA. The conditioning-test interval was set at 0, 1, 2, 3, and 20 ms. The optimal interval from 0 to 3 ms to produce reciprocal inhibition was determined at the beginning of each session and used throughout and defined as disynaptic reciprocal inhibition (RI0ms). Reciprocal inhibition, with an interstimulus interval of 20 ms, was defined as presynaptic reciprocal inhibition (RI20ms) [27]. The mean values of the test and the conditioned test H reflexes were determined. The amount of RI was defined as: (mean test H reflex amplitude – mean conditioned H reflex amplitude) / mean test H reflex amplitude.
Data analysisThe results are expressed as mean and standard deviation values. Statistical analysis was performed primarily to determine the efficacy of the transcutaneous spinal and hip stimulation system in persons with chronic stroke, and data analysis was performed on an intention-to-treat basis. Normality was assessed with the Shapiro–Wilk test. The baseline parameters are known to be associated with the outcome. Baseline covariates were accounted for at the design stage of this trial in the statistical analysis. Therefore, we used analysis of covariance (ANCOVA) [28]. Two-way analysis of covariance (ANCOVA), using the baseline measure as the covariate, with the factors group (FAST walk, spinal stim, and treadmill) and time (before, post, and post-4w assessment) was performed to investigate whether the newly developed transcutaneous spinal stimulation system improves 10-m walking time, TSI, RI0ms, and RI20ms. We set the 10-m walking time as the primary outcome, post hoc analyses were conducted to detect the effect from before to after the intervention using paired t-tests with the Bonferroni correction. For other secondary outcomes, further investigations were performed using t-tests with Bonferroni adjustments for multiple comparisons when ANCOVA showed significant main effects and interactions. Significance was set at P < 0.05. Statistical analyses were performed using IBM SPSS version 29.0 for Windows (IBM Corp., Armonk, NY, USA).
Comments (0)