Participants and experiment design
One hundred and twenty elderly persons participated in this prospective cohort study. This study was designed to predict functional decline due to aging and establish strategies for functional improvement by longitudinally collecting multimodal data, including physical and cognitive function levels, and brain imaging, from community-dwelling older adults with physical or cognitive impairments. The inclusion criteria for this study were as follows: (1) community-dwelling older adults aged 55 to 84 years and (2) individuals with mild cognitive impairment, defined as a score of 6 or higher on the Korean Dementia Screening Questionnaire-Cognition (KDSQ-C), or those with physical impairment, defined as a score of 9 or lower on the Short Physical Performance Battery (SPPB). The exclusion criteria were as follows: (1) individuals with severe visual field defects, fractures, or brain diseases that prevent independent walking; (2) those with a history of musculoskeletal disorders, such as fractures, that could affect physical function within six months prior to recruitment; (3) individuals with severe cognitive impairment who were unable to understand the study and provide voluntary consent; (4) those with a history of major psychiatric disorders, such as schizophrenia or bipolar disorder; and (5) individuals for whom MRI was contraindicated due to the presence of a pacemaker, claustrophobia, or metallic implants in the skull.
This study’s ethical approval (202306-HR-004) was obtained from the Institutional Review Board (IRB) of Kumoh National Institute of Technology, Gumi, Republic of Korea. This study was registered with the Clinical Research Information Service (CRIS, Korea, https://cris.nih.go.kr; registration number: KCT0008569). Participant recruitment began in September 2023. All participants provided written informed consent prior to their enrollment in the study, and all procedures were conducted in compliance with the approved study protocol.
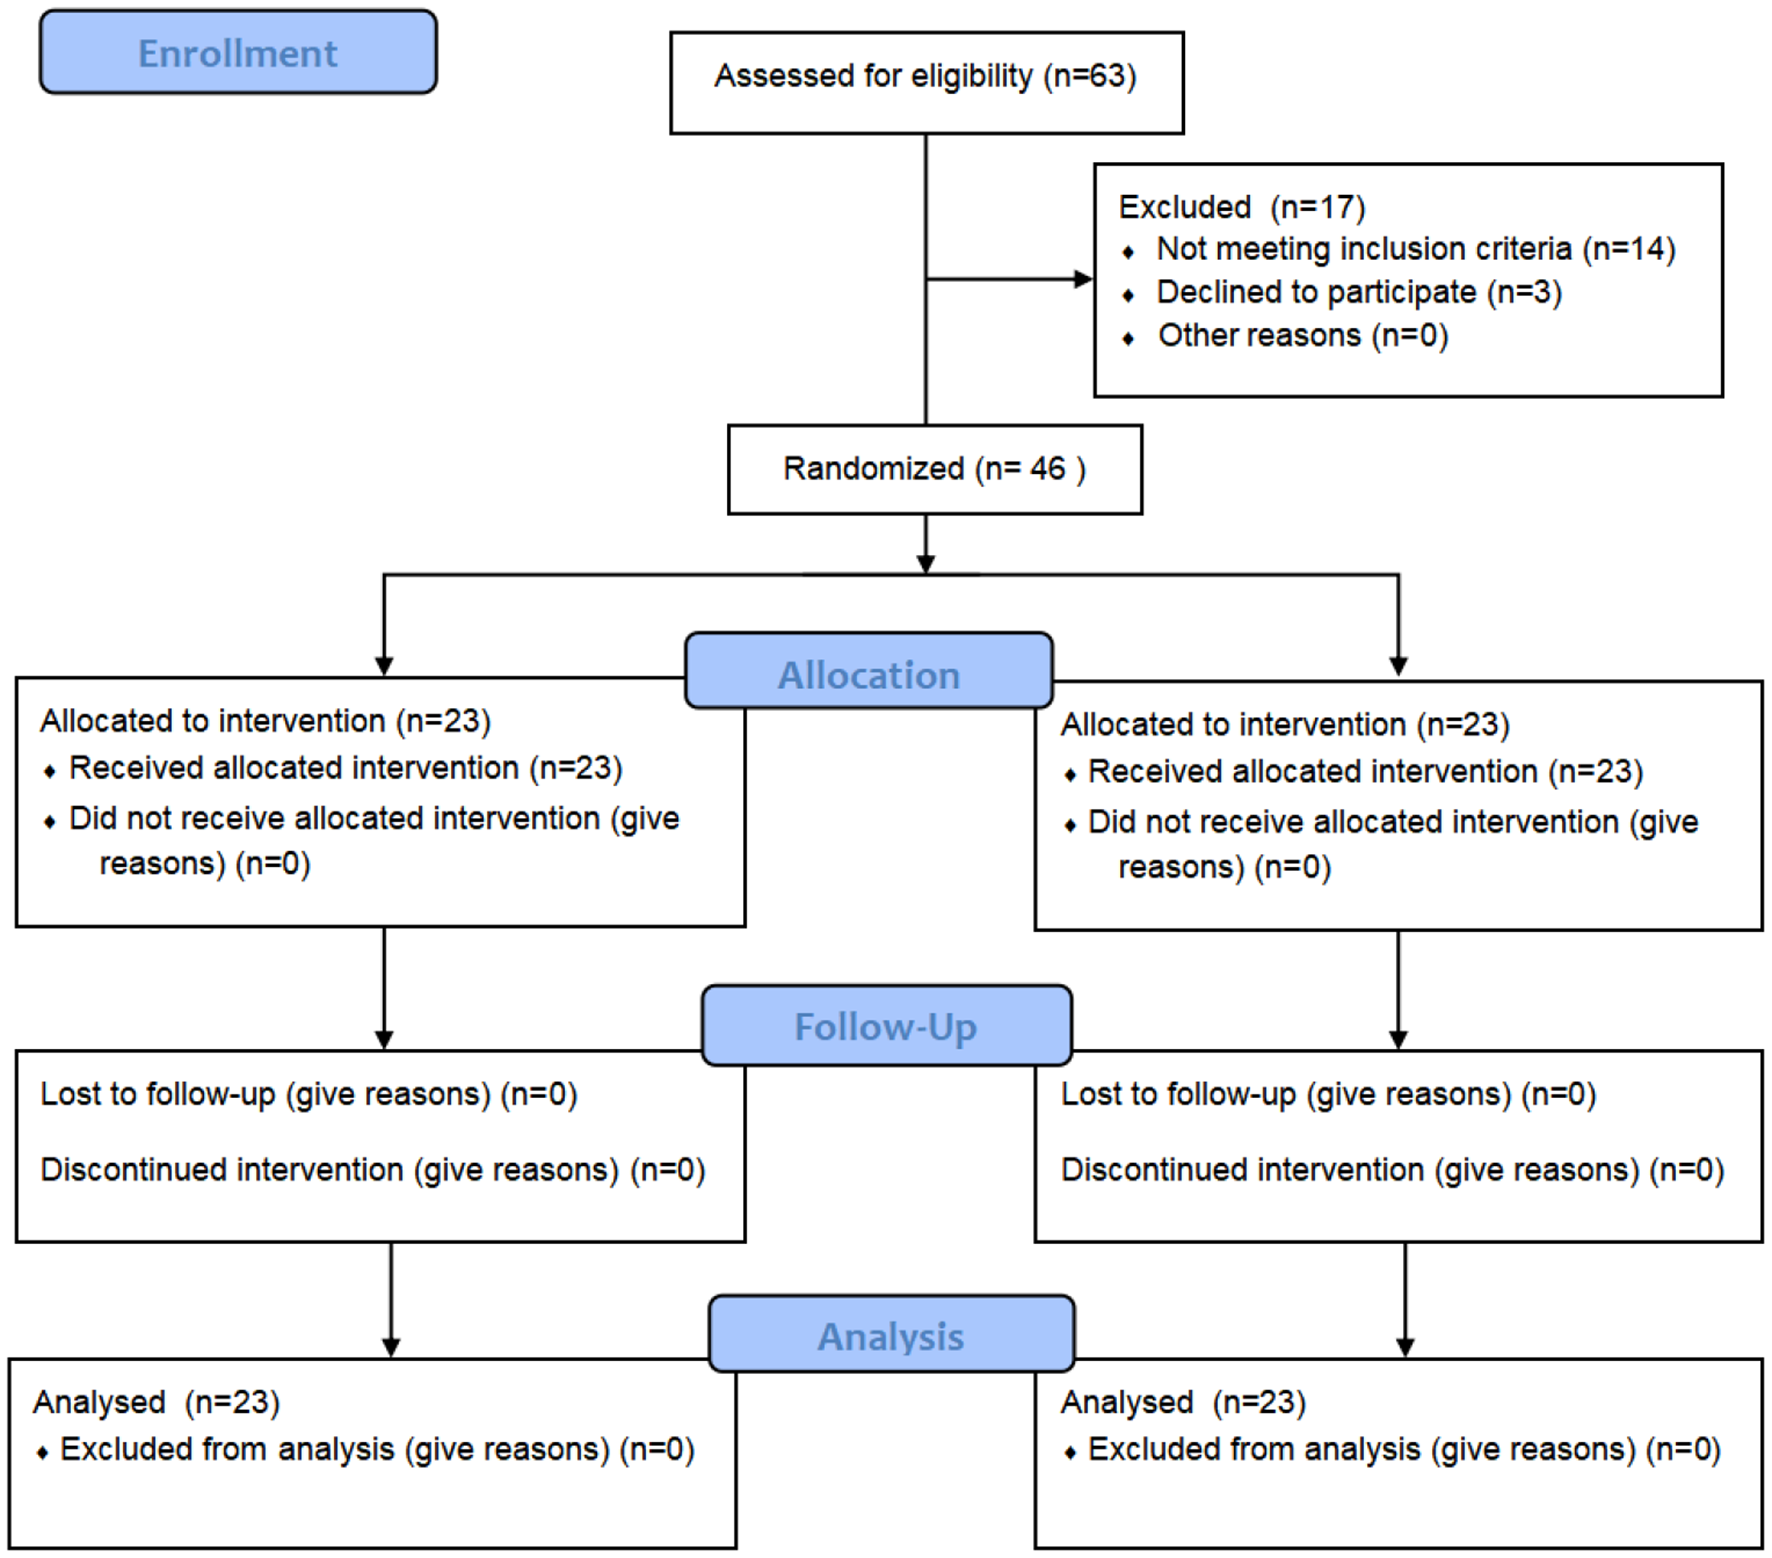
One hundred and six participants’ physical and cognitive function data and DTI data were analyzed for this study. The participants ranged in age from 57 to 84 years (mean age: 72.63 years), and the sample included 40 males and 66 females. In accordance with the purpose of this study, 14 participants were excluded due to a diagnosis of neurological disorders such as stroke, Parkinson’s disease, or unstable conditions during the MRI scanning process. Table 1 shows the baseline characteristics of participants.
Table 1 Baseline characteristics in participantsPhysical and cognitive function assessments
A battery of standardized tests was employed to assess physical function. The 10-Meter Walk Test (10MWT) was conducted at both comfortable and fast walking speeds to evaluate gait speed and walking ability, with shorter completion times indicating better performance [10]. The Timed Up and Go (TUG) Test measured functional mobility by recording the time taken for participants to stand up from a chair, walk 3 m, turn around, walk back, and sit down, with shorter times reflecting better mobility [11]. The Four Square Step Test (FSST) assessed dynamic balance and agility by measuring the time taken to step in four quadrants in a specific sequence, where shorter completion times indicated better balance and coordination [12]. The Six-Minute Walk Test (6MWT) evaluated aerobic endurance and functional exercise capacity by measuring the total distance walked in six minutes, with longer distances indicating better physical endurance [13]. Finally, the Nine-Hole Peg Test (9HPT) assessed fine motor coordination and dexterity of the upper extremities by recording the time taken to place and remove nine pegs from holes, with shorter completion times indicating better manual dexterity [14].
Cognitive function was assessed across various subdomains using standardized tests. For the attention function, the Digit Span Test (DST) Forward and Backward was used. The DST forward assessed attention and short-term memory by requiring participants to repeat a sequence of digits in the same order, while the DST backward evaluated attention and working memory by having participants repeat the sequence in reverse order [15]. To evaluate language function, the Seoul-Korean Boston Naming Test (S-K-BNT) was administered, which involved naming visually presented objects, with a higher number of correct responses indicating better language function [16]. Additionally, a Repetition Task was used to assess verbal fluency and language processing by asking participants to repeat a series of sentences [17]. The visuospatial function was assessed using the Rey Complex Figure Test (RCFT), where participants were required to copy and later recall a complex figure from memory [18]. For the assessment of memory function, the Seoul Verbal Learning Test - E (SVLT-E) was used, which measured participants’ ability to learn and recall a list of words after multiple trials [19]. Lastly, the executive function was assessed using several tasks, including the Go-No-Go Task to measure inhibitory control and impulsivity [20], the Digit Symbol Coding (DSC) task to evaluate processing speed and working memory capacity [15], and the Controlled Oral Word Association Test (COWAT) to assess verbal fluency by asking participants to generate as many words as possible beginning with a specific letter in one minute [21]. The Korean Trail Making Test– E (K-TMT-E) was used to evaluate cognitive flexibility and executive function, with participants connecting a series of numbers and letters alternately [22], and the Korean Color Word Stroop Test (K-CWST) was used to assess cognitive inhibition and processing speed by asking participants to name the color of words that were either congruent or incongruent with the meaning of the word [23].
Diffusion tensor imaging data acquisition and processing
DTI data were acquired using a Siemens MAGNETOM Skyra 3T MR scanner (Siemens Healthcare, Erlangen, Germany) of the K-MEDI hub. The DTI data were acquired with the following settings: b = 1000 s/mm2, 64 non-colinear gradient directions, 80 axial slices, slice thickness = 2 mm (no gap), matrix size = 232 × 232, repetition time = 9600 ms, echo time = 82 ms, and field of view = 230 × 230 mm.
To extract the status of major neural pathways throughout the brain, DTI data were preprocessed using FMRIB’s Diffusion Toolbox (FDT) from the FSL software package (version 6.0.7.9, FMRIB Software Library, FMRIB, Oxford, UK, http://www.fmrib.ox.ac.uk/fsl). Corrections for eddy currents, head motion, and skull stripping were applied. The DTIfit algorithm, commonly used to quantify white matter integrity, was employed to fit a tensor model and reconstruct maps of FA and MD. AD and RD maps were generated by calculating the eigenvalues of the diffusion tensor. FA maps were spatially normalized by registering individual FA maps to the Montreal Neurological Institute (MNI) standard space (FMRIB58_FA standard space image) using nonlinear registration algorithms from the Tract-Based Spatial Statistics (TBSS) technique. Additionally, MD, AD, and RD maps were warped to the standard space using the registration information from the native FA map to the standard FA map.
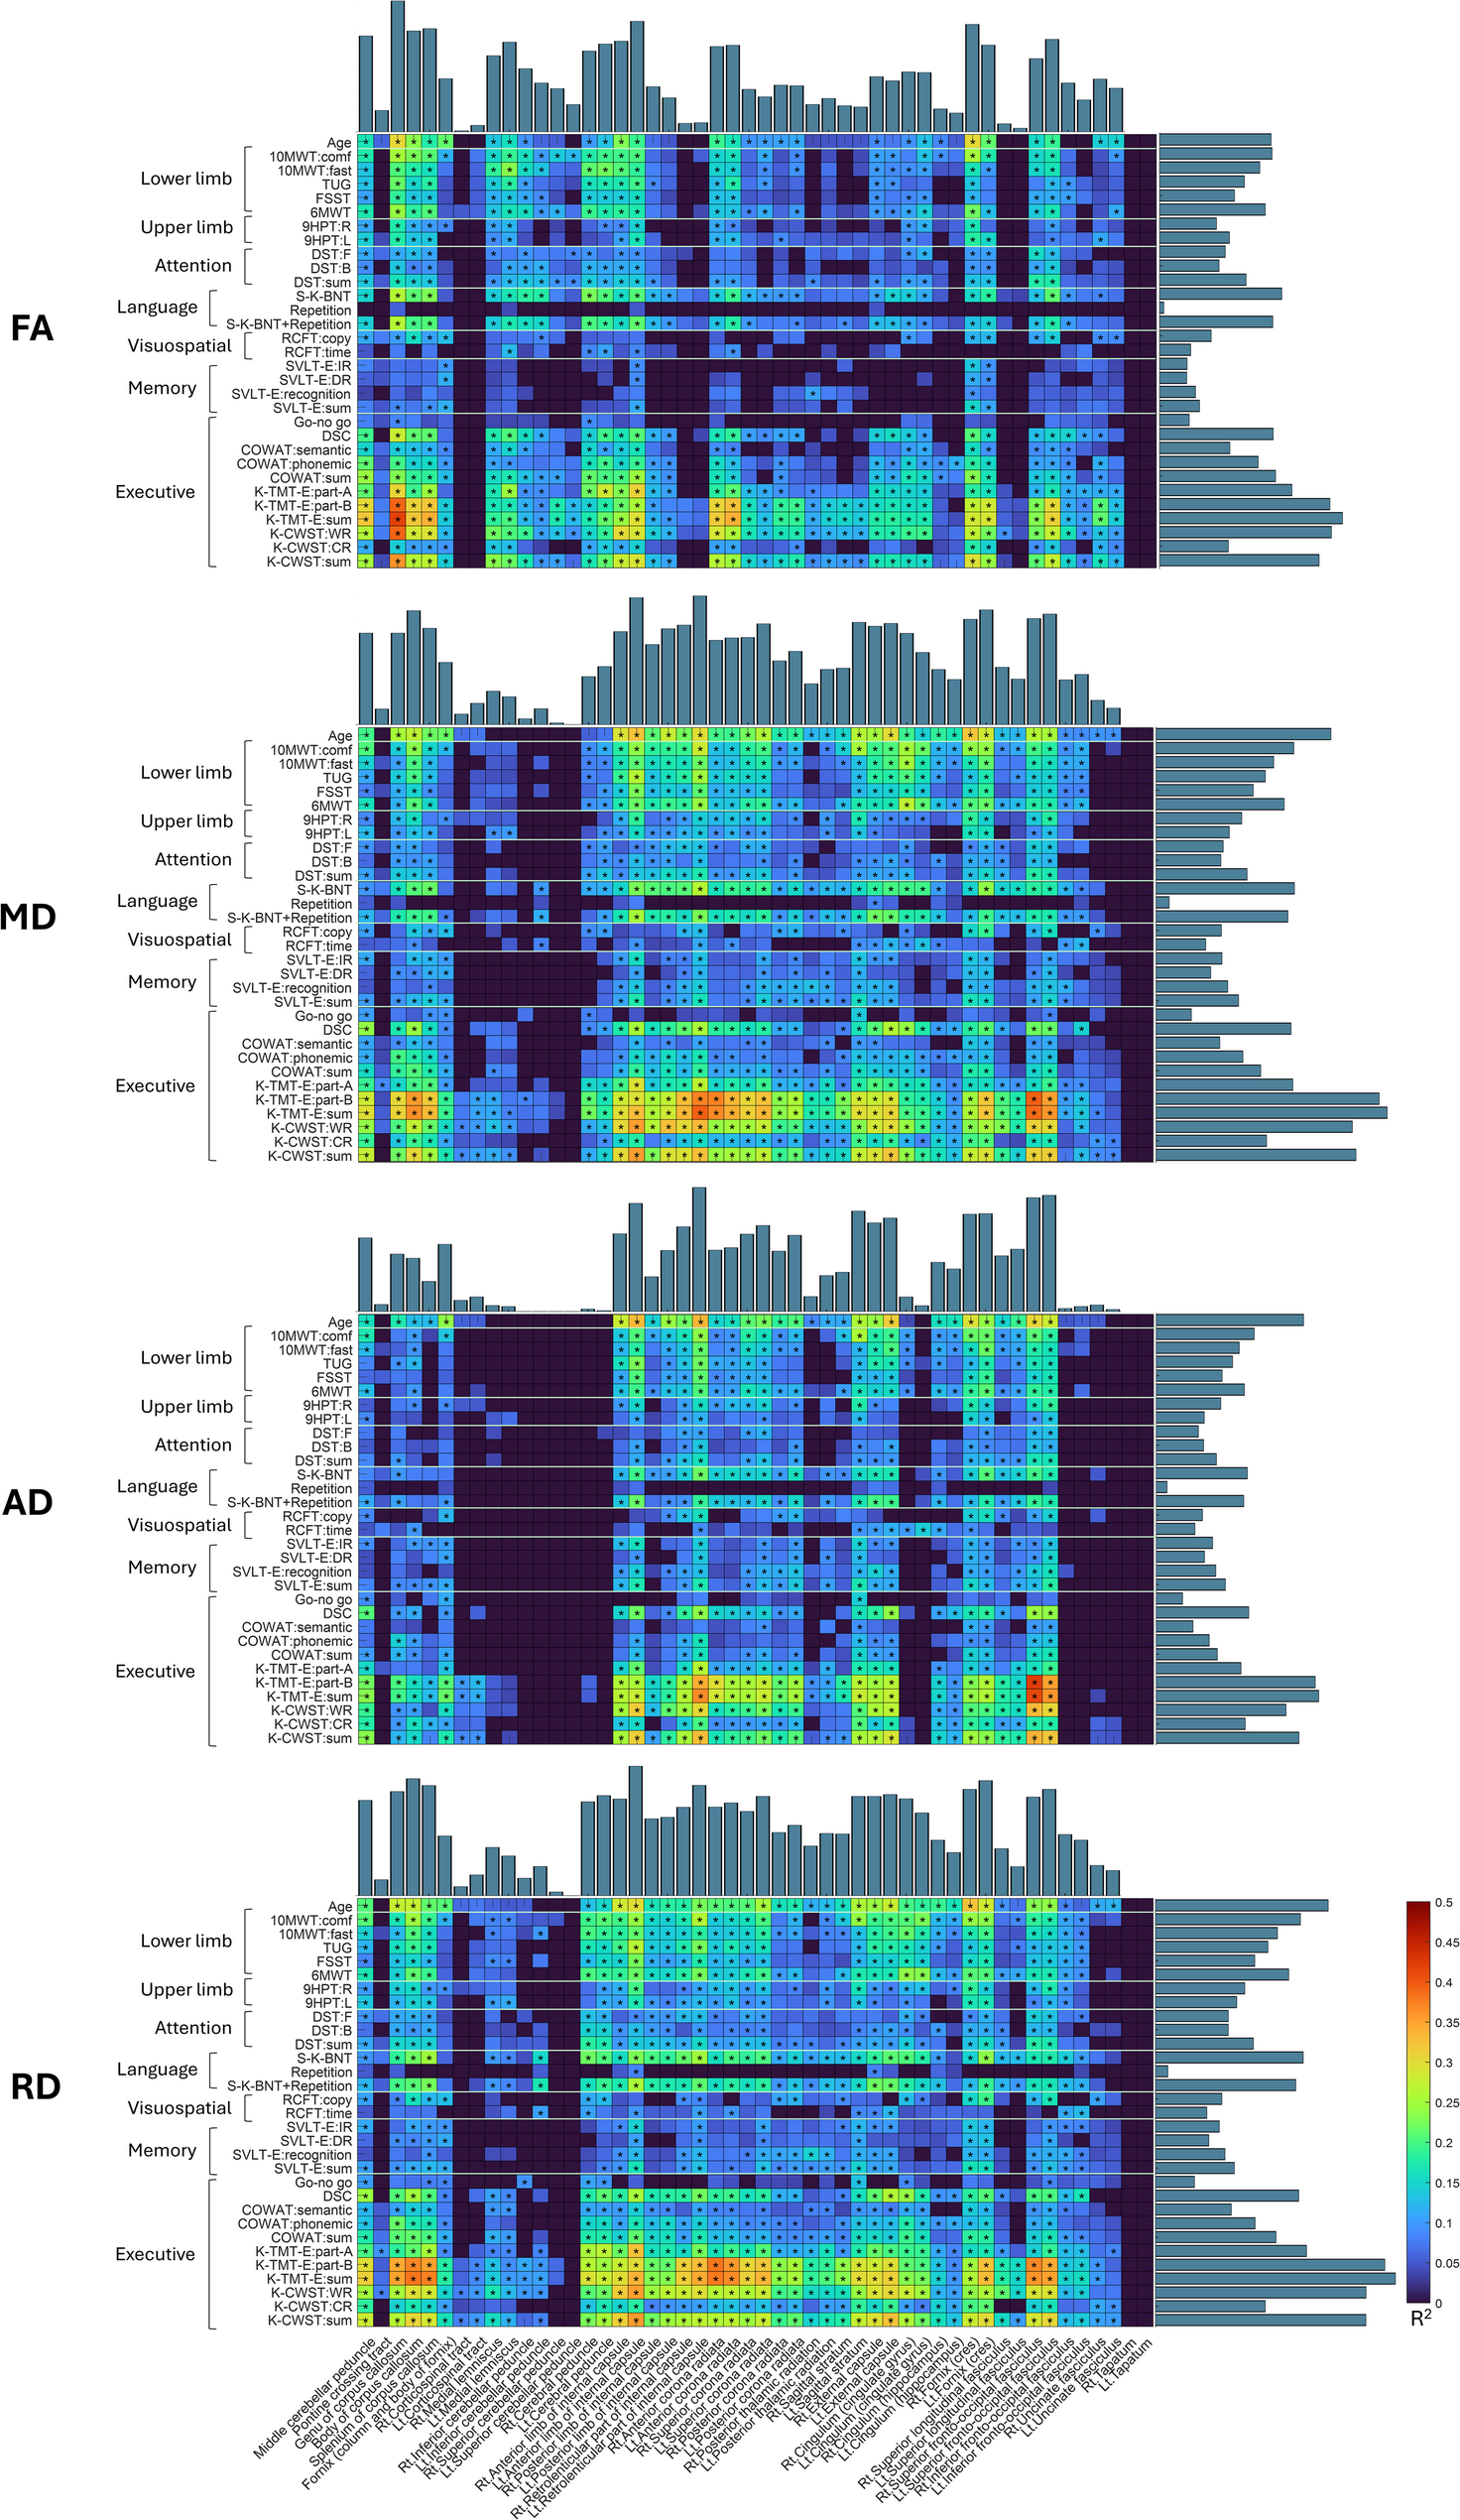
The 50 tracts derived from the Johns Hopkins University White Matter Atlas (JHU ICBM-DTI-81) [24] were utilized to assess the status of major neural pathway. All tracts were binarized and masked onto the spatially normalized FA, MD, AD, and RD maps. The FA, MD, AD, and RD values were calculated by averaging within the regions corresponding to the 50 tracts.
Statistical analysis
In this study, linear regression was employed to examine the strength of association between neuroimaging metrics (FA, MD, AD, and RD) and physical and cognitive functions, with the coefficient of determination (R²) used to quantify effect size. Additionally, to incorporate all four neuroimaging metrics, principal component analysis (PCA) was applied, and linear regression assessed the association of each function with the principal components. “PCA1” represents the model using only the first principal component, whereas “PCA2” includes both the first and second principal components. To account for multiple comparisons, the false discovery rate (FDR) correction was applied with a threshold of q < 0.05. Finally, multiple linear regression was then conducted to develop predictive models, incorporating age, sex, and educational level as covariates alongside neuroimaging metrics. Neuroimaging metrics were used to select between one and five tracts in order of their strength of association for each function, with the models designated as “Model 1” through “Model 5” based on the number of tracts included. In this selection process based on the strength of association, the “without covariance” condition measured the coefficient of determination using only neuroimaging metrics as variables, while the “with covariance” condition included age, sex, and educational level as covariates when measuring the coefficient of determination of the neuroimaging metrics. To validate the models, 10-fold cross-validation was performed.


Comments (0)