
Remember me
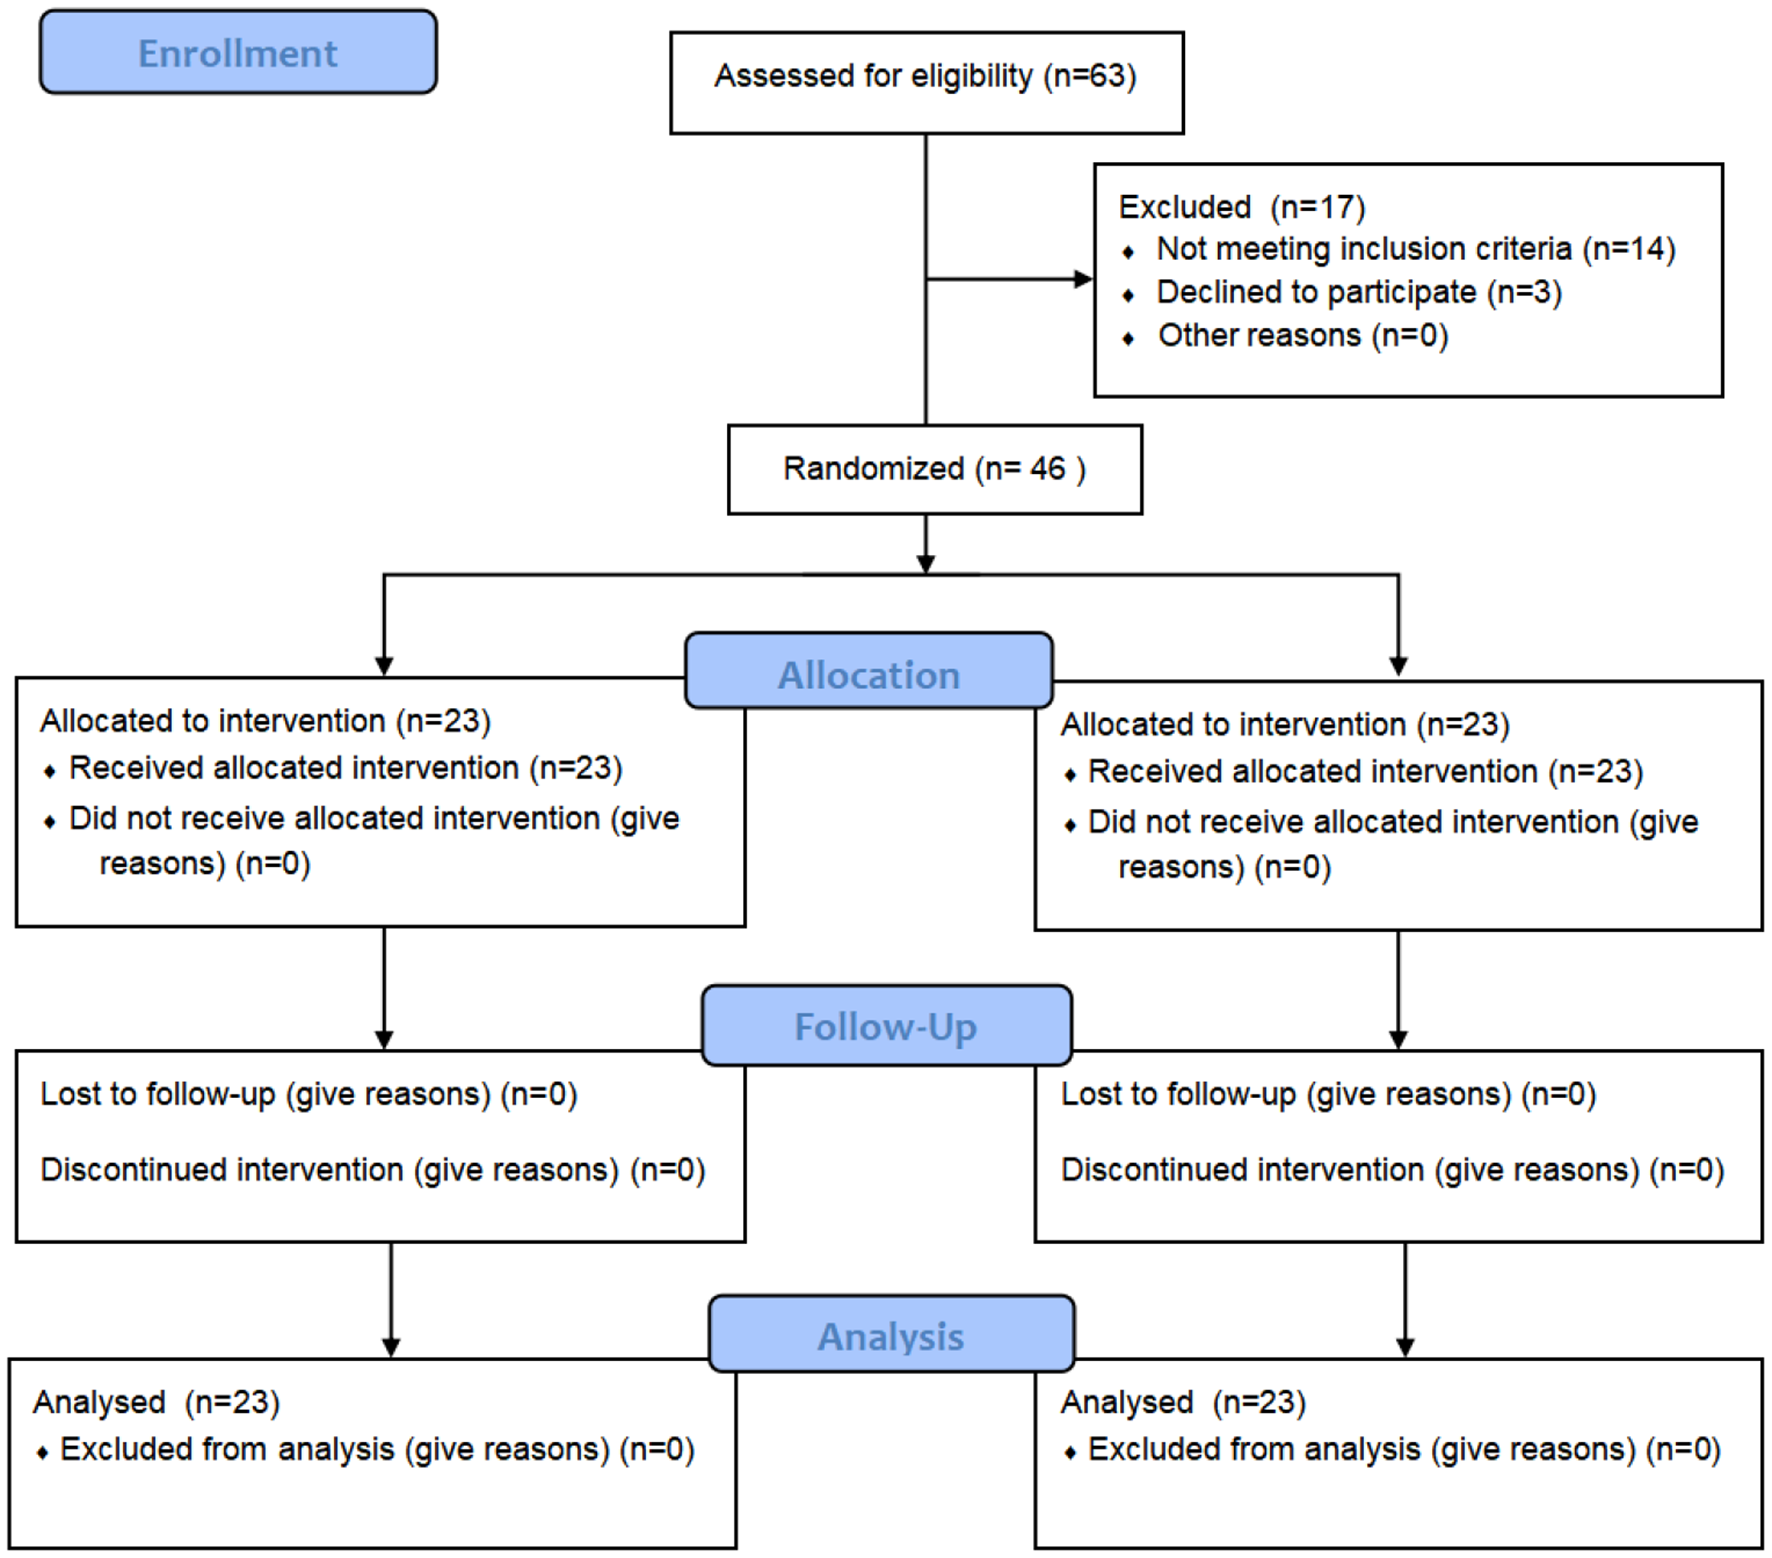
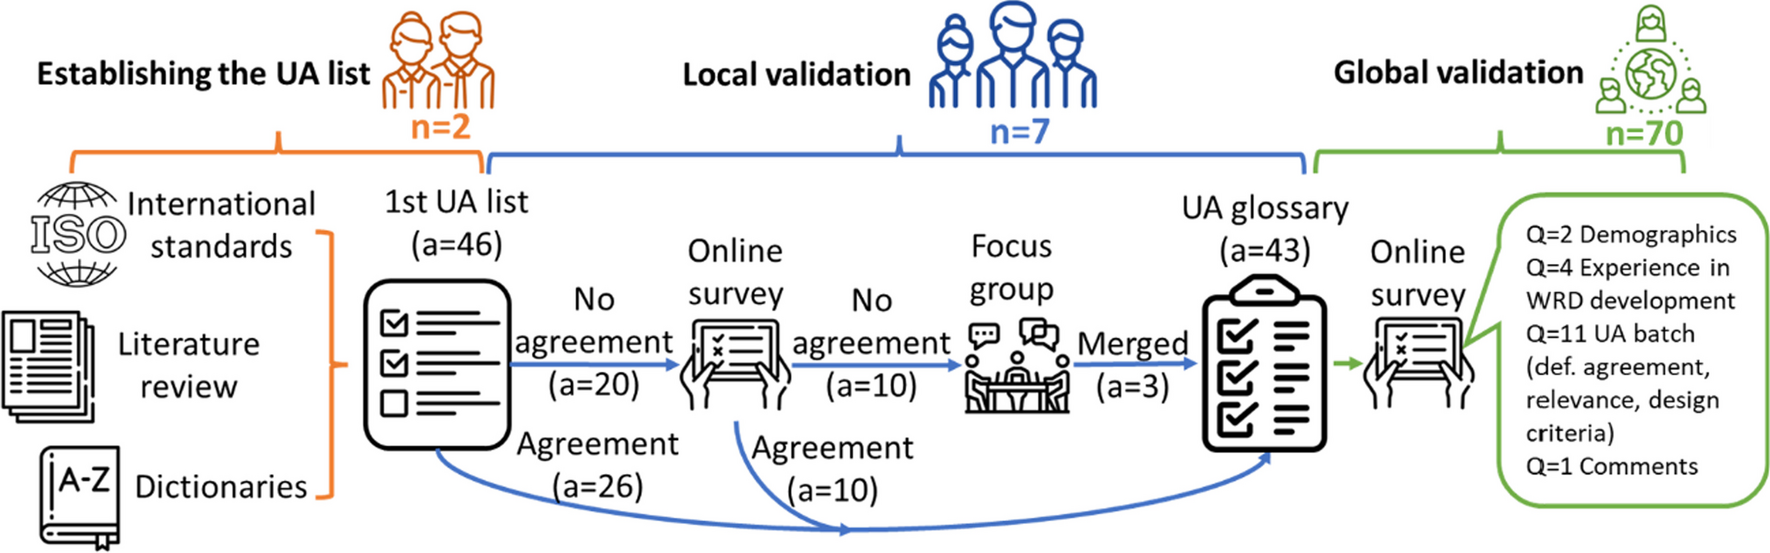

A total of 46 patients were randomly assigned to the control or Kickstart group, with 23 patients in each group. Both groups received 4 weeks of rehabilitation therapy intervention, and relevant indicators were assessed at baseline and at 2, 4, and 8 weeks after treatment. The treatment of the patients was carried out by two therapists who had been working for more than 5 years. Before the assessment, the senior therapist trained the assessing therapists to standardize the assessment indicators, criteria, and procedures. The flow chart is shown in Fig. 1.
Fig. 1
A total of 46 stroke patients treated at Wuxi Central Rehabilitation Hospital from March 2022 to December 2023 were recruited. Table 1 shows the baseline characteristics of the patients. The inclusion criteria were as follows: met the diagnostic guidelines for stroke in the 2019 Chinese Classification of Cerebrovascular Diseases [19] and confirmed by cranial CT or MRI; first-ever onset of the disease, aged 35–75 years; duration of the disease between 1 and 6 months, unilateral hemiparesis; modified Ashworth scale (MAS) score ≤ 2 for the major muscle groups of the lower limbs; ability to walk independently or with assistance for > 10 m; range of motion of each lower limb joint on the affected side was basically normal or did not affect walking; no other factors affecting walking; Mini-Mental State Examination (MMSE) [20] score > 17; and informed consent. The exclusion criteria were as follows: unilateral neglect; poor general condition unsuitable for gait training; New York Heart Association (NYHA) functional classification ≥ III [21]; history of traumatic injury with unstable fracture; knee or hip flexion contracture > 15 degrees; multiple epilepsy; and participation in other experiments. The withdrawal criteria were as follows: in the opinion of the investigator, they needed to be withdrawn from the study; they had serious adverse events, developed serious complications, etc.; health might have been compromised by continuing the study; and the subjects were asked to withdraw. There was no statistically significant difference in the baseline demographic data between the two patient groups, as shown in Table 1.
Table 1 Basic information of patients in the two groupsInterventionsBoth groups received conventional rehabilitation therapy, including specific physical, exercise, occupational, and traditional therapies. Exercise therapy consisted mainly of strength training of the lower limb and trunk muscle groups, passive stretching, and sit-to-stand transfer training. Each therapy session lasted 40 min and was conducted once daily, 5 days per week, over 4 weeks.
In the control group, gait exercise training, including one-legged standing training, step training, toe clearance training, lateral step training, walking training, and stair climbing training, was conducted 5 days a week for 20 min per session for 4 weeks.
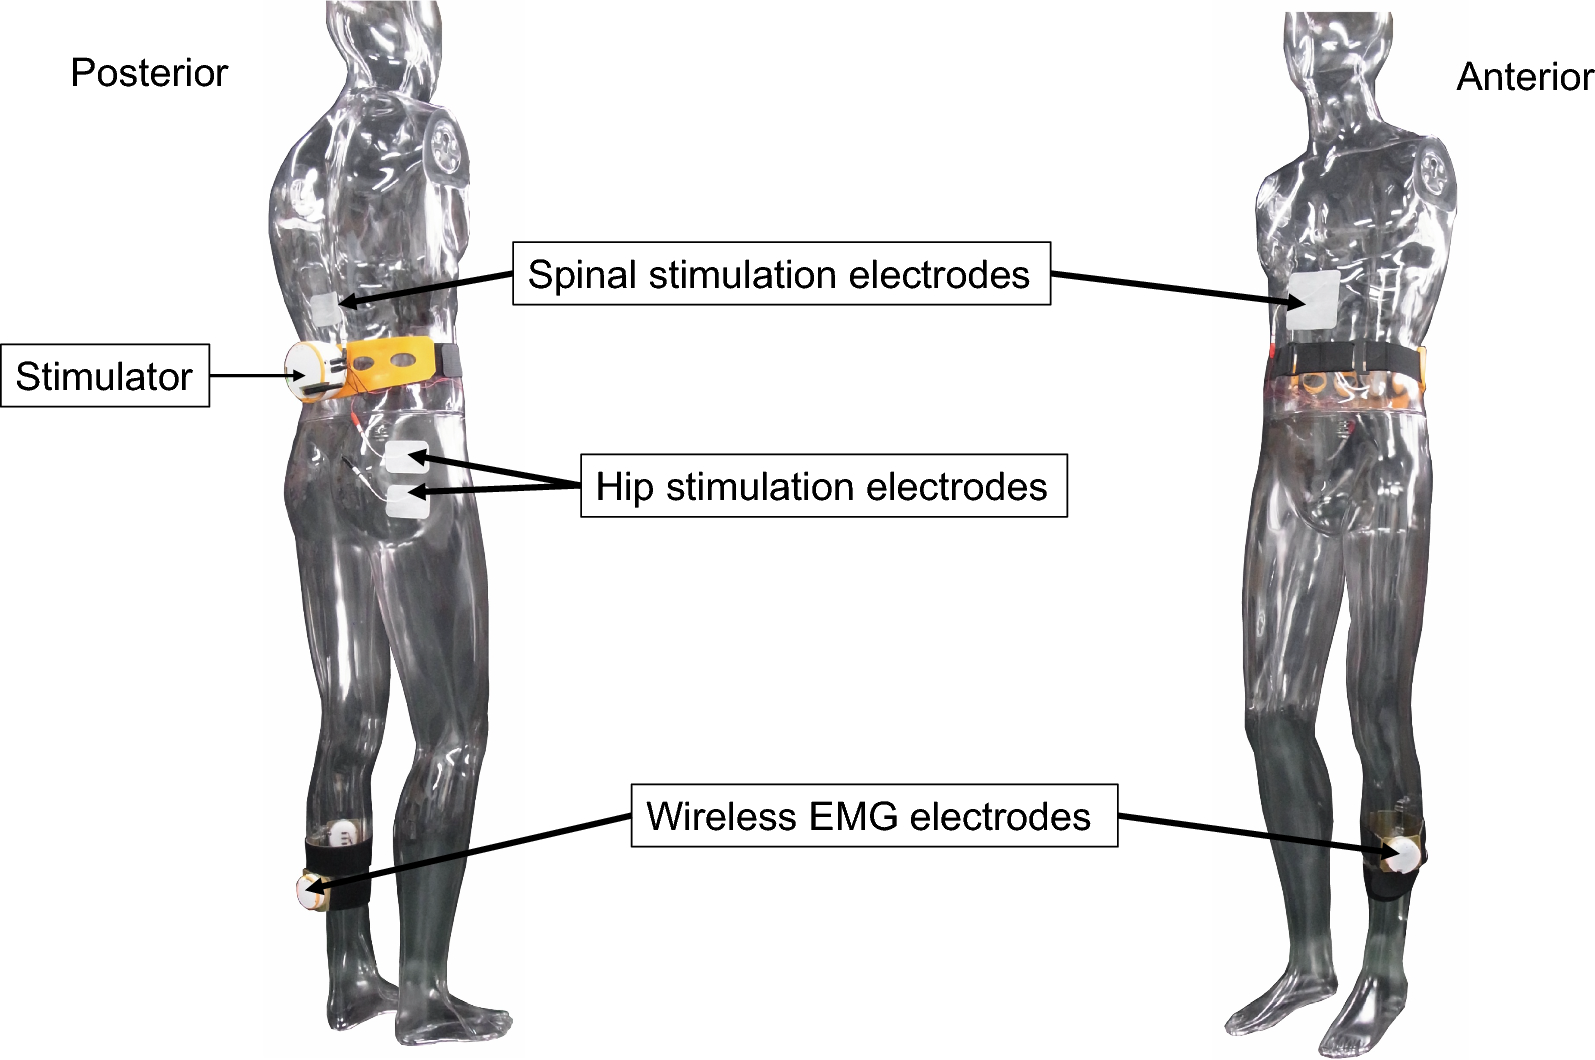
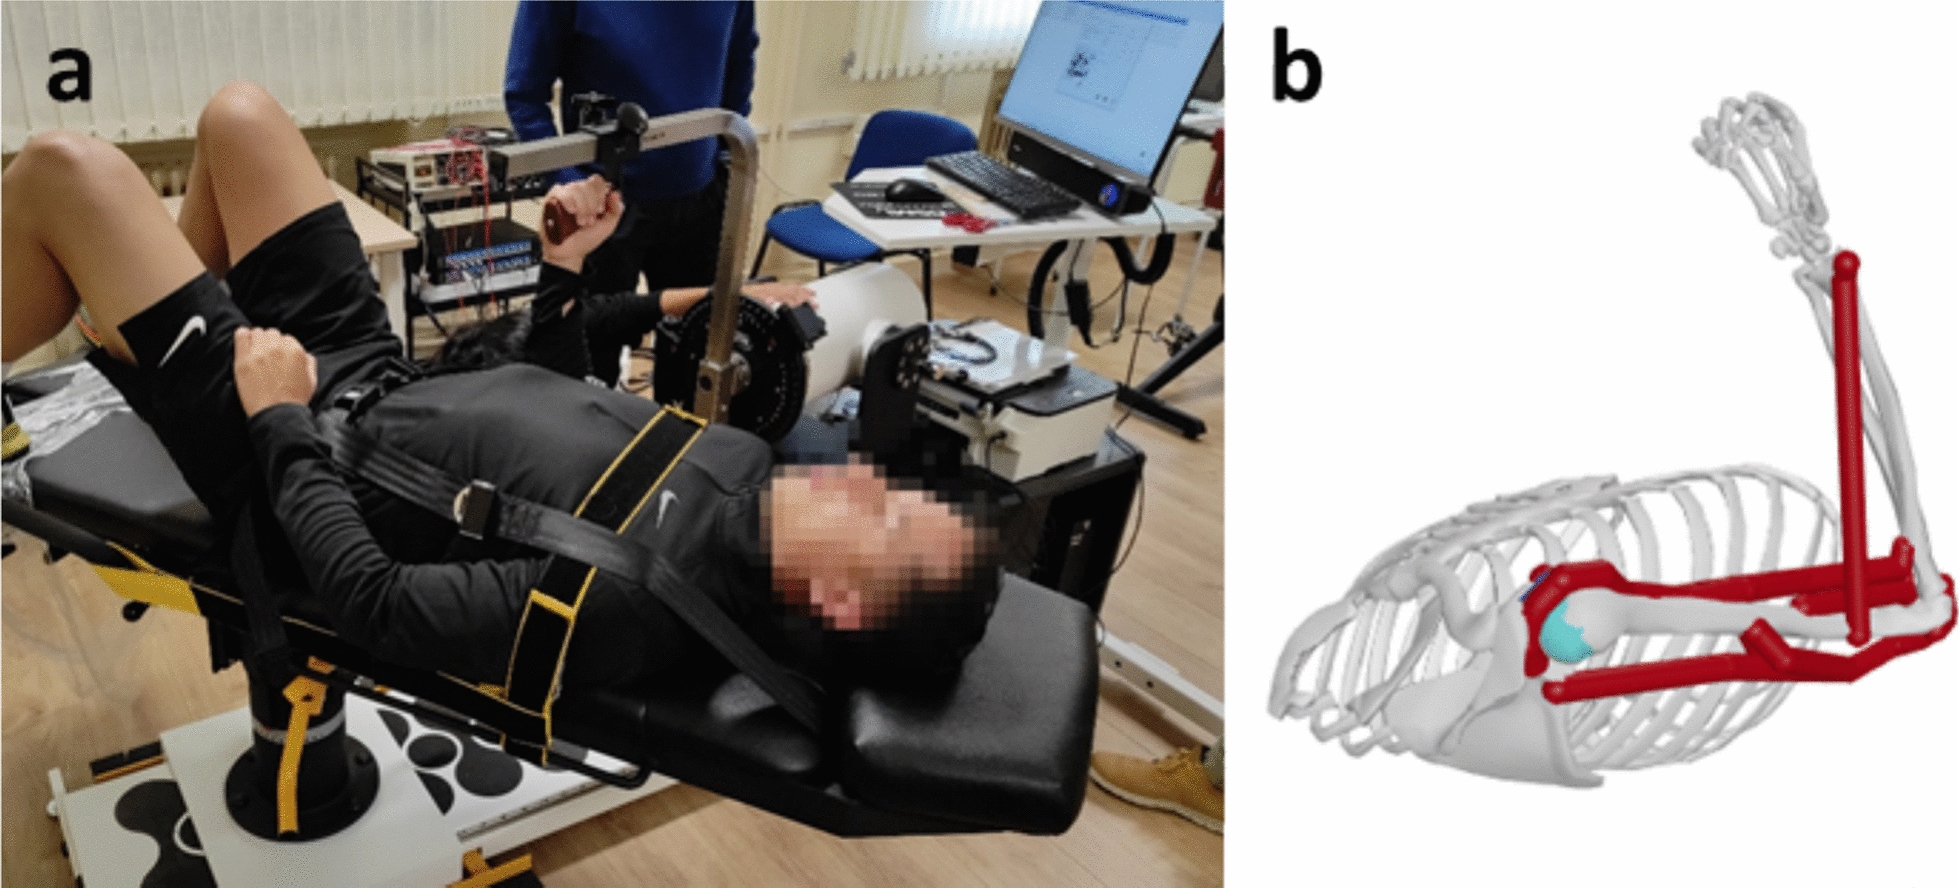
In the Kickstart group, following routine physiotherapy and rehabilitation, patients in the Kickstart group underwent gait training via the Kickstart® Walk Assist system (Real Star Rehabilitation, Shanghai, China). The Kickstart® Walk assist system is a rehabilitation device consisting of a belt, an external support structure, and an Exotendon (Figs. 2 and 3). The effect of the Exotendon is similar to that of an artificial tendon, which stores energy during the stance phase and releases it during the swing phase of the gait cycle. The exotendon mechanism is inspired by the anatomy of horses’ hind limbs, where long tendons spanning multiple joints store energy during the stance phase. This stored energy is released during the swing phase, reducing the muscle exertion required for movement. The universal hip joint is designed to allow complex movement patterns of the pelvis and hip joints. The knee joint is designed to prevent hyperextension of the knee, and the ankle joint has a built-in ankle‒foot orthosis to help correct foot drop and foot inversion. The patient wore the Kickstart lower extremity exoskeleton for supervised gait training. The Exotendon of the exoskeleton’s tendons is adjusted through a tendon tension adjuster, allowing the patient to fully lift the lower limb off the ground and complete the step motion. Each session lasted 20 min once a day, 5 days a week for 4 weeks (Figs. 2 and 3).
Fig. 2
Kickstart® Walk assist system
Fig. 3
Patient wearing Kickstart
Outcome measuresParticipants were assessed at baseline (before randomization), at the 2-week and 4-week time points during the intervention, and at the 8-week follow-up, all by a blinded assessor. During testing, necessary assistance was provided based on the patient’s functional status. Assistance was administered by a single therapist positioned on the affected side of the patient, strictly limited to light touch contact (minimal fingertip contact for balance cueing) and guard contact (hand placement near torso/hips for fall prevention without weight-bearing support). Therapists were explicitly instructed to neither actively push patients nor provide forward propulsion assistance. The assistance method was kept consistent for each patient throughout the study to ensure intervention fidelity. During all gait assessments, walking aids (including canes and orthoses) were strictly prohibited, and critically, the Kickstart system was not worn during post-intervention evaluations.
Primary outcomeThe primary outcome was motor function measured with the lower extremity Fugl-Meyer Motor Function Assessment Scale as the main index, as it has good predictability, credibility, and sensitivity for the recovery of lower limb motor function in stroke patients [22]. Higher scores on this 17-item scale, where each item is scored from 0 to 2 for 34 points, indicate better lower limb function.
Secondary outcomesThe secondary outcomes include gait indicators (gait speed, stride length, temporal symmetry ratio (TSR)), the 10-meter walk test, the Borg Subjective Fatigue Scale and surface electromyography (iEMG), and the root mean square (RMS) of the biceps femoris, rectus femoris, iliopsoas and gluteus maximus muscles.
The TSR analyzes the temporal distribution of swing and stance phases during gait, serving as a metric for gait symmetry assessment [23]. The TSR was calculated as follows: TSR = (paretic swing time/stance time)/(nonparetic swing time/stance time).
The 10-meter walk test is reliable for gait testing in stroke patients [24]. A 10-meter track was measured and marked on the floor with 2 m at each end to facilitate acceleration and deceleration. Patients were instructed to walk as quickly and safely as possible, and the time taken to walk 10 m was recorded. The measurements were repeated 3 times, and the results were averaged.
The gait data were collected via the Gait and Balance Function Training and Assessment System (AL-600). Patients walked barefoot and were allowed to practice on the test bed for 2 min to become familiar with it before the test. They were instructed to walk naturally, look straight ahead, with a therapist on each side to prevent falls. The measurements were repeated three times and averaged (Fig. 4).
Fig. 4
AL-600 gait analysis system
Fig. 5
The Borg Rating Scale of Perceived Exertion is a valid measurement tool for determining exercise intensity [25] and correlates well with heart rate and other physiological indicators. The scale ranges from 6 to 20 points, with higher scores indicating greater perceived fatigue. A score above 13 generally correlates with significant respiratory and fatigued symptoms, whereas a score above 17 suggests that exercise cessation may be needed [26].
Surface electromyography was performed using a BTS FREEEMG 300 (BTS Bioengineering, Milan, Italy). Before testing, the test site was fully exposed, the hair was removed, and the area was cleaned with 75% alcohol to optimize sensitivity. The two electrodes were placed 2 cm apart and attached to the muscle belly along the path of the muscle fibers. The patient was instructed to perform a maximal isometric contraction and hold it for 7 s. The measurement was repeated three times. The specific locations of the electrodes were as follows (Fig. 5): rectus femoris (a): midpoint between the ilium and the knee joint; biceps femoris (b): lateral to the midline of the posterior thigh, from the gluteal groove to the midpoint of the knee joint; iliopsoas (c): medial to the anterior superior iliac spine; and gluteus maximus (d): midpoint between the greater trochanter of the femur and the sacral vertebrae. The surface EMG data were automatically processed via BTS EMG analysis software. The surface electromyography data were automatically processed via BTS EMG analysis software. The calculation of iEMG involves several steps: First, EMG signals are recorded from the muscles of interest using surface electrodes. These signals are then filtered to remove noise and artifacts, typically using a band-pass filter to isolate the relevant frequency components. Next, the filtered EMG signal is rectified to convert all negative values to positive values, ensuring that the signal represents the total muscle activity. Finally, the rectified EMG signal is integrated over a specific time interval, either by numerical integration or by summing the absolute values of the signal.
Sample size calculationSample size calculations were conducted via Cohen’s method [27]; this study used G*Power software to estimate the sample size, the effect size was 0.25, the test criterion α was 0.05, the test power (1-β) was 0.95, the number of groups was 2, the number of repetitions was 4, the corr between rep measures was 0.5, and the nonsphericity correction was 1. The sample size was calculated to be 36 cases, considering the 20% attrition rate, and the final sample included 46 cases.
Randomization and blindingBlock randomization was performed via a computer-generated random sequence with random block sizes of 4–6. A total of 46 patients were randomly assigned to the control and Kickstart groups, with 23 patients in each group. Forty-six sealed envelopes, each labeled with a subject number, contained group assignments (Kickstart or control groups). A research team member who was not involved in treatment or evaluation safeguarded the envelopes to prevent premature opening. Once a subject met the inclusion criteria and consented to join the study, their numbered envelope was opened, and they were assigned to the intervention group indicated inside.
This study employed a single-blind design; the patients were assessed by two other therapists who were unaware of the grouping of the patients. During the assessment, the patient’s personal information (such as name and medical record number) was replaced with anonymous codes to reduce the evaluator’s recognition of the patient’s identity, thereby reducing potential bias.
Statistical analysisAll the statistical analyses were performed with SPSS version 21.0 (IBM, Armonk, NY, USA). Data that followed a normal distribution were described via the mean ± standard deviation (x ± SD), and for pre- and postmeasurement data, repeated-measures ANOVA was used with a prior sphericity test. If the sphericity test was not passed, the main effect and interaction effect of group and time were analyzed via Greenhouse correction, and then one-way repeated-measures ANOVA and paired samples tests were used to analyze the main effect and interaction effect of group and simple effects of time were analyzed via one-way repeated-measures ANOVA and paired samples test. Measures that did not follow a normal distribution were described by medians (quartiles); analyses were performed via generalized estimating equations for the main effects of group, time, and interaction effects; and later analyses were performed via Friedman’s test and the signed rank test for simple effects of group and time. The number of cases (proportions) determined via the chi-square test statistically described all the count data. p < 0.05 was considered a statistically significant difference.
Comments (0)