
Remember me

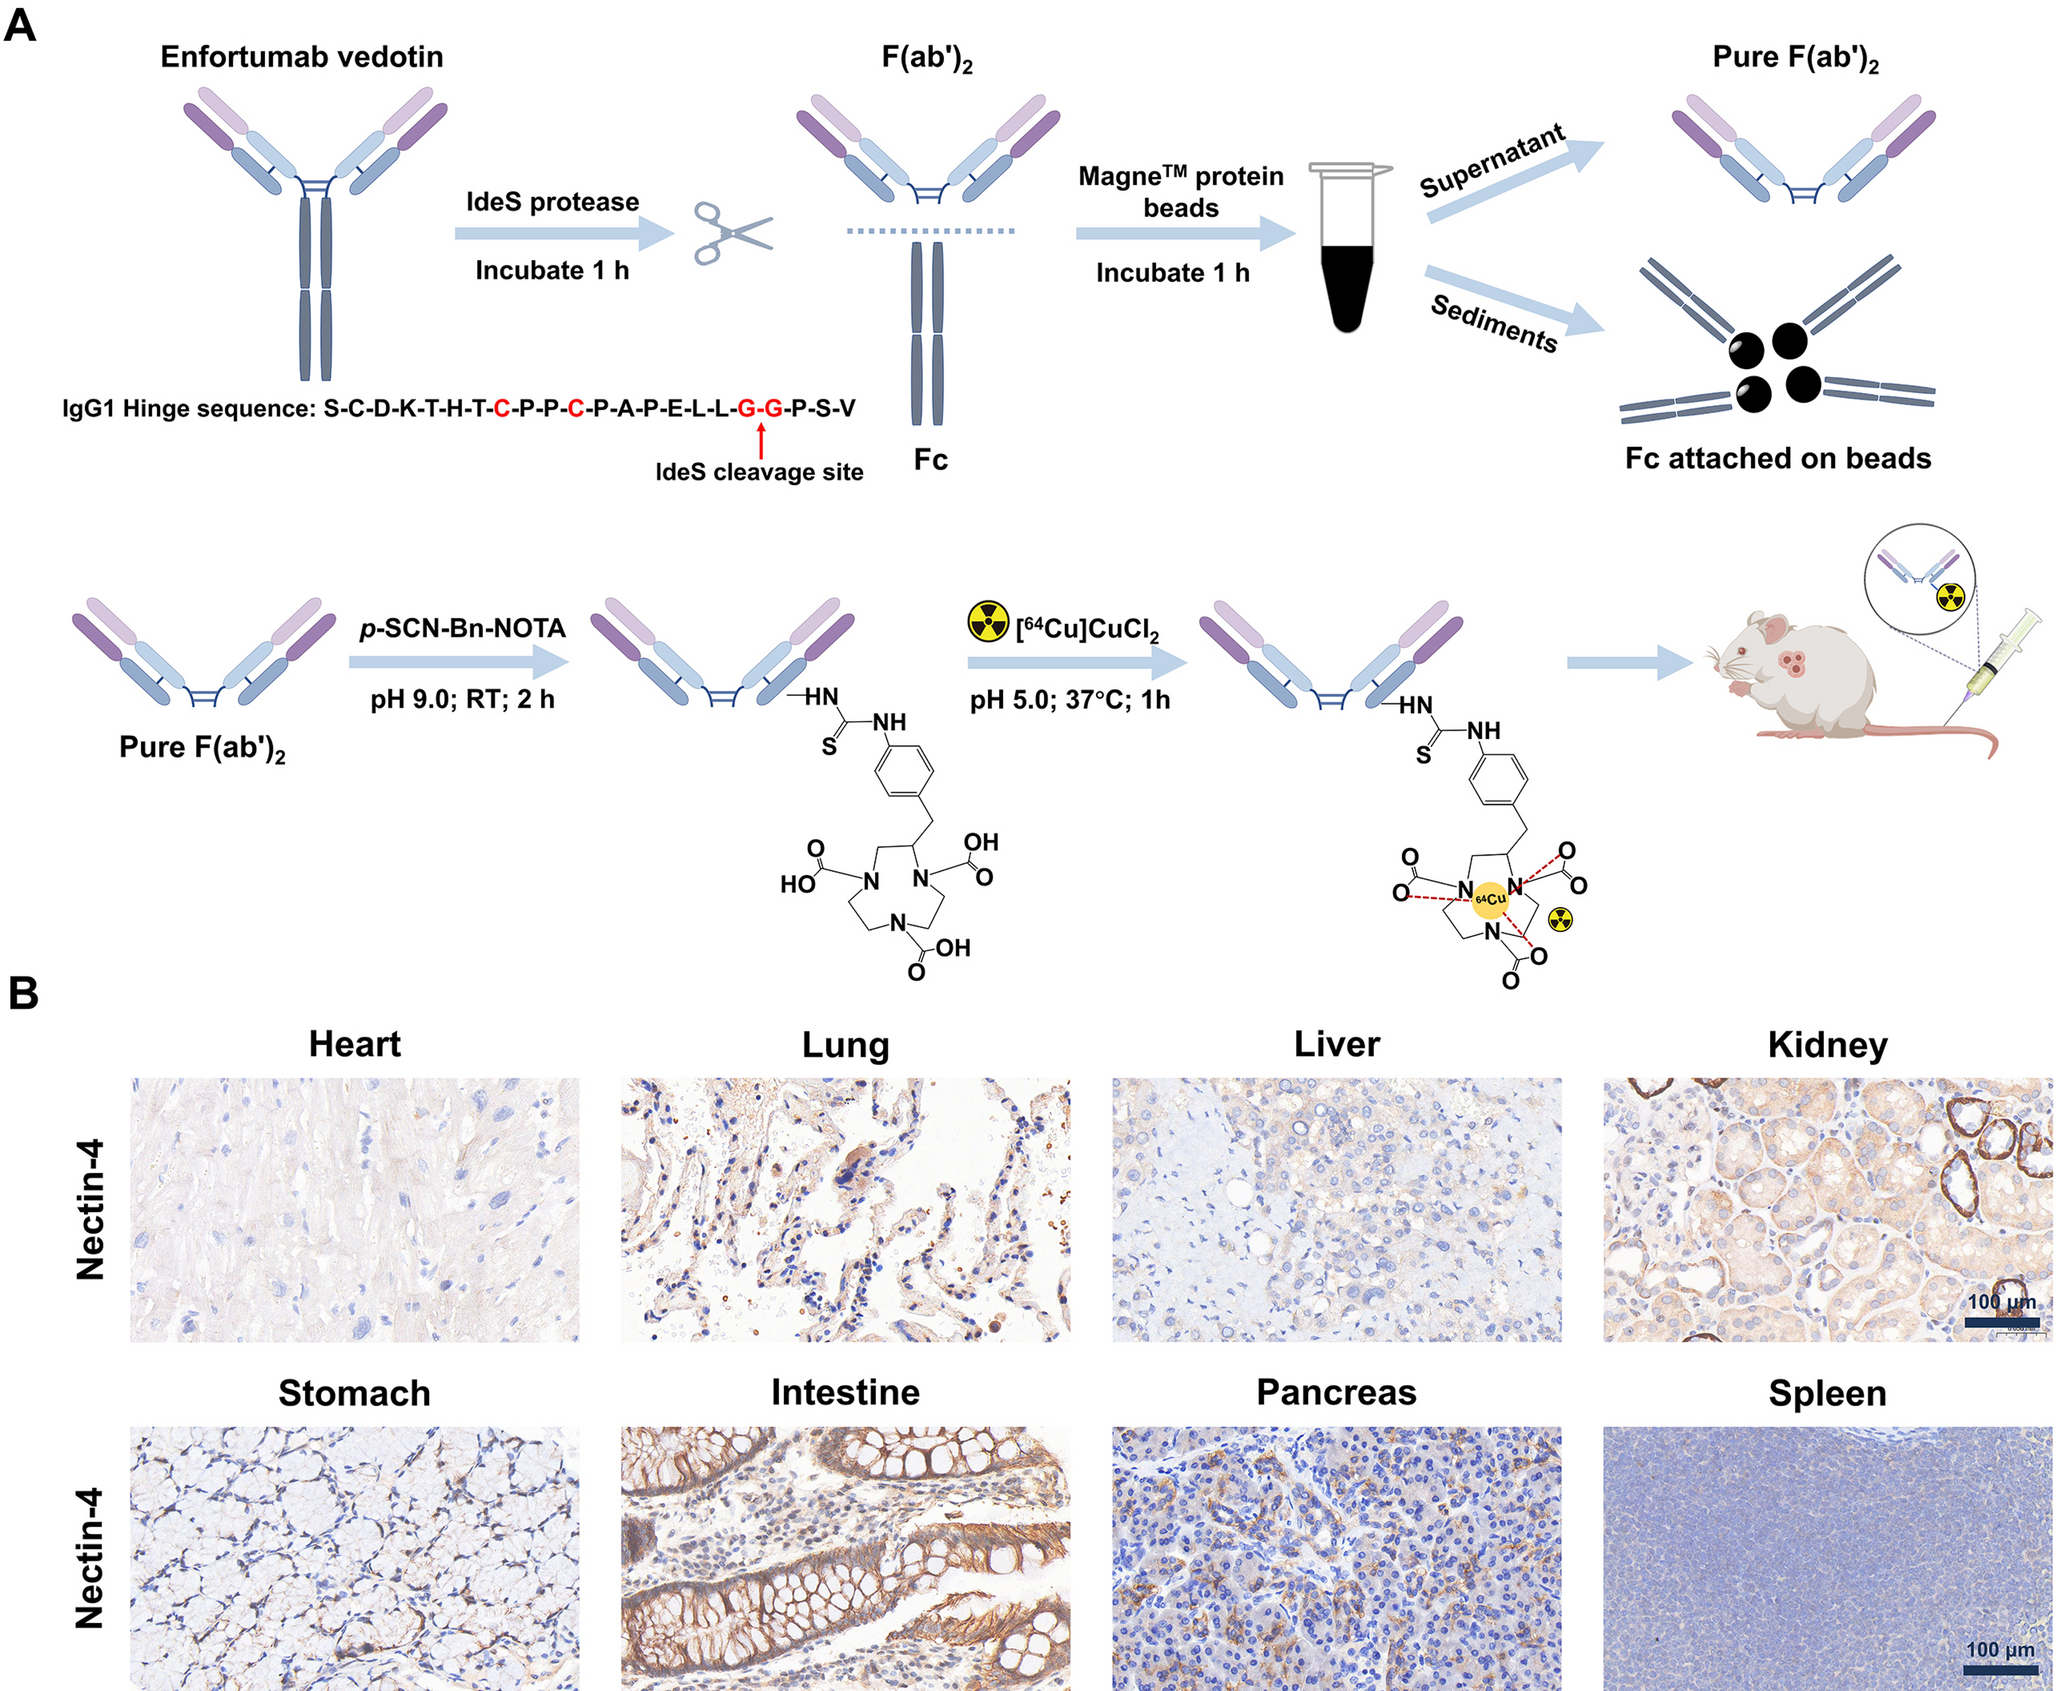
As shown in Fig. 1A, EV was enzymatically digested using IdeS protease to generate the expected EV-F(ab’)2 fragments. These fragments were then purified using Magne™ Protein A beads and MagneHis™ Ni particles to effectively remove the Fc portion. Following purification, the EV-F(ab’)2 fragments were conjugated with p-SCN-Bn-NOTA at pH 9.0 and room temperature for 2 h. These mild reaction conditions preserved the integrity of their antigen-binding domains. Subsequent radiolabeling with 64CuCl2 at pH 5.0 and 37 °C for 1 h resulted in a high radiochemical yield (85.40 ± 2.43, n = 5), as verified by radio-ITLC (Figure S1, supporting information). The radiochemical purity exceeded 99% immediately after purification. Stability assessments showed that the probe maintained high radiochemical purity (> 98%) after 24 h incubation in both PBS and 5% human serum albumin at 37 °C, confirming excellent stability. Additionally, the measured specific activity of [64Cu]Cu-NOTA-EV-F(ab’)2 was approximately 0.36 ± 0.02 MBq/µg (n = 5).
Fig. 1
Preparation, radiolabeling, characterization of EV-F(ab’)2, and immunohistochemical analysis of Nectin-4 expression in human tissues. (A) Enzymatic digestion of EV mAb with IdeS protease, followed by purification with Magne™ Protein A beads and MagneHis™ Ni particles (top). The synthesis and radiolabeling steps for [64Cu]Cu-NOTA-EV-F(ab’)2 are shown (bottom). The final radiolabeled product was used for in vivo imaging studies. (B) Immunohistochemical staining of Nectin-4 expression in human tissues, including heart, lung, liver, kidney, stomach, intestine, pancreas, and spleen. Scale bar = 100 μm
SDS-PAGE analysis (Figure S2A, supporting information) confirmed the successful enzymatic cleavage of EV. The intact EV mAb (~ 150 kDa) was efficiently digested into F(ab’)2 fragments (~ 100 kDa). SDS-PAGE analysis showed that while EV appeared as a single band around 150 kDa, the EV-F(ab’)2 sample presented as a cluster of closely migrating bands around 100–130 kDa, which we attribute to mixed bands arising from microheterogeneity rather than incomplete enzymatic cleavage. HPLC analysis (Figure S2B, supporting information) further validated the integrity and purity of the fragments. Importantly, HPLC analysis confirmed a single dominant peak, supporting the overall integrity and purity of the EV-F(ab’)2 preparation. A single major peak was observed for both EV and EV-F(ab’)2 between 10 and 12 min. The retention time of EV-F(ab’)2 was delayed by approximately 1.5 min compared to intact EV, indicating successful fragmentation and separation.
Immunohistochemical staining of Nectin-4 expression in human tissuesImmunohistochemical staining (Fig. 1B) was performed to assess the expression and distribution of Nectin-4 across different human organs. The results revealed strong Nectin-4 expression in the lung, kidney, and intestine, suggesting a significant presence of this protein in epithelial-rich tissues. In contrast, the heart, liver, stomach, pancreas, and spleen exhibited only weak to negligible expression, indicating that Nectin-4 has minimal or no involvement in these organs. These findings align with previously reported patterns of Nectin-4 expression and highlight the tissue-specific distribution of Nectin-4, which may have important implications for the development of Nectin-4-targeted diagnostics and therapeutics.
Nectin-4 expression and cellular binding in GC and NSCLC cell linesFlow cytometry analysis (Fig. 2A) confirmed differential Nectin-4 expression across the two cancer types. Notably, NCI-N87 and H1975 exhibited higher fluorescence intensity, indicating elevated Nectin-4 expression compared to HGC-27 and H520. Based on these results, NCI-N87 and H1975 were designated as Nectin-4 high-expressing cell lines, while HGC-27 and H520 were categorized as low-expressing. Furthermore, fluorescence intensity was similar among cells incubated with Alexa Fluor 488-labeled NOTA-EV-F(ab’)2, EV-F(ab’)2, NOTA-EV, and EV—all of which showed higher signal than the Alexa Fluor 488-only and unstained control groups—indicating effective binding of EV to Nectin-4 protein.
Fig. 2
Nectin-4 expression and cellular binding of [64Cu]Cu-NOTA-EV and [64Cu]Cu-NOTA-EV-F(ab’)2 in cancer cell lines. (A) Flow cytometry analysis of Nectin-4 expression in human GC and NSCLC cell lines. Cells (NCI-N87, HGC-27, H1975, and H520) were incubated with Alexa Fluor 488-labeled probes (NOTA-EV, NOTA-EV-F(ab’)2, EV, EV-F(ab’)2) or secondary antibody only (AF488) for 1 h on ice. Unstained controls were included for baseline fluorescence. Histogram plots display fluorescence intensity shifts indicative of Nectin-4 expression. NCI-N87 and H1975 show strong signal, while HGC-27 and H520 demonstrate low baseline fluorescence, consistent with Nectin-4 expression levels. (B) Cellular uptake assays of [64Cu]Cu-NOTA-EV and [64Cu]Cu-NOTA-EV-F(ab’)2 in NCI-N87, HGC-27, H1975, and H520 cells after 2 h of incubation, with and without blocking. Data are presented as mean ± SD (**P < 0.01, ***P < 0.001, n = 3). (C) Saturation binding curves of [64Cu]Cu-NOTA-EV and [64Cu]Cu-NOTA-EV-F(ab’)2 in NCI-N87 and H1975 cells (n = 3). (D) Immunofluorescence staining of Nectin-4 in NCI-N87, HGC-27, H1975, and H520 cells. Nuclei were counterstained with DAPI. Scale bar = 20 μm
A cell uptake assay was performed to assess the specificity of [64Cu]Cu-NOTA-EV and [64Cu]Cu-NOTA-EV-F(ab’)2 toward Nectin-4. As shown in Fig. 2B, both tracers demonstrated significant uptake in Nectin-4-expressing cells (NCI-N87 and H1975). In NCI-N87 cells, uptake was 3.93 ± 0.47%AD/105 cells for [64Cu]Cu-NOTA-EV and 3.64 ± 0.28%AD/105 cells for [64Cu]Cu-NOTA-EV-F(ab’)2. In H1975 cells, uptake values were 2.96 ± 0.31%AD/105 cells and 2.43 ± 0.17%AD/105 cells for [64Cu]Cu-NOTA-EV and [64Cu]Cu-NOTA-EV-F(ab’)2, respectively. No significant differences were observed between the full-length EV and EV-F(ab’)2 tracers. Furthermore, blocking significantly reduced tracer binding in all groups to levels comparable with Nectin-4 low-expressing cell lines (HGC-27 and H520), confirming the specificity of both tracers. For example, in NCI-N87 cells, uptake decreased from 3.93 ± 0.47 to 0.43 ± 0.04%AD/105 cells after blocking, while uptake in HGC-27 cells was 0.84 ± 0.18%AD/105 cells (P < 0.01). Direct statistical comparisons between [64Cu]Cu-NOTA-EV and [64Cu]Cu-NOTA-EV-F(ab’)2 demonstrated no significant difference in tracer uptake within NCI-N87 and H1975 cells (P > 0.05).
Saturation binding assays (Fig. 2C) further quantified binding affinity. The results showed that [64Cu]Cu-NOTA-EV displayed a higher binding affinity than [64Cu]Cu-NOTA-EV-F(ab’)2 in NCI-N87 cells, with KD values of 8.55 nM and 15.28 nM, respectively. In H1975 cells, similar results were observed with KD values of 5.57 nM for [64Cu]Cu-NOTA-EV compared to 6.95 nM for [64Cu]Cu-NOTA-EV-F(ab’)2. These findings suggest that the full-length EV construct may offer better targeting efficiency for Nectin-4. Regarding binding capacity (Bmax), [64Cu]Cu-NOTA-EV showed a higher capacity than [64Cu]Cu-NOTA-EV-F(ab’)2 in H1975 cells (0.13 vs. 0.06, respectively). However, [64Cu]Cu-NOTA-EV-F(ab’)2 showed a slightly higher binding capacity than [64Cu]Cu-NOTA-EV in NCI-N87 cells (0.11 vs. 0.07, respectively). As EV and its derivatives are known to internalize upon Nectin-4 binding, the cell-associated radioactivity measured after a 4 h incubation at 37 °C likely reflects both membrane-bound and internalized fractions. Therefore, the calculated KD and Bmax values represent apparent binding parameters under internalization-permissive conditions. Immunofluorescence imaging (Fig. 2D) corroborated flow cytometry findings, with strong Nectin-4 staining in NCI-N87 and H1975 cells and minimal fluorescence in HGC-27 and H520, confirming lower Nectin-4 expression in the latter.
In vivo PET imaging and ex vivo biodistribution of [64Cu]Cu-NOTA-EV and[64Cu]Cu-NOTA-EV-F(ab’)2 in GC modelsAs shown in Fig. 3A–B, PET imaging and quantitative ROI analysis demonstrated distinct biodistribution patterns of [64Cu]Cu-NOTA-EV and [64Cu]Cu-NOTA-EV-F(ab’)2 in NCI-N87 and HGC-27 xenografts. [64Cu]Cu-NOTA-EV exhibited increasing tumor accumulation over time, reaching the highest uptake at 48 h p.i. (13.83 ± 1.89%ID/g). In contrast, [64Cu]Cu-NOTA-EV-F(ab’)2 displayed peak uptake at 4 h p.i. (10.23 ± 0.70%ID/g in NCI-N87; 3.03 ± 0.35%ID/g in HGC-27) and gradually cleared thereafter. Blocking with excess unlabeled EV-F(ab’)2 significantly reduced uptake in NCI-N87 tumors (6.27 ± 0.49%ID/g), confirming Nectin-4-specific binding of [64Cu]Cu-NOTA-EV-F(ab’)2 (P = 0.0029). In non-tumor organs, both tracers showed notable liver uptake at early time points, with [64Cu]Cu-NOTA-EV exhibiting sustained liver retention compared to [64Cu]Cu-NOTA-EV-F(ab’)2. Liver uptake of [64Cu]Cu-NOTA-EV gradually declined over time, while [64Cu]Cu-NOTA-EV-F(ab’)2 cleared more rapidly. A similar clearnace trend was observed in the spleen. In contrast, renal uptake was significantly higher for [64Cu]Cu-NOTA-EV-F(ab’)2, particularly at earlier time points, reflecting enhanced renal clearance due to its smaller molecular size. Renal retention of [64Cu]Cu-NOTA-EV-F(ab’)2 remained higher than that of [64Cu]Cu-NOTA-EV at 48 h p.i., consistent with the excretion pathway of antibody fragments. Heart uptake, representing blood circulation, was relatively low for both tracers and decreased over time. However, the faster decline in heart uptake for [64Cu]Cu-NOTA-EV-F(ab’)2 suggests more rapid systemic clearance compared to [64Cu]Cu-NOTA-EV, which exhibited prolonged circulation due to its larger size and intact Fc region. Muscle uptake remained consistently low across all time points, leading to high tumor-to-muscle contrast for both tracers. In Nectin-4-low expressing HGC-27 tumors, overall tumor uptake was lower compared to NCI-N87 xenografts, further supporting the specificity of [64Cu]Cu-NOTA-EV-F(ab’)2 to Nectin-4.
Fig. 3
PET imaging and ex vivo biodistribution of [64Cu]Cu-NOTA-EV and [64Cu]Cu-NOTA-EV-F(ab’)2 in murine models of GC. (A) Representative PET images of mice bearing NCI-N87 or HGC-27 tumors following intravenous injection of [64Cu]Cu-NOTA-EV or [64Cu]Cu-NOTA-EV-F(ab’)2 at 1, 4, 12, 24, and 48 h p.i. Blocking studies were conducted by co-injecting an excess of unlabeled EV-F(ab’)2 in NCI-N87 tumor-bearing mice. (B) Quantitative ROI analysis of [64Cu]Cu-NOTA-EV and [64Cu]Cu-NOTA-EV-F(ab’)2 in tumors and major organs (heart, liver, spleen, kidney, and muscle) at 1, 4, 12, 24, and 48 h p.i. Cyan represents [64Cu]Cu-NOTA-EV in NCI-N87; Red represents [64Cu]Cu-NOTA-EV-F(ab’)2 in NCI-N87; Orange represents [64Cu]Cu-NOTA-EV-F(ab’)2 with blocking in NCI-N87; Blue represents [64Cu]Cu-NOTA-EV-F(ab’)2 in HGC-27. (C) Tumor-to-heart and tumor-to-muscle ratios of [64Cu]Cu-NOTA-EV and [64Cu]Cu-NOTA-EV-F(ab’)2 over time. (D) Ex vivo biodistribution of [64Cu]Cu-NOTA-EV and [64Cu]Cu-NOTA-EV-F(ab’)2 at 48 h p.i. Data are presented as mean ± SD (**P < 0.01, ***P < 0.001). n = 3/group
In Fig. 3C, the tumor-to-heart ratio of [64Cu]Cu-NOTA-EV-F(ab’)2 peaked at 48 h p.i., confirming efficient blood clearance and tumor-specific accumulation, whereas the tumor-to-muscle ratio showed an optimal tumor contrast at 12 h p.i. In NCI-N87 xenografts, [64Cu]Cu-NOTA-EV-F(ab’)2 achieved a tumor-to-heart ratio of 3.27 ± 0.55 at 12 h p.i., which was significantly higher than the negative control (1.43 ± 0.10, P = 0.00505) and blocking group (2.04 ± 0.28, P = 0.03223). [64Cu]Cu-NOTA-EV had a lower tumor-to-heart ratio at 12 h p.i. (0.80 ± 0.07, P = 0.00161 vs. [64Cu]Cu-NOTA-EV-F(ab’)2), indicating slower clearance from blood circulation. Similarly, the tumor-to-muscle ratio of [64Cu]Cu-NOTA-EV-F(ab’)2 in NCI-N87 tumors was 12.91 ± 2.10 at 12 h p.i., significantly higher than the negative control (3.77 ± 0.74, P = 0.00213) and blocking group (6.96 ± 0.69, P = 0.00995). At 12 h p.i., [64Cu]Cu-NOTA-EV had a tumor-to-muscle ratio of 9.15 ± 0.93, which was also significantly lower than [64Cu]Cu-NOTA-EV-F(ab’)2 (P = 0.04839).
Ex vivo biodistribution studies (Fig. 3D; Table S2, supporting information) confirmed significantly higher tumor uptake of [64Cu]Cu-NOTA-EV-F(ab’)2 in NCI-N87 and H1975 xenografts compared to control and blocking groups. At 48 h p.i. in NCI-N87 tumors, [64Cu]Cu-NOTA-EV-F(ab’)2 accumulation was 5.81 ± 0.69%ID/g, while uptake in the negative control and blocking groups was significantly lower (1.37 ± 0.16%ID/g, P = 0.00088; 2.68 ± 0.48%ID/g, P = 0.0061). Overall, these results demonstrate that both tracers showed specific Nectin-4 binding. In addition, ex vivo biodistribution analysis at 48 h post-injection revealed significantly higher tumor accumulation of [64Cu]Cu-NOTA-EV compared to [64Cu]Cu-NOTA-EV-F(ab’)2 in NCI-N87 xenografts (P = 0.0012), [64Cu]Cu-NOTA-EV exhibits superior tumor retention over time, while [64Cu]Cu-NOTA-EV-F(ab’)2 provides improved tumor-to-background contrast at earlier imaging time points.
In vivo PET imaging and ex vivo biodistribution of [64Cu]Cu-NOTA-EV and [64Cu]Cu-NOTA-EV-F(ab’)2 in NSCLC modelsThe tumor-targeting efficiency and specificity of both [64Cu]Cu-NOTA-EV and [64Cu]Cu-NOTA-EV-F(ab’)2 were also evaluated in NSCLC xenografts. As shown in Fig. 4A–B, PET imaging demonstrated time-dependent tumor accumulation of [64Cu]Cu-NOTA-EV in H1975 xenografts, with uptake increasing over time and reaching a peak of 14.00 ± 1.22%ID/g at 48 h p.i. In contrast, [64Cu]Cu-NOTA-EV-F(ab’)2 exhibited peak tumor uptake of 11.56 ± 1.12%ID/g at 4 h p.i., followed by gradual clearance. At the same time point, blocking experiments significantly reduced tumor uptake (5.23 ± 0.31%ID/g, P = 0.00074), while uptake in the H520 negative group was even lower (2.77 ± 0.47%ID/g, P = 0.00024), confirming the specificity of [64Cu]Cu-NOTA-EV-F(ab’)2 for Nectin-4 targeting. A similar biodistribution pattern was observed in non-tumor organs between the GC and NSCLC mouse models.
Fig. 4
PET imaging and ex vivo biodistribution of [64Cu]Cu-NOTA-EV and [64Cu]Cu-NOTA-EV-F(ab’)2 in murine models of NSCLC. (A) Representative PET images of H1975 and H520 tumor-bearing mice at 1, 4, 12, 24, and 48 h p.i. following intravenous injection of [64Cu]Cu-NOTA-EV or [64Cu]Cu-NOTA-EV-F(ab’)2. Blocking studies were conducted by co-injecting an excess of unlabeled EV-F(ab’)2 in H1975 tumor-bearing mice. (B) Quantitative ROI analysis of [64Cu]Cu-NOTA-EV and [64Cu]Cu-NOTA-EV-F(ab’)2 in tumors and major organs (heart, liver, spleen, kidney, and muscle) at 1, 4, 12, 24, and 48 h p.i. Cyan represents [64Cu]Cu-NOTA-EV in H1975; Red represents [64Cu]Cu-NOTA-EV-F(ab’)2 in H1975; Orange represents [64Cu]Cu-NOTA-EV-F(ab’)2 with blocking in H1975; Blue represents [64Cu]Cu-NOTA-EV-F(ab’)2 in H520. (C) Tumor-to-heart and tumor-to-muscle ratios of [64Cu]Cu-NOTA-EV and [64Cu]Cu-NOTA-EV-F(ab’)2 over time. (D) Ex vivo biodistribution of [64Cu]Cu-NOTA-EV and [64Cu]Cu-NOTA-EV-F(ab’)2 at 48 h p.i. Data are presented as mean ± SD (**P < 0.01, ***P < 0.001). n = 3/group
Tumor-to-background ratios are shown in Fig. 4C. At 12 h p.i., [64Cu]Cu-NOTA-EV-F(ab’)2 achieved a significantly higher tumor-to-heart ratio of 3.18 ± 0.37 compared to the negative control (1.17 ± 0.22, P = 0.00124) and blocking group (1.48 ± 0.21, P = 0.00219). Meanwhile, [64Cu]Cu-NOTA-EV showed a much lower tumor-to-heart ratio (0.67 ± 0.17, P = 0.00043), indicating that the F(ab’)2 variant offers superior tumor contrast. Similarly, the tumor-to-muscle ratio for [64Cu]Cu-NOTA-EV-F(ab’)2 reached 14.36 ± 1.75 at 12 h p.i., significantly higher than the H520 negative control (3.08 ± 0.34, P = 0.00040) and blocking group (5.02 ± 0.68, P = 0.00102). In contrast, [64Cu]Cu-NOTA-EV had a tumor-to-muscle ratio of 12.59 ± 3.62, which was comparable to that of [64Cu]Cu-NOTA-EV-F(ab’)2.
Ex vivo biodistribution at 48 h p.i. (Fig. 4D; Table S3, supporting information) further validated the imaging findings. [64Cu]Cu-NOTA-EV-F(ab’)2 demonstrated significantly higher tumor retention in the H1975 Nectin-4-positive group (5.45 ± 0.57%ID/g) compared to the H520 negative control (1.41 ± 0.09%ID/g, P = 0.0006) and the blocking group (3.10 ± 0.26%ID/g, P = 0.0061). In addition, ex vivo biodistribution analysis at 48 h post-injection revealed significantly higher tumor accumulation of [64Cu]Cu-NOTA-EV compared to [64Cu]Cu-NOTA-EV-F(ab’)2 in H1975 xenografts (P = 0.0066). These results confirm the specificity of [64Cu]Cu-NOTA-EV-F(ab’)2 and highlight its potential for NSCLC imaging.
Immunohistochemical and H&E stainingH&E staining confirmed the histological characteristics of NCI-N87, HGC-27, H1975, and H520 tumors (Fig. 5A). IHC staining revealed high Nectin-4 expression in NCI-N87 and H1975 tumors, while HGC-27 and H520 exhibited minimal staining (Fig. 5B), supporting the selective expression of Nectin-4 in these tumor tissues. In normal organs (Fig. 5C), H&E staining results indicated no significant pathological changes in the heart, lung, liver, kidney, stomach, intestine, pancreas, and spleen, suggesting no observable toxicity associated with the administration of [64Cu]Cu-NOTA-EV-F(ab’)2. In normal tissues, IHC staining (Fig. 5D) demonstrated varying levels of Nectin-4 expression: strong staining in the lung, kidney, and intestine; weak staining in the heart, liver, stomach, and pancreas; and negligible staining in the spleen. These findings confirm that the safety of [64Cu]Cu-NOTA-EV-F(ab’)2 in both GC and NSCLC models, reinforcing its potential for further clinical development of Nectin-4 targeting in cancer diagnosis and therapy.
Fig. 5
H&E and immunohistochemical analysis of Nectin-4 expression in murine tumor and normal tissues. (A) H&E staining of NCI-N87, HGC-27, H1975, and H520 tumors. (B) Immunohistochemical staining for Nectin-4 expression in NCI-N87, HGC-27, H1975, and H520 tumors. (C) H&E staining of heart, lung, liver, kidney, stomach, intestine, pancreas, and spleen. (D) Immunohistochemical staining for Nectin-4 expression in heart, lung, liver, kidney, stomach, intestine, pancreas, and spleen. Scale bar: 100 μm
Immunofluorescence stainingImmunofluorescence staining was performed to evaluate Nectin-4 expression and vascularization in tumors and major normal organs. In tumor tissues (Fig. 6A), strong Nectin-4 staining was observed in NCI-N87 and H1975 tumors, consistent with the immunohistochemistry results, while HGC-27 and H520 tumors displayed minimal expression. CD31 staining revealed varying levels of vascularization, with NCI-N87 and H520 tumors showing a well-developed vascular network. In normal tissues (Fig. 6B), Nectin-4 expression was prominent in the lung, kidney, and intestine, with weak staining in the heart and minimal or no expression in the liver, spleen, pancreas, and stomach. CD31 staining highlighted the vascular architecture of each organ, with particularly strong endothelial signals in the heart, lung, and kidney. The selective expression of Nectin-4 in tumor tissues and limited distribution in normal organs further support the potential of [64Cu]Cu-NOTA-EV-F(ab’)2 as a promising tracer for Nectin-4 targeting.
Fig. 6
Immunofluorescence analysis of Nectin-4 expression and vascularization in tumors and normal tissues. (A) Representative immunofluorescence staining of tumor tissues (NCI-N87, HGC-27, H1975, and H520) for Nectin-4 (red) and CD31 (green). Nucleus staining with DAPI (blue) is shown for reference. (B) Immunofluorescence staining of major normal organs from H1975 tumor-bearing mice, including heart, lung, liver, spleen, pancreas, stomach, intestine, and kidney. Scale bar: 100 μm
Radiation dosimetry extrapolationTable 1 summarizes the estimated radiation doses deposited in human organs from [64Cu]Cu-NOTA-EV-F(ab’)2 based on biodistribution data. Likewise, Supplementary Table 1 contains the radiation dose estimates for [64Cu]Cu-NOTA-EV. For an adult woman, the calculated systemic effective dose was 0.0353 mSv/MBq, which is within the acceptable range for standard nuclear medicine studies, and provides a rational basis for planning future clinical investigations, pending validation through first-in-human studies.
Table 1 Radiation dosimetry Estimation of [64Cu]Cu-NOTA-EV-F(ab’)2 in human organs
Comments (0)