
Remember me

Between January 1997 and January 2024, a total of 1451 consecutive male patients with localized PCa were treated with primary EBRT alone as part of a prospective institutional program for risk-adapted dose-intensified RT. For the present analysis, we specifically selected a cohort of 424 consecutive HRPCa patients, defined according to the National Comprehensive Cancer Network (NCCN) criteria and the following eligibility requirements: histological diagnosis of acinar adenocarcinoma, no evidence of regional nodal or distant disease on conventional imaging, a radiation dose exceeding 66.0 Gy, no prior, concomitant or adjuvant treatment with chemotherapy or novel androgen receptor pathway inhibitors (ARPIs), no combined treatment with brachytherapy, and a minimum follow-up (FU) period of five years. Exclusion criteria included the presence of other histologies, T4 or N1 tumours.
Pre-treatment diagnostic evaluations included blood chemistry analysis, digital rectal examination, transrectal ultrasound, magnetic resonance imaging (MRI) of prostate since 2007, and conventional imaging for clinical staging (computed tomography of the thorax, abdomen and pelvis, and bone scan).
TreatmentAll patients were treated with EBRT alone within a framework of a continuous and progressive dose-intensification institutional program. The median RT dose was 79.2 Gy (interquartile range [IQR]: 74.9–80.3 Gy). Treatment was delivered in daily fractions of 1.8–2.0 Gy in 407 cases, while alternative moderated fractionation schemes were employed in 17 cases. The first 274 patients (65%) received treatment with three-dimensional conformal RT (3D-CRT). From 2007 onward, the subsequent 150 patients (35%) were treated with intensity-modulated/image-guided RT (IMRT/IGRT), using intra-prostatic gold fiducial markers to enhance the RT dose prescription to 80.0 Gy. The techniques for simulation, treatment planning, and delivery for both 3D-CRT and IMRT have been described in detail elsewhere [8]. The clinical target volume primarily included the prostate gland and the proximal two-thirds of the seminal vesicles. Given the controversy regarding the role of prophylactic pelvic radiotherapy at the time, elective pelvic node radiotherapy (ENRT) was at the discretion of the physician and administered to 117 patients at doses of 45.0–50.0 Gy. Androgen deprivation was given as part of two consecutive multi-institutional trials [10, 11]. Short term ADT (6 months, STADT) and LADT (24–36 months) were administered in 56 (13%) and 350 (83%) of patients respectively. Table 1 summarizes the patient and treatment characteristics.
Table 1 Summary of patients’ and treatment characteristicsAll patients were continuously monitored from the time of treatment completion, and the duration of FU was calculated from the date of diagnosis. FU visits, including digital rectal examinations, PSA measurements, and assessments of specific genitourinary (GU) and rectal morbidity, were conducted every 3–6 months for four years, and annually thereafter. CT, bone scans, and chest X-rays were scheduled for re-staging following PSA failure.
Outcomes and definitionsOS was defined as the time from diagnosis to death from any cause or censoring at the date of the last contact. MFS was defined as the time from diagnosis to metastasis or death from any cause, whichever occurred first, or as censored at the date of the last follow-up. CSS included all deaths from PCa or treatment-related complications, as well as deaths from unknown causes in patients with active cancer, excluding those with only biochemical failure. The cause of death was recorded by the treating physician and reviewed in clinical records if necessary.
Late toxicity assessments (occurring > 90 days after RT and graded according to the RTOG/EORTC late radiation morbidity scheme, were performed at each follow-up visit. The Common Terminology Criteria for Adverse Events (CTCAE) scoring system was used for specific conditions, such as urethral stenosis, incontinence, rectal bleeding, and haematuria. The highest recorded acute and chronic urinary toxicity for each patient was used in the analysis.
StatisticsQuantitative variables were expressed as mean and standard deviation (SD) or median and interquartile range (IQR) for the variables with non-normal distribution. For qualitative variables, frequency and proportions were used.
The OS analysis was done using Kaplan–Meier curves, and the treatment groups were compared using the log-rank (Mantel-Cox) test and the Cox proportional-hazards model to compute hazard ratios (HRs). The cumulative incidence curves of MFS and CSS were assessed using competing risk regression. For cancer-specific death and MFS, comparisons between groups were conducted using the Fine and Gray model to account for the competing risk of non-PCa mortality and estimate sub-distribution hazard ratios (HRs). Death from any cause was considered a competing risk [9].
Univariate and multivariate Cox regression analysis (MVA) was performed to assess the association between clinical outcomes and treatment, adjusting for predefined relevant clinical and demographic factors. The variables included in the analysis were patient age (both continuous and categorical), T stage, pre-treatment PSA (continuous and categorical), Gleason score -empirically adapted to International Society of Urological Pathology (ISUP) groups-, duration of ADT, and radiation dose (continuous and categorical). Patients treated with ENRT (117) were not excluded from the analysis. Variables with a p-value < 0.1 in univariate analysis, as well as those with p ≥ 0.1 but deemed clinically relevant, were included in the MVA. Two-sided p-values < 0.05 were considered statistically significant. Statistical analyses were conducted using R v.4.3.2
OutcomesThe median patient age was 69 years (IQR 65–72), and the median FU was 118 months (IQR 88–135). At the time of analysis, 54 out of 424 patients (13%) had died. The leading cause of death was cardiovascular disease in 16 of 54 patients (4%), followed by PCa in 15 patients (3%) and other malignancies in 9 patients (2%). Biochemical failure (BF) (nadir + 2 criteria) occurred in 101 patients (24%), with a median time to event of 112 months (IQR 80–130). Of the 101 patients with BF, 97 received salvage therapy, primarily with hormone therapy (51 patients, 53%). Distant metastasis developed in 41 patients (10%), with a median time to event of 113 months (IQR 87–139). Local metastasis-directed therapy (MDT) combined with hormone therapy was administered in 8 patients, while salvage doublet therapy with docetaxel or androgen receptor pathway inhibitors (ARPIs) was administered as part of a clinical trial to 10 patients.
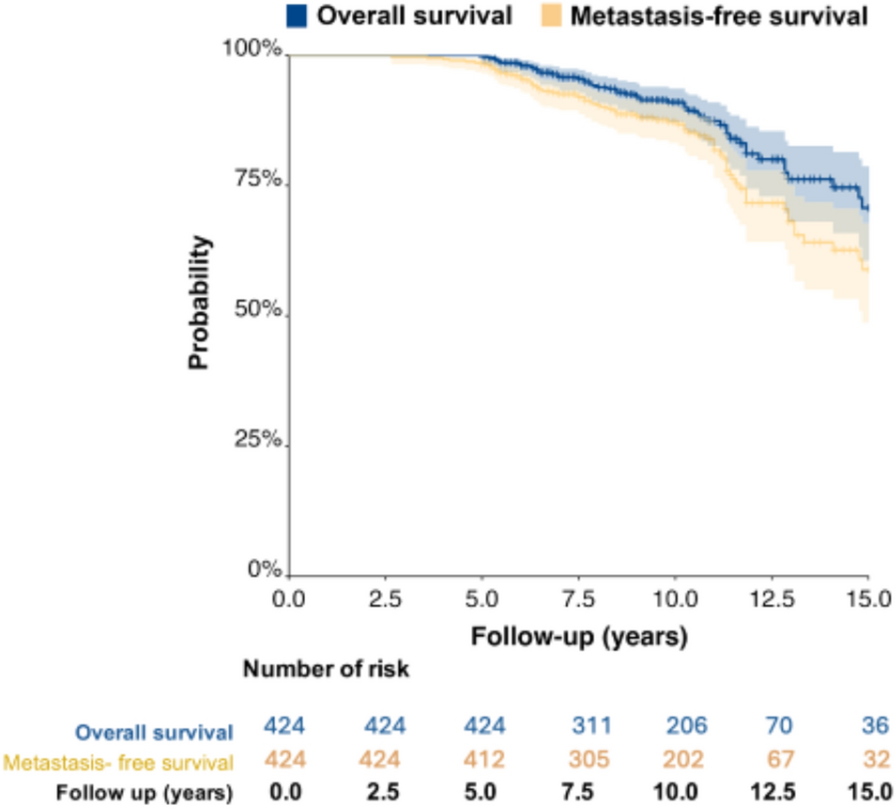
At 10 and 15 years, the Kaplan–Meier estimated OS rates were 91% (95% CI 87–93) and 71% (95% CI 61–79), respectively. The corresponding rates for MFS were 87% (95% CI 83–90) and 60% (95% CI 49–68), while those for CSS were 97% (95% CI 95–99) and 90% (95% CI 49–81), respectively (Figs. 1 and 2). The 10-year estimated incidence of grade ≥ 2 late urinary complications was 13%, while that of grade ≥ 2 late rectal toxicity was 10%. There were only nine cases (2%) of grade 3 genitourinary (GU) toxicity and two cases of grade 4 GU complications. Regarding gastrointestinal (GI) toxicity, there were four cases (0.9%) of grade 3 toxicity, with no cases of grade 4 toxicity reported.
Fig. 1
Kaplan Meier curves for overall survival and metastasis-free survival
Fig. 2
Cumulative incidence of cause specific mortality from the Fine and Gray models
The results of the univariate and MVA are summarized in Tables 2 and 3 and Appendices 1 and 2. For clarity, we decided to exclude from the radiation-dose analysis the 17 patients treated with a fractionation different from 1.8–2 Gy per fraction. The univariate analysis for OS showed that higher radiation dose (as continuous variable, HR 0.89, 95% CI 0.85–0.93, p < 0.001), low patient age (HR 1.07, 95% CI 1.02–1.12, p = 0.010), and LTADT (HR 0.26, 95% CI 0.12–0.58, p < 0.001) were significantly associated with an improvement in OS, whereas T stage, PSA levels, and Gleason/ISUP grade groups were not. Unexpectedly, patients treated with ENRT experienced significantly more events than those who did not receive ENRT (p < 0.001). This finding was deemed a bias-related artifact (patients with poorer prognosis and lower radiation dose) and was therefore excluded from the MVA.
Table 2 Univariate and multivariate Cox analysis for overall survivalTable 3 Univariate and multivariate Cox analysis for metastasis-free survivalIn the MVA, when adjusted for patient age and length of hormone-therapy, higher radiation dose remained significantly associated with an improved OS (HR 0.89, 95% CI 0.84–0.94).The 10-year OS was 95% for patients receiving RT at doses > 74 Gy, compared to 81% for those receiving lower RT doses (supplementary information in Appendix 1 and 2). With regard to MFS, higher radiation dose was also associated with a significant improvement in MFS, in both univariate and MVA (HR 0.94, 95% CI 0.90–0.98), together to Gleason/ISUP grade groups 4–5 (HR 1.66, 95% CI 1.01–2.73) (Figs. 3 and 4, Appendices 1 and 2).
Fig. 3
Kaplan Meier curve for overall survival by radiation dose
Fig. 4
Kaplan Meier curve for metastasis-free survival by radiation dose
Finally, although the number of events was low, we also observed a significant improved CSS with higher radiation doses (HR: 0.84; 95% CI 0.84–0.94) (Fig. 5, Appendix 1).
Fig. 5
Cause –specific mortality curves from the Fine and Gray models by radiation dose
Comments (0)