
Remember me
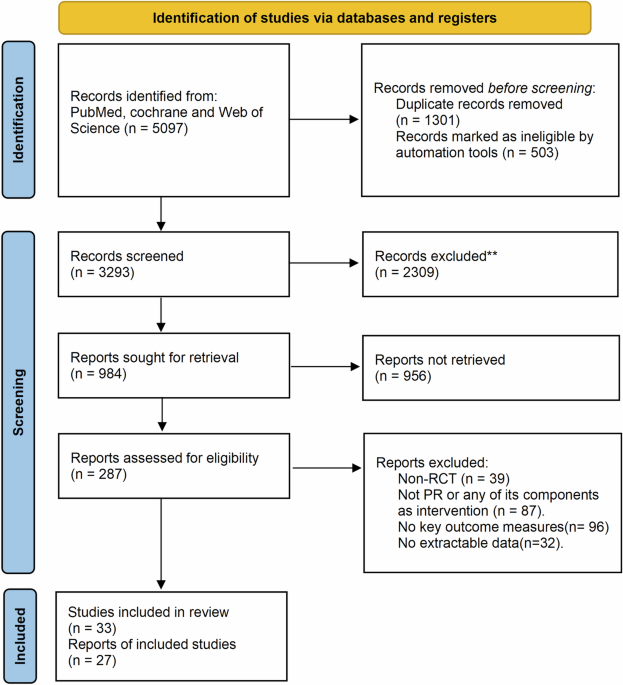
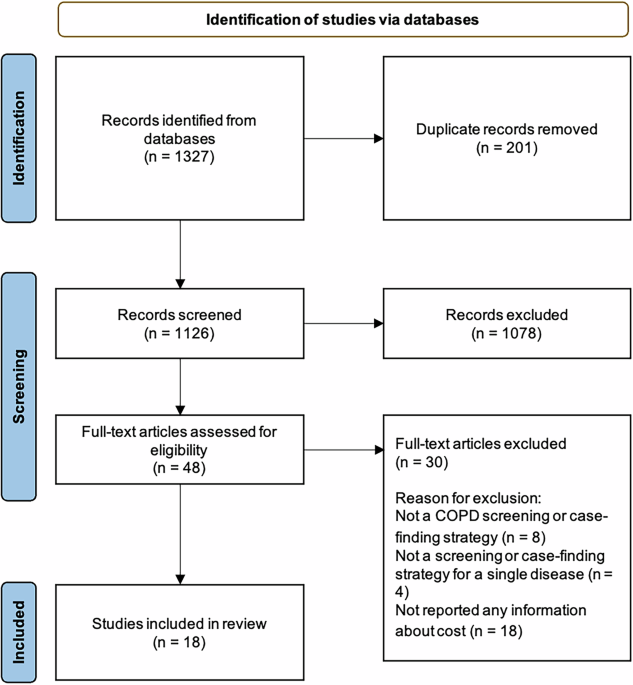
The Asthma Learning Healthcare System (ALHS) study recruited over half a million patients from 75 general practices in Scotland, with primary care records linked to national accident and emergency (A&E), hospital, and mortality datasets20. The original study period was between January 2009 and March 2017. The initial data processing report is provided in Supplementary Material A. The linked analysis dataset flow diagram is presented in Fig. 1.
Fig. 1
Linked Analysis Dataset Flow Diagram.
Analysis populationThe analysis population for this study was adults (aged 18 and over), diagnosed with asthma in primary care, and treated with inhaled corticosteroids (ICS)21. The exclusion criteria were having missing age or sex in the primary care registration record.
Eachsample in the final analysis dataset was a day on which a primary care consultation related to asthma or a respiratory infection occurred, without an oral corticosteroid (OCS) prescription or secondary care asthma encounter. Therefore, we additionally excluded individuals who had no such event during their follow-up (as defined in Supplementary Material A).
Finally, those with a diagnosis of Chronic Obstructive Pulmonary Disease (COPD) were identified, and the time between first asthma diagnosis and first COPD diagnosis was estimated. A diagnosis of COPD prior to a diagnosis of asthma excluded patients from primary analyses, however they were retained for a sensitivity analysis (model testing only, no data included in model training). Similarly, for those with a diagnosis of COPD following their asthma diagnosis, the time (and any samples) after their COPD diagnosis was excluded from model training, but was retained for sensitivity analysis (model testing only).
Outcome ascertainmentThe model’s outcome was asthma attacks occurring within one year from the index date of each samples. The joint American Thoracic Society (ATS) and European Respiratory Society (ERS) Task Force definition of a severe exacerbation22 was used to define an asthma attack: a prescription of OCS, an asthma-related A&E visit, or an asthma-related hospital admission (ICD-10 codes J45 and J46). In addition, deaths with asthma as the primary cause were considered indicative of an asthma attack. The identification of asthma-related A&E presentations, inpatient admissions, and deaths is described in Supplementary Material A.
Prescriptions for OCS were considered indicative of an asthma attack if all of the following conditions were also met: 1) they were prescribed to someone with a diagnosis of asthma or receiving asthma treatment, 2) they were prescribed on the same day as an asthma-related consultation, 3) the prescribed strength was greater than or equal to 5 mg per dose, and 4) the total prescribed dose was between 50 and 350 mg.
Prediction model featuresSupplementary Material B describes the full set of risk factors that were included in the analysis, and notes regarding the feature extraction method and missing data handling.
Training data enrichmentAs described in the introduction, the low incidence of asthma attacks in the general asthma population results in complexity in model development which can often result in poor model sensitivity. Herein, we have tested the utility of the training data enrichment method known as SMOTEing23,24, with three difference parameter sets as described in Supplementary Material C.
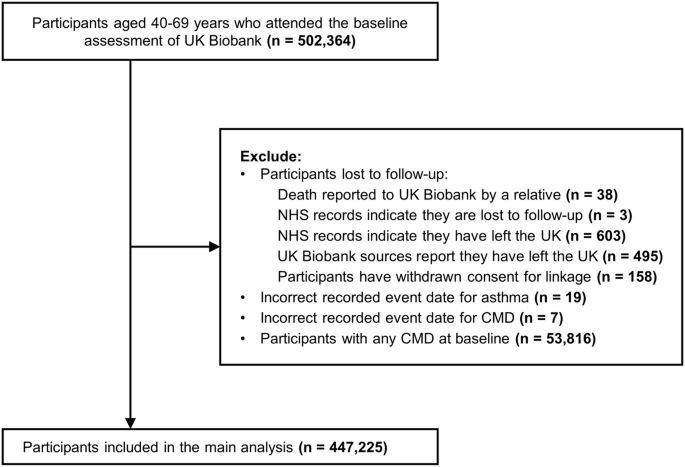
Analysis planIn this analysis, a random partition approach was used to split the population for model training and testing, as shown in Fig. 2. A random 90% partition of the ALHS dataset population was used for hyper-parameter optimisation, model selection and initial performance reporting (henceforth the derivation subset, n = 523,611 samples), and the remaining 10% was held-out for assessing model generalisation (hold-out testing subset, n = 63,331 samples). During the model selection process, the derivation dataset was randomly partitioned another 100 times, again with 90% of the data used for training the final selected algorithm (approximately 471,000 samples), hyper-parameters, and enrichment method, and 10% for internal validation (approximately 52,000 samples).
Fig. 2
Diagram of Dataset Partitioning for Model Training, Model Selection, Internal Validation Performance Reporting, and Testing Partition Performance Reporting.
Four algorithms were tested, namely Naïve Bayes Classifier, Logistic Regression, Random Forests, and Extreme Gradient Boosting; these included variations based on training data enrichment approaches, algorithm hyper-parameters, and classification thresholds. The full model selection process is detailed in Supplementary Material C.
For each iteration, model, and enrichment method, the Area Under the Receiver-Operator Curve (AUC) was calculated. The confusion matrix was also recorded, based on the primary classification threshold that optimised the Matthews Correlation Coefficient (MCC; identified using golden-section search optimisation25) in predictions made on the training data partition. The MCC was used as the primary performance measure as it utilises the balance ratios of all four categories of the confusion matrix (i.e., true positives, true negatives, false positives, and false negatives). The other performance measures reported were: sensitivity, specificity, positive predictive value (PPV), negative predictive value (NPV), accuracy, and balanced accuracy. Across iterations, summary statistics were calculated for each performance measure to provide some estimate of the average performance, and the certainty around that estimate.
As a sensitivity analysis of the classification threshold selection, a further three approaches were explored: 1) the default (probability greater than 0.5) classification threshold (aka ‘Fixed’), 2) the classification threshold closest to the outcome prevalence in the training data partition, to 3 decimal places (aka ‘Prevalence’), and 3) the mean of the ‘Variable’ and ‘Prevalence’ values (aka ‘Balanced’).
The model performance was summarised over the 100 iterations of the split-sample process. Calibration was assessed using the slope and intercept of a logistic regression model between the predicted risk and the observed outcome. Model coefficients were calculated across the models trained from the 100 iterations of derivation data partitioning.
Finally, the model was then retrained on the full derivation dataset and tested on the as-yet unseen holdout partition. The performance was also reported with data stratified by various risk factors. These were: (i) history of other comorbid chronic pulmonary disease, (ii) BTS Step (to evaluate the decision to assign the level ‘0’ to periods of non-adherence), (iii) missingness of peak flow and blood eosinophil measurements (to evaluate their added value), (iv) smoking status (to evaluate the utility of assigning the level ‘never’ having smoked to those with missing smoking status), (v) recent respiratory infections, oral steroid prescriptions and prior known asthma attacks (to establish the utility of the model in predicting those not known to be prone to attacks), and (vi) if or when in the future the patient was diagnosed with COPD. In the latter case, this information obviously could not be known at the time of prediction, however we explored it to examine the potential impact of over-lapping diagnosis, which might be considered in individuals at high risk of COPD.
ReportingDeviations from the protocol paper, published in BMJ Open in 201926, are listed in Supplementary Material D.
This work was written in line with guidance from RiGoR (Reporting Guidelines to address common sources of bias in Risk model development, by Kerr et al.27), TRIPOD (Transparent Reporting of a multivariable prediction model for Individual Prognosis Or Diagnosis, by Collins et al.28), and RECORD (Reporting of studies Conducted using Observational Routinely-collected health Data, by Benchimol et al.29). Checklists are presented in Supplementary Material E.
Comments (0)