
Remember me
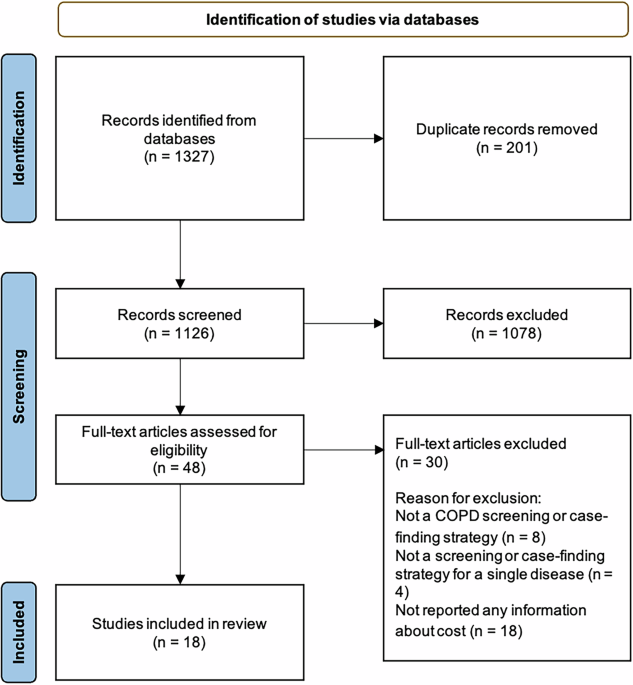
After excluding participants with an AHI < 15 events/h (n = 3230), a total of 2574 participants were included in the analysis examining the association between sleep duration and hypertension prevalence. For the analysis of hypertension incidence, 1001 participants were included after excluding those with hypertension at baseline (n = 1263) and those with missing hypertension data during follow-up (n = 310) (Fig. 1).
Fig. 1
Participant selection process.
Table 1 summarized the baseline characteristics according to hypertension status. Objective sleep duration (PSGTST) significantly differed among the three groups (p < 0.001): those with baseline hypertension, those who developed hypertension over 5 years, and those who remained free of hypertension. In contrast, the subjective sleep duration measures (AMTST and HABTST) did not show significant differences between the groups.
Table 1 Demographics, lifestyle, clinical, and sleep-related features of all patients categorized according to hypertension status.Hypertension prevalence and sleep durationTable 2 presents the results of logistic regression analyses investigating the relationship between sleep duration and hypertension prevalence.
Table 2 Univariable and multivariable logistic regression analysis of the association between objective and subjective sleep duration and the prevalence of hypertension (with the category of lowest sleep duration as the reference group).For PSGTST, in the unadjusted model, individuals who slept more than five hours had a significantly lower risk of hypertension compared to those who slept less than five hours. Specifically, sleep durations of 5–6 h, 6–7 h, and more than 7 h were associated with a 36% (OR: 0.64, 95% CI: 0.51–0.80), 41% (OR: 0.59, 95% CI: 0.48–0.74), and 49% (OR: 0.51, 95% CI: 0.39–0.68) reduced risk, respectively. These associations remained significant after adjusting for demographic and lifestyle factors (model 1), although the effect size was slightly attenuated: 29% for 5–6 h (OR: 0.71, 95% CI: 0.56–0.90), 32% for 6–7 h (OR: 0.68, 95% CI: 0.54–0.86), and 35% for > 7 h (OR: 0.65, 95% CI: 0.48–0.88). Further adjustment for clinical comorbidities, including diabetes, CVD history, insomnia, and medication use (model 2), resulted in similar reductions: 25% for 5–6 h (OR: 0.75, 95% CI: 0.58–0.96), 31% for 6–7 h (OR: 0.69, 95% CI: 0.54–0.88), and 37% for > 7 h (OR: 0.63, 95% CI: 0.46–0.86). These associations remained consistent in model 3 after additional adjustments for AHI and T90%.
For AMTST, model 0 indicated a protective effect for 5–6 h (OR: 0.75, 95% CI: 0.57–0.98) and 6–7 h (OR: 0.63, 95% CI: 0.49–0.81) compared to < 5 h, with a marginally significant association for > 7 h (OR: 0.78, 95% CI: 0.61–1.00). However, these associations weakened after adjusting for demographic, clinical, and OSA-related variables in models 1–3, with no significant associations remaining in the fully adjusted model.
For HABTST, in model 0, sleep durations of 6–7 h (OR: 0.70, 95% CI: 0.56–0.88) and 7–8 h (OR: 0.65, 95% CI: 0.53–0.81) were associated with a lower risk of hypertension compared to < 6 h. However, longer sleep durations (>8 h) did not show a significant protective effect. These associations weakened after further adjustments and became nonsignificant in the fully adjusted models.
To address potential bias from reference group selection, we reanalyzed the data using the longest sleep duration category as the reference. In this analysis, <5 h of PSGTST was consistently associated with a higher prevalence of hypertension across all models, with ORs ranging from 1.54–1.95. In contrast, the association between AMTST and hypertension weakened and lost statistical significance after adjustment. For HABTST, sleeping 7–8 h demonstrated a protective effect against hypertension compared to > 8 h in all models. However, sleep duration of < 6 h showed no significant difference in hypertension prevalence relative to the reference group, suggesting a nonlinear relationship between HABTST and hypertension prevalence (Supplementary Table 1).
The RCS analysis revealed a significant negative correlation between PSGTST and hypertension prevalence (p = 0.009), with no evidence of nonlinearity (p = 0.938). In contrast, AMTST showed no significant association with hypertension prevalence (p for overall = 0.724, p for nonlinearity = 0.425). For HABTST, a U-shaped relationship was observed (p for overall = 0.024, p for nonlinearity = 0.009), suggesting that both very short and long habitual sleep durations may be linked to higher hypertension prevalence (Fig. 2). A sensitivity analysis excluding six participants using continuous positive airway pressure (CPAP) or a mouthpiece for sleep apnea treatment did not materially alter the association between sleep duration and hypertension prevalence (Supplementary Fig. 1).
Fig. 2: Restricted cubic spline analysis of the association between different sleep duration categories and the prevalence of hypertension.
This figure illustrates the restricted cubic spline analysis assessing the relationship between sleep duration and the prevalence of hypertension, after adjusting for demographic, lifestyle, and clinical factors. A shows objectively measured sleep duration (PSGTST), while B and C show subjectively measured sleep duration (AMTST and HABTST, respectively). The solid purple line represents the estimated odds ratio (OR), and the shaded pink area indicates the 95% confidence interval (CI). The horizontal dashed line represents an OR of 1.
Hypertension incidence and sleep durationAfter a follow-up period of 5.25 ± 0.27 years, 376 out of 1001 OSA patients developed hypertension. Table 3 summarizes the relative risks (RR) associated with different sleep duration categories and hypertension incidence.
Table 3 Univariable and multivariable Poisson regression analysis of the association between objective and subjective sleep duration and the incidence of hypertension (with the category of lowest sleep duration as the reference group).For PSGTST, In the unadjusted model, individuals who slept more than five hours had a significantly lower risk of developing hypertension compared to those sleeping less than five hours. Specifically, sleeping 5–6 h was associated with a 23% lower risk (RR: 0.77, 95% CI: 0.58–1.02), 6–7 h with a 33% reduction (RR: 0.67, 95% CI: 0.51–0.89), and more than 7 h with a 34% reduction (RR: 0.66, 95% CI: 0.46–0.94). After adjusting for demographic and lifestyle factors in model 1, the reductions were 19% for 5–6 h (RR: 0.81, 95% CI: 0.6–1.09), 28% for 6–7 h (RR: 0.72, 95% CI: 0.54–0.97), and 28% for > 7 h (RR: 0.72, 95% CI: 0.49–1.05). These risk reductions remained stable across model 2 and 3.
For AMTST, in the unadjusted model, no significant associations were observed across sleep duration categories. Compared to < 5 h, the RRs were 0.79 (95% CI: 0.55–1.13) for 5–6 h, 0.84 (95% CI: 0.61–1.17) for 6–7 h, and 0.78 (95% CI: 0.57–1.08) for > 7 h. These associations remained largely unchanged after adjusting for demographic, clinical, and sleep-related factors in models 1–3.
For HABTST, model 0 showed that sleep durations of 6–7 h (RR = 0.72, 95% CI: 0.54–0.96), 7–8 h (RR = 0.75, 95% CI: 0.58–0.98), and > 8 h (RR = 0.67, 95% CI: 0.46–0.97) were significantly associated with a lower risk of hypertension compared to < 6 h. However, after adjusting for potential confounders in models 1–3, the associations were attenuated.
When using the longest sleep duration category as the reference, individuals with the shortest PSGTST (<5 h) consistently exhibited the highest risk of developing hypertension across all models, despite a reduction in statistical significance after full adjustment (model 3: RR = 1.39, 95% CI: 0.95–2.06). Similar patterns were observed for AMTST and HABTST, where the shortest sleep duration group was associated with an increased risk of developing hypertension (Supplementary Table 2).
The RCS analysis revealed a significant negative linear correlation between PSGTST and hypertension incidence (p for overall = 0.024), with no evidence of nonlinearity (p = 0.466). AMTST and HABTST showed weaker associations with hypertension incidence (p = 0.196 and p = 0.119 for overall, and p = 0.308 and p = 0.786 for nonlinearity, respectively) (Fig. 3). A sensitivity analysis excluding 39 participants who received sleep apnea treatment at baseline and during follow-up did not alter the overall association trends (Supplementary Fig. 2).
Fig. 3: Restricted cubic spline analysis of the association between different sleep duration categories and the incidence of hypertension.
This figure illustrates the restricted cubic spline analysis assessing the relationship between sleep duration and the incidence of hypertension, after adjusting for demographic, lifestyle, and clinical factors. A shows objectively measured sleep duration (PSGTST), while B and C show subjectively measured sleep duration (AMTST and HABTST, respectively). The solid purple line represents the estimated relative risks (RR), and the shaded pink area indicates the 95% confidence interval (CI). The horizontal dashed line represents an RR of 1.
Comments (0)