
Remember me
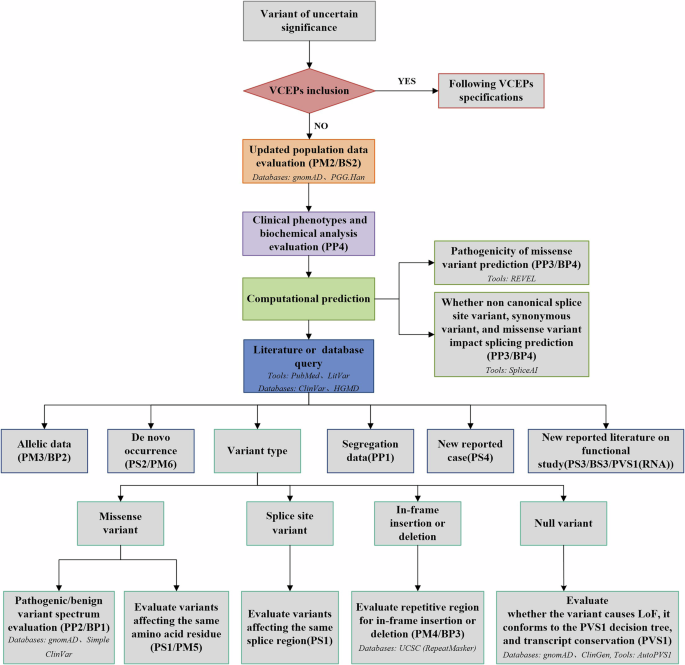

Our investigation into the pathogenic variant profile in exons of the GALNS gene of human MPS IVA fibroblasts and chondrocytes has yielded significant findings. We sequenced 14 exons of the GALNS gene and identified a homozygous c.122T>A (p.Met41Lys) transversion in exon 2 of MPS IVA fibroblasts, indicating a severe phenotype. In MPS IVA chondrocytes, we identified a compound heterozygous variant comprising a 15-bp deletion and a common missense variant, c.1156C>T (p.Arg386Cys), both of which contribute to a severe phenotype.
Enzyme activity in MPS IVA fibroblastsOur study evaluated LVs in HepG2 cells, HEK293 cells, MPS IVA fibroblasts, and chondrocytes. We designed SIN-LVs to drive GALNS gene expression under the control of the CBh, COL2A1, or CD11b promoter. We also used different MOIs, including 5, 10, 15, and 20, to transduce HEK293, HepG2, and MPS IVA fibroblasts. These comparisons guided us to determine the potential MOI conditions as 20 to treat MPS IVA chondrocytes with LVs.
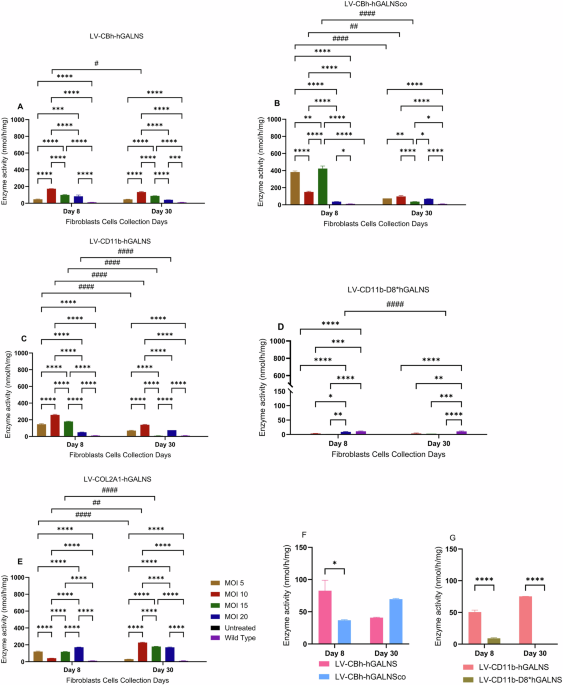
Intracellular and secreted GALNS activity increased in all treated groups compared to untreated MPS IVA and wild-type fibroblasts (Figs. 1 and 2). This study is the first to utilize the COL2A1 promoter to investigate GALNS enzyme production in MPS IVA cell lines in vitro. The COL2A1 promoter demonstrated the highest efficiency and remained stably expressed the GALNS gene over 30 days (170.05 ± 4.5 nmol/h/mg at MOI 20, p < 0.0001), followed by CBh. The GALNS activity driven by the CBh, COL2A1, and CD11b promoters was highest at MOI 10 on day 30 (Fig. 1). The secreted GALNS levels were similar across all MOIs and promoters, except for CD11b-D8*hGALNS, which exhibited the lowest enzyme activity in media. The efficiency of the COL2A1 promoter was also evident in the media, showing the highest secretion level (12 ± 1.0 nmol/h/ml at MOI 20, p < 0.0001) (Fig. 2).
Fig. 1: Intracellular enzyme activity of MPS IVA fibroblasts treated under different MOIs with LVs.
A LV-CBh-hGALNS, B LV-CBh-hGALNSco, C LV-CD11b-hGALNS, D LV-CD11b-D8*hGALNS, E LV-COL2A1-hGALNS. Two-way ANOVA with Sidak’s multiple comparison tests were used to compare MOIs 5, 10, 15, and 20 each day (*<0.05, **<0.005, ***<0.001, ****<0.0001) and two-way ANOVA with the Tukey’s multiple comparison test were used to compare days 8 and 30 (#<0.05, ##<0.005, ###<0.001, ####<0.0001) (n = 3 for CBh, COL2A1, CD11b, CD11b-D8*hGALNS, and CBh-hGALNSco). F A comparison of LV-CBh-hGALNS vs. LV-CBh-hGALNSco at the MOI of 20; two-way ANOVA with Tukey’s multiple comparison test (*<0.05). G A comparison of LV-CD11b-hGALNS vs. LV-CD11b-D8*hGALNS at the MOI 20; two-way ANOVA with the Tukey’s multiple comparison test (****<0.0001)
Fig. 2: Enzyme activity in the culture media of fibroblasts.
The GALNS enzyme activities under each vector were compared to the wild-type level through two-way ANOVA analysis (*<0.05, **<0.005, ***<0.001, ****<0.0001) (n = 4). We have shown the significance of each group under the MOI of 20 over time. Still, other vectors under the MOIs of 5, 10, and 15 showed a significant difference as well (p < 0.05) (data not shown). A LV-CBh-hGALNS, B LV-CBh-hGALNSco, C LV-CD11b-hGALNS, D LV-CD11b-D8*hGALNS, E LV-COL2A1-hGALNS
Enzyme activity in HepG2To assess LV transduction and stable expression in HepG2 cells, we transduced the cells at MOIs of 5, 10, 15, and 20 (Supplementary Fig. S3). On day 30, LV-CBh-hGALNS achieved 313.8 ± 7.3 nmol/h/mg hGALNS activity at MOI 20, significantly higher than untreated cells (9.09 ± 6.8 nmol/h/mg; p = 0.0001). No notable differences were observed among MOIs on day 8 or between MOIs 15 and 20 on day 30.
LV-CBh-hGALNS exhibited significantly higher activity compared to hGALNSco (276.4 ± 11 nmol/h/mg) on day 30 (p < 0.0001). Both LV-CD11b-hGALNS and LV-CD11b-D8*hGALNS displayed peak activity at MOI 20, with enzyme activities of 40.3 ± 2.3 and 97.1 ± 8.4 nmol/h/mg, respectively, on day 30. LV-COL2A1-hGALNS demonstrated stable expression across MOIs, recording 82.5 ± 5.4 on day 8 and 216.3 ± 3.9 nmol/h/mg on day 30. The enzyme activity of native hGALNS was similar to that of LV-CBh-hGALNSco on both days. This study concludes that GALNS activity in HepG2 cells increased in a dose- and promoter-dependent manner, highlighting the importance of promoter selection for future research. Both LV-COL2A1-hGALNS and LV-CBh-hGALNS maintained robust expression, suggesting promise for therapeutic applications.
Regarding secreted enzyme levels, all transduced HepG2 cells secreted hGALNS enzymes at varying levels; however, LV-CD11b-hGALNS and LV-CD11b-D8*hGALNS lost expression over time (Supplementary Fig. S4). Media enzyme activities in untreated HepG2 were 0.7 ± 0.09 on day 8 and 0.9 ± 0.005 nmol/h/ml on day 30. LV-CBh-hGALNS exhibited increased activity across MOIs, while LV-COL2A1-hGALNS showed consistent activity, with no significant differences across various MOIs. Overall, GALNS activity in the media appeared consistent despite varying MOIs.
Enzyme activity in HEK293The intracellular GALNS activity in HEK293 cells was confirmed using LVs, showing varying expression levels over time (Supplementary Fig. S5). Untreated cells had an activity of 1.26 ± 0.33 nmol/h/mg. Among the vectors, LV-CBh-hGALNS, LV-COL2A1-hGALNS, and LV-CBh-hGALNSco demonstrated higher expression than CD11-related LVs, particularly at MOI 20. At this MOI, LV-CBh-hGALNS reached 37.4 ± 2.4 nmol/h/mg on day 8 and 91.6 ± 4.9 nmol/h/mg on day 30, while LV-COL2A1-hGALNS exhibited the highest expression at 193.6 ± 26.9 nmol/h/mg on day 30.
Secreted enzyme levels also varied among treatment groups (Supplementary Fig. S6). For instance, LV-CBh-hGALNS media activity was 0.71 ± 0.1 and 3.6 ± 3.5 nmol/h/ml at MOI 5, and 0.1 ± 0.09 and 2.8 ± 0.3 at MOI 20. Enzyme activities from LV-CD11b-hGALNS and LV-CD11b-D8*hGALNS were consistently low across MOIs. In conclusion, LV under the CBh promoter achieved higher GALNS expression in HEK293 culture media than wild-type controls; however, the activity was lower than that observed in MPS IVA fibroblasts and HepG2 cells.
Enzyme activity in MPS IVA chondrocytesWe transduced MPS IVA chondrocytes with various LVs at MOI 20 and monitored enzyme activity over 21 days in alginate beads. On day 21, we assessed intracellular and extracellular enzyme activities, GAG levels and VCNs (Figs. 3, 4 and 5). All LVs increased hGALNS enzyme expression, with LV-COL2A1-hGALNS showing the highest activity (1.5 ± 0.1 nmol/h/mg) and LV-CBh-hGALNSco the lowest (0.2 ± 0.09 nmol/h/mg).
Fig. 3: Therapeutic efficacy of LVs in MPS IVA chondrocytes treated with different LVs at the MOI of 20.
A Intracellular enzyme activity. B Media enzyme activity. (*<0.05, ***<0.001, ****<0.0001; ###<0.001). No statistical significance among the groups was detected in the media
Fig. 4: GAG levels in MPS IVA fibroblasts and chondrocytes at MOI 20.
A, B Mono-sulfated KS levels of MPS IVA fibroblasts on day 30 and chondrocytes on day 21 after administering LVs. C Chondroitin disaccharide (Di6S) levels in MPS IVA chondrocytes. Comparison of untreated vs. treated groups, wild-type vs. treated groups (*<0.05, **<0.005, ***<0.001, ****<0.0001), and day 8 vs. day 30 (##<0.005) was made according to two-way ANOVA with Tukey multiple comparison test
Fig. 5: Vector copy numbers at MOIs of 5, 10, 15, and 20.
A MPS IVA fibroblasts. B HEK293, C HepG2 cells. D MPS IVA chondrocytes. Statistical methods were two-way ANOVA tests with Tukey multiple comparisons. Compared to untreated, copy numbers in all treated groups significantly increased in all three cell lines (*<0.05, **<0.005, ***<0.001, ****<0.0001) (n = 3)
Compared to healthy controls (0.4 ± 0.02 nmol/h/mg), MPS IVA chondrocytes exhibited up to 3.5-fold increase in the GALNS enzyme activity via LV-COL2A1-hGALNS, which was statistically significant compared to the wild-type group. LV-CD11b and LV-CBh showed a nearly 1.5-fold increase; however, there was no significant difference between the wild-type and all treated groups.
GAG levels of MPS IVA fibroblasts and chondrocytes following lentiviral gene therapyTo evaluate whether the accumulated GAG levels decreased following LV treatments at MOI 20, MPS IVA fibroblasts were harvested on days 8 and 30. GAGs were isolated and analyzed using LC-MS/MS, focusing on KS, heparan sulfate, and dermatan sulfate. The results showed that LV gene therapy significantly reduced mono-sulfated KS levels compared to untreated cells (25.9 ± 1.6 ng/mg), with treatment-specific levels reported for days 8 and 30 (Fig. 4A). Treatments with LV-CBh-hGALNS and LV-CD11b-D8*hGALNS exhibited significant reductions in KS levels on day 30 (p < 0.005). We also analyzed the GAGs DiHS0S, DiHSNS, Di4S, and DiSKS in MPS IVA fibroblasts (Supplementary Fig. S7).
We also measured mono-sulfated KS and chondroitin disaccharide (Di6S) levels in MPS IVA chondrocytes (Fig. 4B-C). LV-COL2A1-hGALNS significantly reduced mono-sulfated KS (82.7 ± 0.3 ng/mg) compared to untreated chondrocytes (132.3 ± 0.04 ng/mg). The KS levels for each LV treatment were as follows: 119.4 ± 1.4 (CBh-hGALNS), 136 ± 0.9 (CBh-hGALNSco), 114.8 ± 0.8 (CD11b-hGALNS), 99.03 ± 0.02 (CD11b-D8*hGALNS), and 82.7 ± 0.3 ng/mg (COL2A1-hGALNS) (Wild-type level: 74.4 ± 0.1 ng/mg).
Vector copy numbersTo assess LV copy numbers, the LV-specific psi gene was analyzed via ddPCR in MPS IVA fibroblasts, HEK293, and HepG2 cells at varying MOIs (5, 10, 15, and 20) on day 30. Consistent VCNs were observed across different treatments and MOIs in MPS IVA fibroblasts (Fig. 5A). At MOI 20, the following VCNs were recorded: 4.6 ± 0.005 for LV-CBh-hGALNS and 3.5 ± 0.01 for LV-COL2A1-hGALNS and LV-CD11b-D8*hGALNS.
HEK293 cells had lower LV copies than MPS IVA fibroblasts and HepG2, except for LV-CD11b-hGALNS and LV-CD11b-D8*hGALNS, which exhibited the highest number of copies (11.6 ± 0.1 and 10.5 ± 0.04 at MOI 20, respectively) (Fig. 5B). HepG2 cells showed the highest VCN of 12.3 at MOI 15 with LV-CD11b-hGALNS (Fig. 5C). In MPS IVA chondrocytes, LV-COL2A1-hGALNS achieved the highest enzyme activity despite a lower VCN compared to other vectors (Fig. 5D).
These findings indicate that LV gene therapy effectively reduces GAG accumulation in MPS IVA fibroblasts and chondrocytes while achieving stable VCNs, supporting its potential for therapeutic applications.
Lysosomal massFlow cytometry analysis was performed on day 30 to confirm the reduction of lysosomal GAG. Following a 3.3-fold difference between wild-type and untreated MPS IVA fibroblasts, we found that all LV treatments significantly reduced the lysosomal mass on day 30. Moreover, LV-CD11b-hGALNS (p = 0.1909) and LV-COL2A1-hGALNS (p = 0.0925) were indistinguishable from WT levels, suggesting that those vectors contributed to lysosomal mass normalization by day 30 (Supplementary Fig. S8).
Uptake of GALNSTo evaluate the uptake of the GALNS enzyme after secretion, we transferred culture media from LV-transduced MPS IVA fibroblasts to untreated MPS IVA fibroblasts and measured enzyme activity before and after the transfer. After a 13-h incubation with the secreted hGALNS enzyme, cells were harvested to assess their enzyme activity.
Before uptake treatment, enzyme activities in the media were ~0.75, 0.41, 1.92, 1.34, and 0.011 nmol/h/ml for LV-CBh-hGALNS, LV-CBh-hGALNSco, LV-COL2A1-hGALNS, LV-CD11b-hGALNS, and LV-CD11b-D8*hGALNS, respectively, at a MOI of 20. After the uptake experiment, the activities decreased to approximately 0.17, 0.27, 1.4, 0.85, and 0.00 nmol/h/ml, respectively. The uptake percentages of GALNS enzyme were 76.9%, 34.07%, 28.1%, and 36.3% for LV-CBh-hGALNS, LV-CBh-hGALNSco, LV-COL2A1-hGALNS, and LV-CD11b-hGALNS, respectively. Notably, LV-CD11b-D8*hGALNS showed an initial increase, but no enzyme activity was detected post-experiment (Supplementary Fig. S9A).
Although we analyzed GALNS enzyme activity in the media before and after treatment, we should also consider that GALNS enzymes have a short half-life, which may lead to reduced enzyme activity in the media as well as decreased intracellular uptake.
Intracellular activities were measured at 1.31 ± 0.8, 0.94 ± 0.5, 2.27 ± 0.3, and 2.24 ± 0.7 nmol/h/mg for the various treatments. Cells incubated with culture media containing the secreted GALNS enzyme exhibited increased enzyme activity compared to untreated MPS IVA fibroblasts (Supplementary Fig. S9B). In M6P-dependent assays, enzyme activity was undetectable due to inhibition of the M6P receptor by M6P ligands, indicating that hGALNS enzymes were taken up via M6P receptors.
ImmunohistochemistryWe conducted immunohistochemistry (IHC) to verify GALNS enzyme production. Groups treated with LVs showed intense staining with monoclonal anti-GALNS antibodies compared to untreated and wild-type MPS IVA fibroblasts (p < 0.0001 for both vectors). No significant differences were observed between groups treated with LV-CD11b-hGALNS, LV-CBh-hGALNS, and LV-COL2A1-hGALNS compared to untreated controls. Additionally, we analyzed keratan sulfate (KS) levels through IHC, revealing a significant reduction in KS GAG following LV gene therapy (p < 0.05). The anti-KS IHC results aligned with KS levels measured by LC-MS/MS (Supplementary Figs. S10-11).
Cell viabilityTo evaluate the impact of increasing MOI on cell viability, we transduced MPS IVA fibroblasts with LVs at MOIs of 5, 10, 15, and 20. Most experiments showed no significant adverse effects; however, cell viability was notably affected at MOIs of 5 and 15 with LV-COL2A1-hGALNS, and at MOIs of 10 and 20 with LV-CD11b-hGALNS. No toxicity was observed for LV-CD11b-D8*hGALNS compared to untransduced cells. Overall, we did not observe a dose-dependent cellular response or a critical reduction in cell viability following viral transduction (Supplementary Fig. S12-13).
EGFP expression in MPS IVA fibroblastsWe screened LV-transduced MPS IVA fibroblasts under optimal conditions using immunofluorescence imaging. LV-CBh-EGFP showed the highest expression 48 h post-transduction; however, cells transduced with this vector died over time, and no live cells were present by day 8. In contrast, we observed a stable EGFP gene expression under the CD11b and COL2A1 promoters in both time points. Significantly, the expression of the EGFP gene increased over time (Fig. 6).
Fig. 6: Immunofluorescence screening of EGFP fluorescence in MPS IVA fibroblasts at the increasing MOIs (5, 10, 15, and 20).
A Following transduction with LV-CBh-EGFP, LV-CD11b-EGFP, and LV-COL2A1-EGFP, MPS IVA fibroblasts were tracked for the EGFP gene expression at a total magnification of 100X and 200X, 48 h and 8 days post-transduction (Scale is set to 250 μm). B Corrected total cell fluorescence in 48 h post-transduction. C Corrected total cell fluorescence in 8 days post-transduction. (au: arbitrary unit)
To evaluate transduction efficiency, we analyzed EGFP protein intensity using flow cytometry on day 30. LV-CBh-EGFP did not persist, likely due to EGFP toxicity. However, LV-CD11b-EGFP and LV-COL2A1-EGFP maintained over 75% EGFP intensity across all MOIs. The COL2A1 promoter demonstrated high and stable transgene expression over time (Supplementary Fig. S14). These results provide key insights into the transduction efficiency, importance of MOIs and promoters of LVs, and duration of protein synthesis in MPS IVA fibroblasts.
Comments (0)