Chemicals
Bedaquiline fumarate is provided as a gift sample from Mylan Laboratories Ltd. FDF- R&D Center, Bollaram, India. Ascorbic acid and acetonitrile were purchased from Loba Chemicals and Research Lab Fine Chem, Mumbai. All the chemicals were of commercial grade.
Instruments
Scanning electron microscope (JEOL, EO) instrument (JSM-6360 Japan) and photomicrographs were used to capture images. Fourier transform infrared spectroscopy (FTIR) (Bruker model and Opus software, Germany) was used to obtain the information regarding functional groups. X-ray diffractometer (Goniometer: Ultima) was used to monitor the powder X-ray diffraction patterns (XRD). UV spectrometry (V-630 Jasco Japan model) was used to obtain information regarding conjugations. Thermograms of the co-crystal and pure BDQ were acquired from Mettlter Toledo, DSC. Using a USP Type II apparatus, the dissolution of a tablet containing BDQ-AA Co-crystals was investigated. Autodock vina software was used for docking.
Preparation of Co-crystalsSolvent evaporation
The co-crystals of BDQ-AA were obtained using the slow solvent evaporation method. BDQ and AA (1:2 molar ratio) were weighed and dissolved in acetonitrile, BDQ (126 mg) and AA (212 mg). The resultant solution was constantly stirred for 30 min. To remove interference of any impurity during this process, the solution was then filtered through a filter paper (0.45 µm) and allowed to stand for 24 h to complete the process of crystal formation. Fine co-crystals were collected, dried, and kept for four hours at room temperature in a desiccator [12].
Characterization of Co-crystalsScanning electron microscopy (SEM)
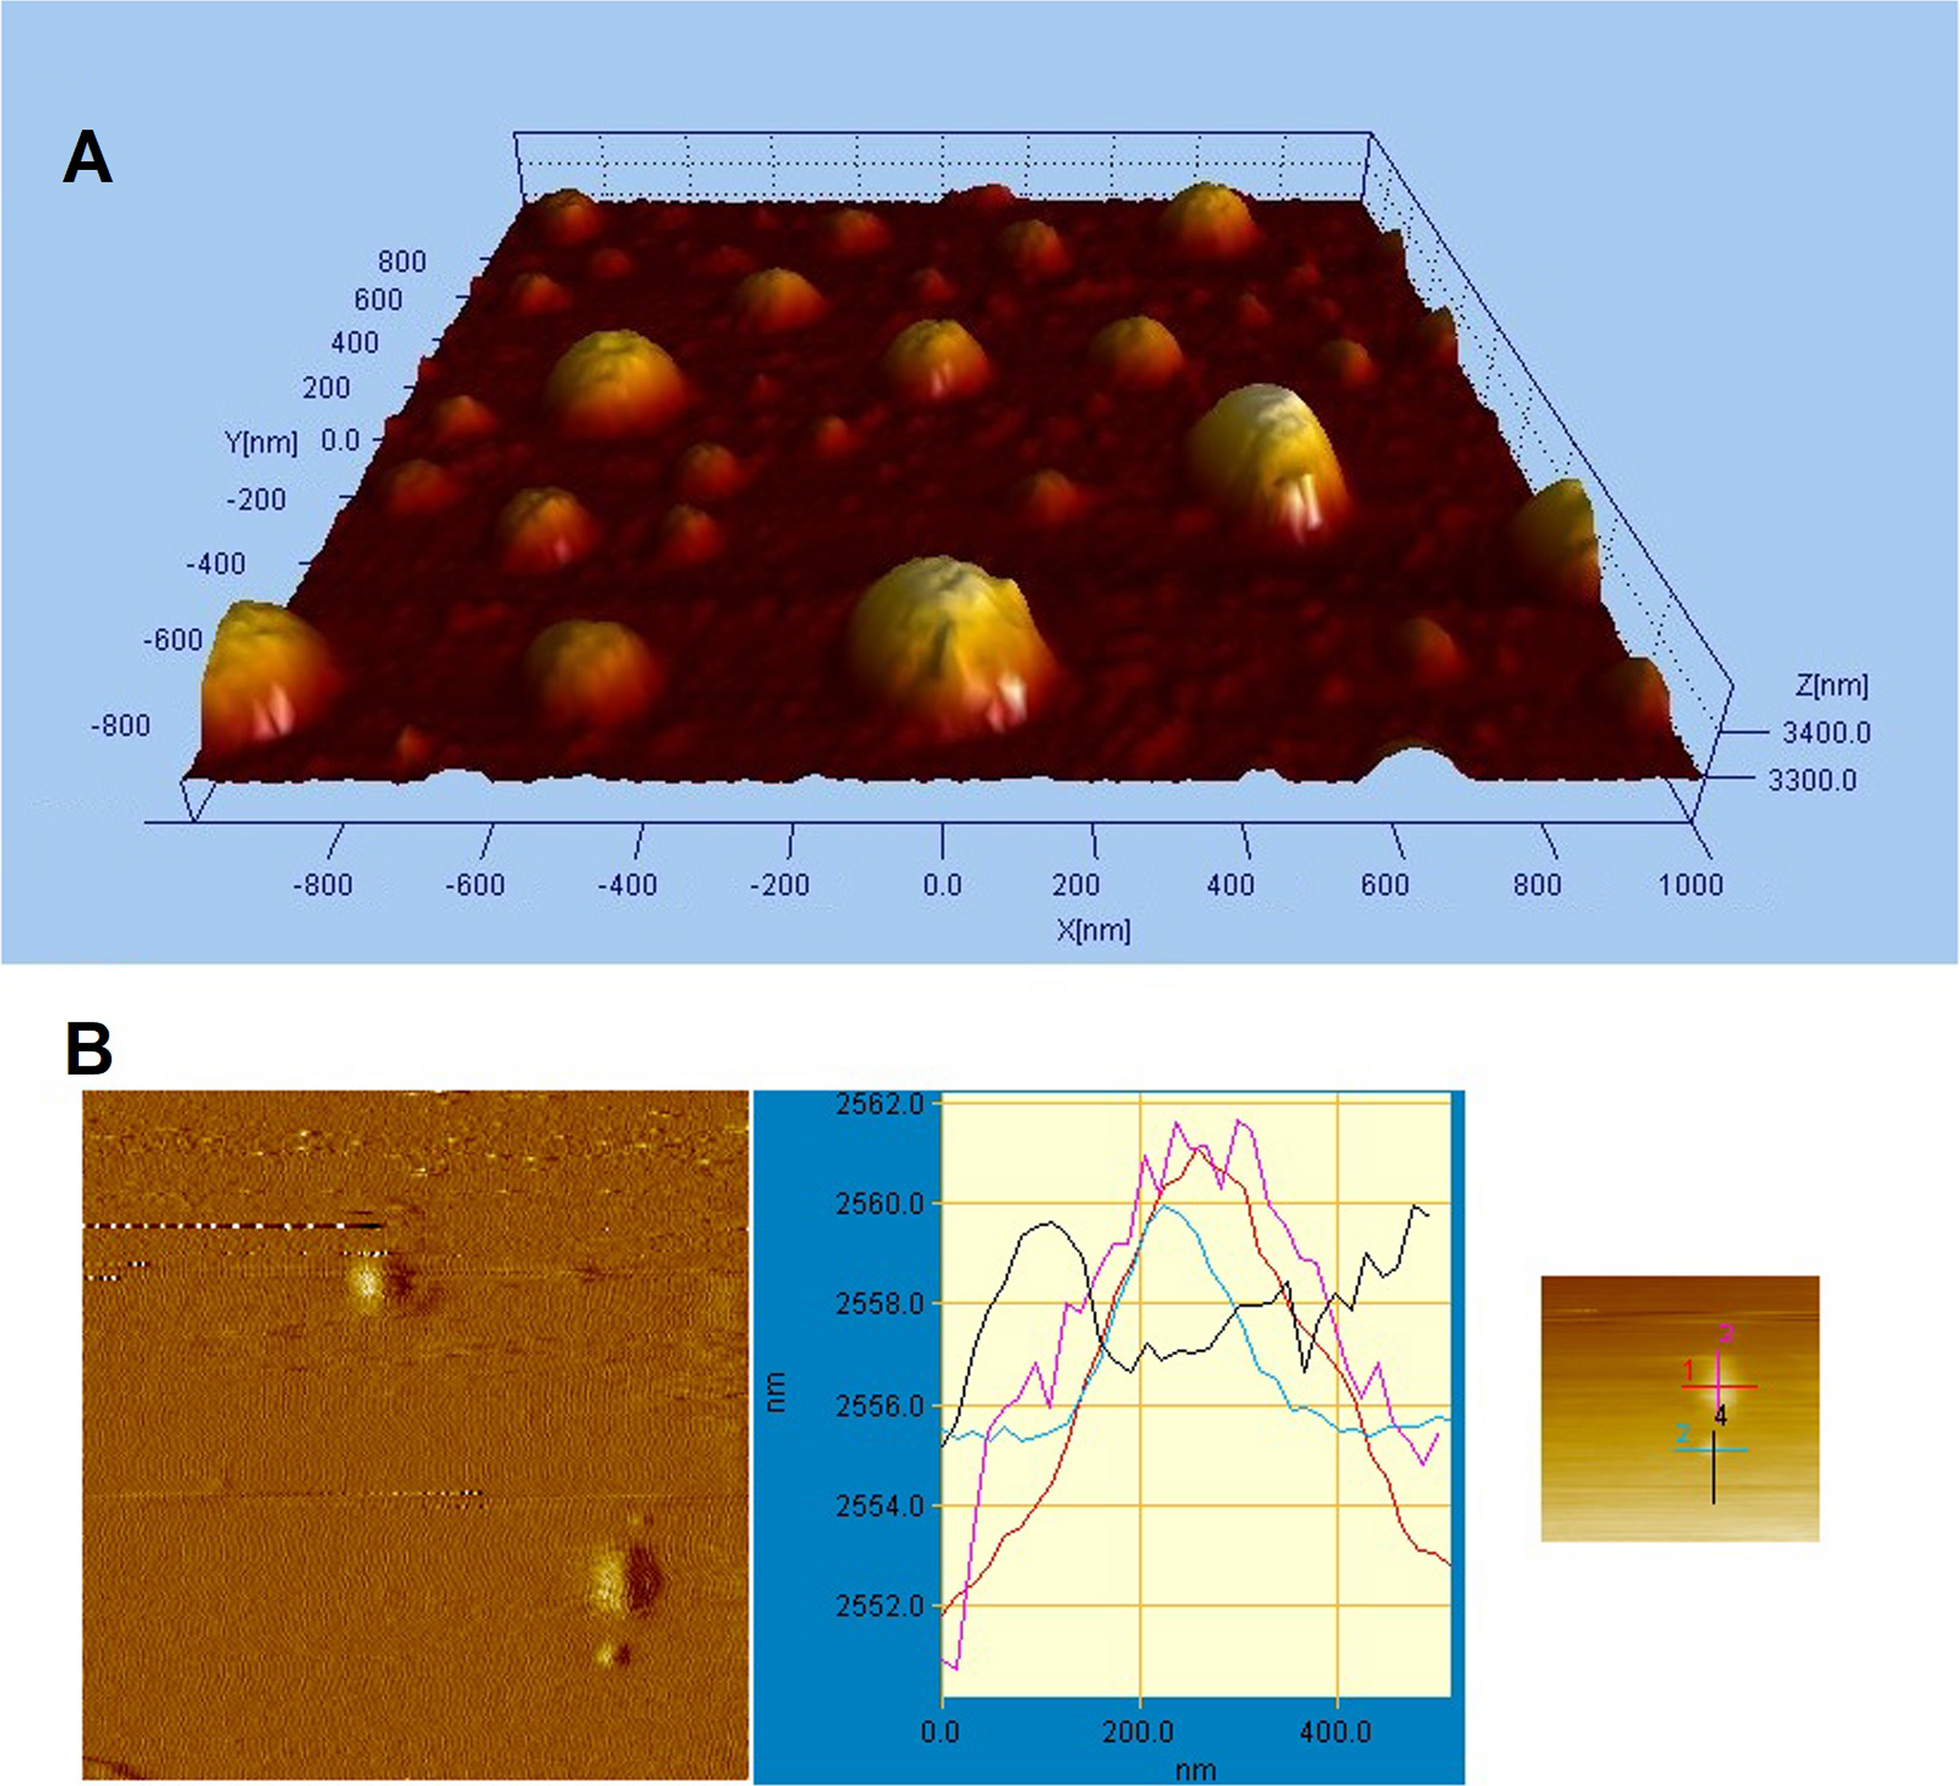
Scanning electron microscope (JEOL, EO) instrument (JSM-6360 Japan) and photomicrographs were used to capture pure BDQ, AA, and BDQ-AA co-crystal. SEM was used to assess the sample’s surface morphology. Before scanning, the samples underwent vacuum sputter coating with gold and were subjected to a 20-kV acceleration voltage [13, 14].
Fourier transform infrared spectroscopy [FTIR]
FTIR (Bruker model and Opus software, Germany) was used to obtain the information regarding functional groups of pure BDQ, AA, and BDQ-AA. After the sample was put in the sample holder, spectra in the 4000–400 cm−1 range were recorded. FTIR studies are typically conducted to examine the relationship between the drug and co-former [13, 14].
Powder X-ray diffraction (PXRD)
Using copper as the X-ray target, an X-ray diffractometer (Goniometer: Ultima) was used to monitor the powder XRD of the bulk BDQ, AA, and BDQ-AA. The scan speed was set to 10.0000 deg/min. The samples were examined between the range: of 5.000- > 80.0000 °C. [13, 14].
UV spectrometric methods
UV spectrometry (V-630 Jasco Japan model) was used to obtain information regarding conjugations present in the drug in its pure form as well as co-crystal. A cuvette spectrum range of 200–400 nm was set. In general, UV studies are conducted to examine the BDQ, AA, and BDQ-AA interaction (Tables 1, 2 and 3).
Table 1 Melting point of BDQ, AA, and BDQ-AATable 2 Conformer screen data by molecular dockingTable 3 DSC test result of a. BDQ b. AA c. BDQ-AADifferential scanning calorimetry
Thermograms of the co-crystal and pure BDQ were acquired from Mettler Toledo, DSC. In a closed aluminum pan, the phase transition of BDQ, AA, and BDQ-AA was examined. The samples were placed inside a sealed aluminum crucible and heated to 190 °C (10 °C /min) in a nitrogen atmosphere (40 ml/min). Heat of fusion, melting point, and precise peak temperature were all automatically calculated.
Solubility study of BDQ
An excess of pure BDQ was dissolved in distilled water in a 10-ml volumetric flask. Using a magnetic stirrer with a hot plate and 70 rpm was set, the samples were stirred for 24 h at 37 ± 0.5 °C. After passing the mixture through the Whatman filter paper, the amount of drug dissolved was checked using UV spectroscopy at a wavelength of 285 nm. [15]. Data indicated in Table 4.
Table 4 Solubility study of BDQ, & BDQ-AAMicromeritic study
The bulk density, tapped density, Carr’s Index, Hausner’s ratio, angle of repose, and other flow characteristics of pure BDQ, AA, and BDQ-AA co-crystals were measured. While Carr’s Index and Hausner’s ratio were computed using the bulk and tapped densities, the angle of repose was ascertained using the fixed funnel method. It was assumed that the ratio of tapped density to bulk density was Hausner’s ratio. Using the provided equation, Carr’s Index was computed [20]. Data indicated in Table 5.
Table 5 Micromeritic study of a BDQ, & BDQ-AAThe angle of repose
The angle of repose describes the properties of the powder flow. This trait has to do with resistance to particle movement or interparticle friction. The surface of a pile of powder or granules and the horizontal plane can only be at this maximum angle.
$$\emptyset = \, \tan^ h/r$$
Hausner’s ratio and compressibility index
These days, it’s easy, time-saving, and common to predict powder flow characteristics using the compressibility index and the closely related Hausner’s ratio. The compressibility index can be influenced by various parameters such as size, shape, cohesiveness, moisture content, and bulk density, so it has been suggested to use this as an indirect indicator of these characteristics. Measurements of a powder’s bulk density and tapped density are used to compute the compressibility index and Hausner’s ratio. [20].
Dissolution studies:
Using a USP Type II apparatus, the dissolution of a tablet containing BDQ, AA, and BDQ-AA was investigated. 900 ml of dissolution media was used for the dissolution study, and the temperature was kept at 37 ± 0.5 °C at 50 rpm. 1 ml of the sample was taken out, and a new dissolution medium was added after the allotted amount of time had passed. After appropriate dilution, the resultant sample was examined and absorbance was recorded at 285 nm using a UV spectrometer.
Evaluation parameters of tabletsPhysical appearance
The measurement of size, form, color, taste, odor, and other parameters goes into controlling overall appearance. Controlling lot-to-lot, tablet-to-tablet uniformity, and consumer acceptance all depend on a tablet’s overall appearance, identity, and general elegance. Data is indicated in Table 6.
Table 6 Evaluation parameters of Tablets BDQ, & BDQ-AADisintegration test
According to BP, it is important to check the disintegration time of the intermediate-release tablet. Put 6 tablets into each tube and hang the apparatus over a beaker of 60 ml of water to maintain a temp. at 37 °C. A disk could be added if the tablets float on the water’s surface. Run the machine for half an hour. Remove the assembly from the liquid. The tablet passes the test if there is no longer any residue visible on the device screen [21].
Weight variation test
Calculated the average weight by weighing each of the 20 tablets separately. The range for an individual’s weight is 90–110% of the average weight. If some tablets exceed the limit, once more, weigh each of the twenty tablets separately. Using a little brush, take out each tablet’s net content. Weigh each empty shell separately. Weight of shell—gross weight equals net weight of contents separately. Compute the average net content by adding each tablet’s net weight. Next, ascertain the variations between each net content and the mean net content.
Hardness test
The tablet’s crushing strength is another name for its hardness. The compressive force necessary to shatter the tablet when applied diametrically can be used to determine the hardness of the tablet. The tablet must be sufficiently sturdy to withstand breaking during usage, storage, or transit. A tablet’s hardness affects how quickly it disintegrates and is more crucial in regulating how quickly the medicine is released from the tablet [22].
Friability Test
A tablet’s capacity to withstand shock and abrasion during production, packaging, shipping, and finally use is referred to as friability. Together with hardness, friability indicates the tablet’s strength. It is ascertained by using friability.
In vitro permeability study
It was determined that the small intestine contained the jejunum. The piece was separated and washed carefully in a Petri dish filled with Tyrode’s solution. Using a glass rod, the cleansed intestine was carefully everted, and the jejunum portion of 3 cm was used. To create a gut sac, one end was tightly tied with thread, and the other end had a dissected butterfly needle inserted and secured. Through this, a 2 ml solution was injected into the intestinal sac. The inverted intestinal sac was incubated in 50 ml (the predetermined volume) of the experimental test solution at time zero. The test mixture was kept, continuously aerated at 37 °C. The sample solution (0.5 ml) was taken out of the sac and diluted up to 5 ml to carry out the UV Spectrophotometric analysis at the proper periods of 0, 15, 30, 60, 120, & 240 min. Every time the sampling was done at the appropriate intervals, the gut sac’s capacity was kept constant at 2 ml [16].


Comments (0)