
Remember me

Among the 830 individuals who had at least one measurement of Lp(a) at our institute, 64.7% were women. The median value was 14.7 mg/dL (6.0-40.8). The Lp(a) values were not normally distributed as shown in (Supplementary Fig. 1A) and (Supplementary Fig. 1B).
Elevated Lp(a) concentrations, defined as > 50 mg/dL (> 125 nmol/L), were observed in 21.6% of the population, while Lp(a) concentrations > 180 mg/dL (> 430 nmol/L) were found in 2.2% of the individuals. Nearly half (48%) of the individuals had primary dyslipidaemia and 74.9% of the individuals were receiving lipid-lowering therapy (LLT). The clinical characteristics of the study population are summarized in (Table 1).
Table 1 Clinical characteristics of the study populationAccording to cardiovascular risk categories defined by European guidelines [37] we observed an elevated Lp(a) > 50 mg/dL (> 125nmol/L) in 35.4% of individuals with high cardiovascular risk, 23% of those at moderate risk and 17% of those at low risk.
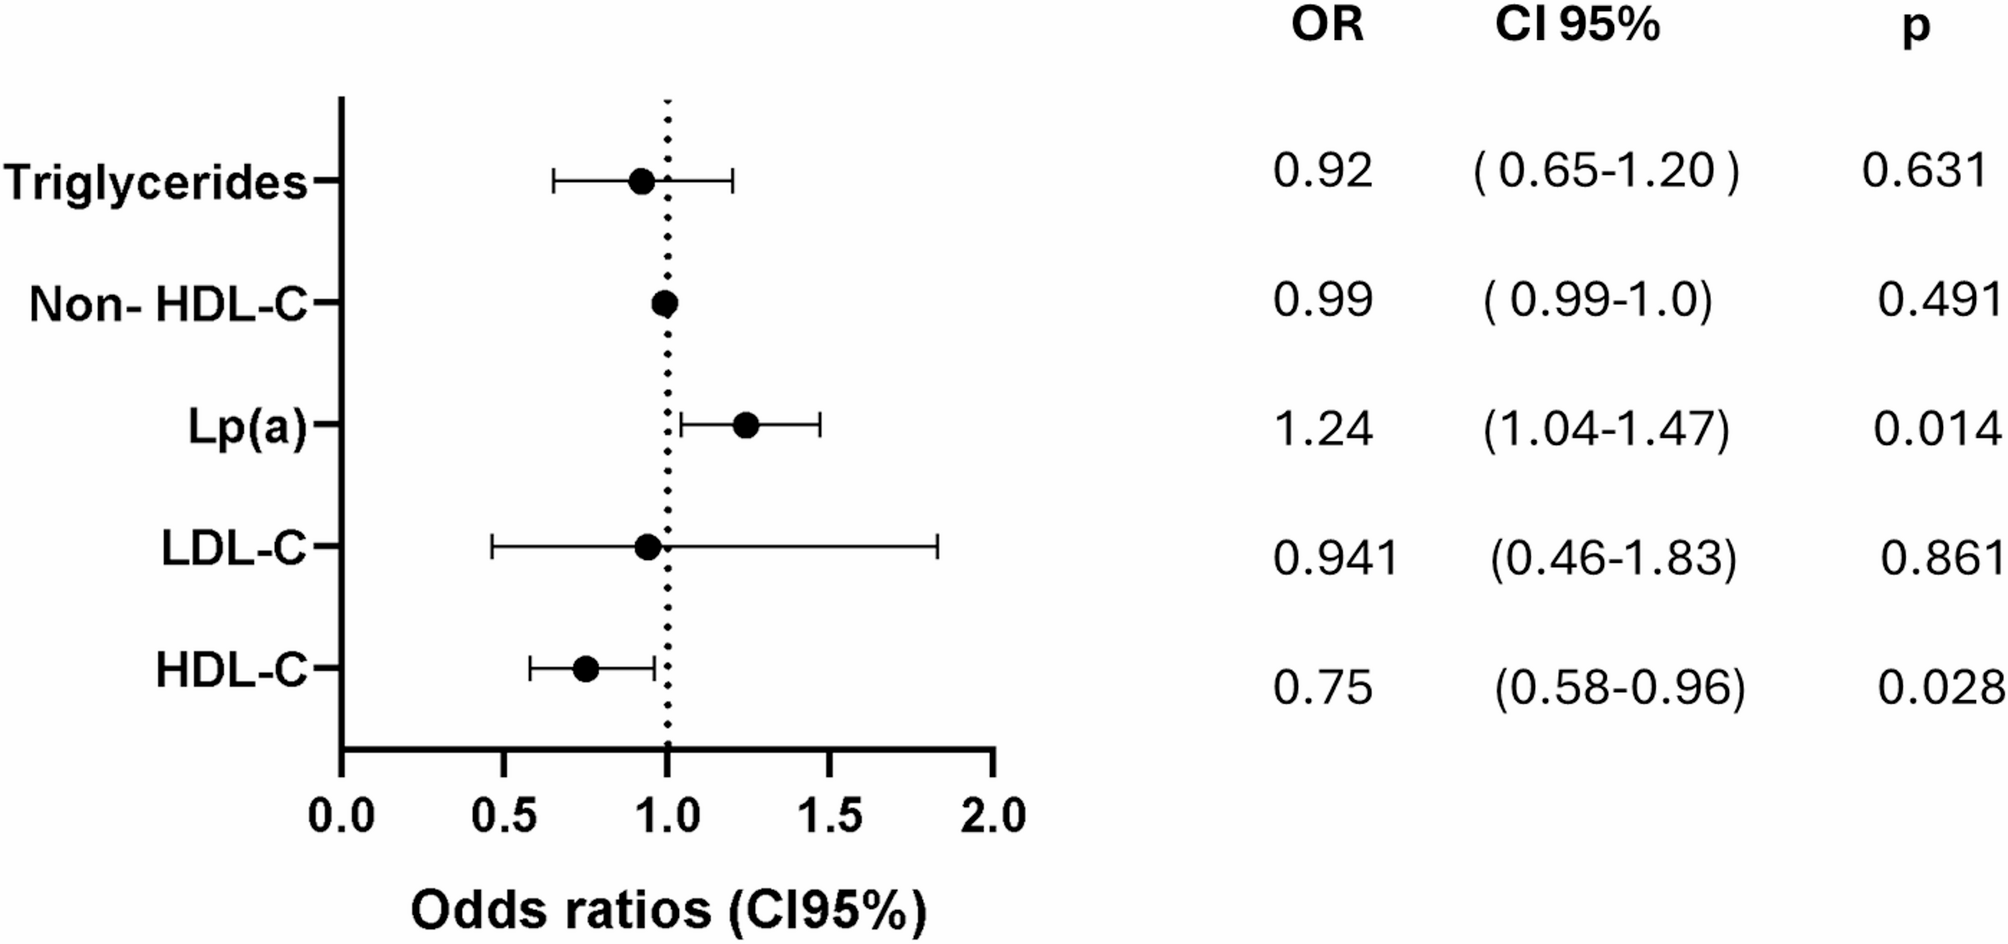
Notably, among individuals who achieved the LDL-C target, according to their initial cardiovascular risk category, Lp(a) still emerged as the principal determinant of ASCVD in our cohort, with an OR of 1.23 (95% CI: 1.04 to 1.48, p = 0.012). In contrast, non-HDL-C was not significantly associated (OR: 0.99, 95% CI: 0.99 to 1.00, p = 0.491), while HDL-C showed a protective association (OR: 0.75, 95% CI: 0.58 to 0.96, p = 0.028) (Fig. 1).
Fig. 1
Lp(a) is the main cardiovascular risk factor for ASCVD despite LDL-C on target. C: cholesterol; HDL: high-density lipoprotein; LDL: low-density lipoprotein; Lp: lipoprotein
Adjusting by age, sex, BMI, diabetes, hypertension and smoking index.
Non-genetic factors influencing Lp(a) concentrations in the study cohortIn the entire cohort, inflammatory diseases were present in 4.84% of individuals, and 0.8% had a history of liver transplantation. Chronic kidney disease was present in 0.7% of the patients. Hypothyroidism was observed in 32.8% of the total population, while hyperthyroidism was found in 0.7%. Among female participants, 46.4% were postmenopausal, with only 1.4% receiving hormone replacement therapy.
The prevalence of non-genetic factors in individuals with Lp(a) < 50 mg/dL (< 125 nmol/L) compared to those with L (a) > 50 mg/dL (> 125nmol/L) is presented in (Table 2). Hypothyroidism was more frequent in individuals with Lp(a) < 50 mg/dL (< 125nmol/L) (p < 0.005). However, no significant difference was observed in the prevalence of uncontrolled hypothyroidism between the groups.
Table 2 Non-genetic factors according to risk Lp(a) concentrationClinical and biochemical characteristics of individuals with extremely high concentrations of Lp(a)The clinical and biochemical characteristics of this group are described in (Table 3). The prevalence of ASCVD in individuals with Lp(a) concentrations > 180 mg/dL (> 430 nmol/L) was 23%. Heart failure was observed in 40% while aortic valve stenosis was present in 16.7% of the study cohort.
Table 3 Characteristics of the individuals with Lp(a) concentration > 180 mg/dl (> 430 nmol/L)Clinical and biochemical characteristics of individuals with Lp(a) > 50 mg/dL (> 125nmol/L) compared to individuals with Lp(a) < 50 mg/dL (< 125nmol/L)When we compared individuals with Lp(a) concentrations > 50 mg/dL (> 125nmol/L) to those with Lp(a) concentrations < 50 mg/dL (< 125 nmol/L), 60.9% were women, a higher proportion were older (p = 0.009) and had a higher prevalence of ASCVD (p < 0.001), predominantly coronary heart disease (Table 4). Furthermore, the prevalence of primary dyslipidaemias was higher in this group, with FCHL being the most common (30.7%), followed by FH (20.7%, p < 0.001) and FHTG (1.7%) (Table 4). There were no statistical differences between individuals with or without elevated Lp(a) in terms of the prevalence of hypertension, diabetes, prediabetes, obesity, overweight or the use of LLT. (Table 4).
Table 4 Cardiovascular risk factors and atherosclerotic cardiovascular disease according to risk Lp(a) concentrationAdvanced fibrosis was detected in 2.3% of individuals with Lp (a) > 50 mg/dL (> 125 nmol/L) based on the FIB-4 score [32] and in 8.6% based on the NAFLD fibrosis score [33], with no statistically significant differences compared to individuals with Lp(a) < 50 mg/dL (< 125 nmol/L).
Factors associated with Lp(a) > 50 mg/dL (> 125 nmol/L) were shown in (Fig. 2). The correlations between Lp(a) and additional factors are shown in (Supplementary Fig. 2).
Fig. 2
Factors associated with Lp(a) concentrations > 50 mg/dL (> 125nmol/L). ASCVD: atherosclerotic cardiovascular disease; BMI: body mass index; FH: Familial Hypercholesterolemia
The lipid profile of individuals with Lp (a) concentrations > 50 mg/dL (> 125 nmol/L) compared to those with Lp(a) < 50 mg/dL (< 125nmol/L) is described in (Table 5). Individuals with Lp(a) < 50 mg/dL (< 125 nmol/L) had higher levels of remnant cholesterol (RC) (p = 0.041) and triglycerides (p = 0.007), as well as lower levels of HDL-C (p = 0.009).
Table 5 Lipid profile and HbA1c in individuals at the time of the Lp(a) measurement according to risk Lp(a) concentrationClinical profile of individuals in the “gray zone” (Lp(a) 30–50 mg/dL)(75-125nmol/L)Individuals in the “Gray zone” (Lp(a) concentrations in 30–50 mg /dL (75–125 nmol/L), had a high prevalence of comorbidities such as prediabetes, diabetes, obesity, hypertension, impaired renal function, smokers, and inflammatory diseases. In addition, 11.9% of individuals in this group had documented ASCVD. (Supplementary Table 1).
Association between low Lp(a) concentrations and type 2 diabetes (T2D)When we compared individuals with low Lp(a) concentrations < 4 mg/dL (< 10 nmol/L) (n = 136) to those with Lp(a) > 4 mg/dL (> 10 nmol/L) (n = 694), the prevalence of diabetes was significantly higher in the former group (51.5% vs. 33.4%, p < 0.001) (Supplementary Fig. 3).
Factors associated with diabetes included Lp(a) < 4 mg/dL with odds ratio (OR) of 2.10 (95% confidence interval (CI): 1.44 to 3.08), p < 0.001 and remnant cholesterol (RC) with OR 1.30 (95% CI: 1.11 to 1.54), p < 0.001 (Fig. 3).
Fig. 3
Lower concentrations of Lp(a) are associated to increased risk of diabetes. BMI: body mass index; RC: remnant cholesterol; Lp: lipoprotein. Lp(a) < 4 mg/dL(< 10 nmol/L)
Physician actions based on Lp(a) risk concentrationsOnly 26% of the individuals with Lp(a) > 50 mg/dL (> 125 nmol/L) had intensified their treatment based on their comorbidities (Supplementary Fig. 4). Physicians referred only 34% of these patients for additional investigations to evaluate subclinical cardiovascular risk. Evidence of atherosclerotic involvement was found in 32.7% of the individuals without prior ASCVD and in the 73.9% of individuals with documented ASCVD. The most common condition observed was heart failure (16%), followed by carotid plaque detected through doppler ultrasound (12%), aortic valve stenosis detected by echocardiogram (8%) and coronary heart disease detected by both, echocardiogram and coronary angiotomography (6.7%) In addition, peripheral arterial disease was detected by lower limb angiotomography in 4% of cases.
The most frequently requested diagnosis methods included coronary angiotomography with calcium score (5%), echocardiogram (35.2%), and carotid doppler ultrasound (7.9%).
Despite 81% of them were receiving LLT, only 27.9% were on high-intensity statins (HIS), and just 25.1% were on dual therapy (statin + ezetimibe or statin + PCSK9 inhibitor); just 1 individual received triple therapy (statin + ezetimibe + PCSK9 inhibitor) (Table 4). Following Lp(a) measurement, there was a decrease in the proportion of individuals without treatment (14% vs. 9.5%, p < 0.001) and an increase in dual therapy use (from 25 to 31.8%, p < 0.001) (Supplementary Fig. 5).
Among individuals with Lp(a) levels > 50 mg/dL (> 125nmol/L), few reached their treatment lipid goals according to their specific cardiovascular risk category [35]. Only 26.7% reached LDL-C goals, 33% achieved non-HDL-C targets, 65% met TG goals < 150 mg/dL, and 30% reached apo B targets.
Finally, in the whole study cohort, only a small proportion of individuals across cardiovascular risk categories achieved appropriate lipid goals according to European [34] and Mexican guidelines [35, 36] (Supplementary Table 2). The residual cardiovascular risk attributable to each lipid parameter, stratified by cardiovascular risk [34], is summarized in (Table 6). And the prevalence of ASCVD was increased across the Lp(a) concentrations. (Supplementary Fig. 6)
Table 6 Percentage of individuals in residual risk according to their cardiovascular risk and LDL-C targets in the study populationDiscordant Lp(a) valuesAmong the 830 individuals, 116 (14%) had Lp(a) measured twice without a documented reason. The initial median Lp(a) concentration was [20 (8.5–45.9) mg/dL] and at a follow-up it was [17.8 (8.9–49.1) mg/dL], and delta values did not show statistical significance (p = 0.84) (Supplementary Table 3).
Among individuals with two measurements, 9.5% showed discordant results, with Lp(a) concentrations either increasing or decreasing. 2.6% of individuals moved to a higher cardiovascular risk category, while a decrease in risk category was observed in 8 individuals (6.9%). Despite these changes, physicians intensified the treatment of cardiovascular risk factors in only 1 of the 3 individuals whose risk category increased. Individuals who moved to a lower risk category remained without any changes in the management of their comorbidities.
Notably, none of the individuals with discordant Lp(a) values had an infectious process or acute illness at the time of the second measurement.
Comments (0)