Experimental animals
To control for the variable effects of endogenous estrogen on lipid metabolism [24, 25], all experiments used isogenic male C57 mice (n = 20) at 8 weeks postnatal age, maintained under pathogen-free (SPF) conditions with controlled body mass (18–22 g). They were purchased from Liaoning Changsheng Biotechnology Co., Ltd. (Experimental Animal Production Licence No. SCXK (Liao) 2020-0001) and housed at the Experimental Animal Center of Liaoning University of Traditional Chinese Medicine (Animal Center Use Licence No. SYXK (Liao) 2019-0004). The environmental temperature of the animal centre was 22 ± 1 °C, with natural lighting and a humidity of 50 ± 5%. The Ethics Committee of Laboratory Animals at Liaoning University of Traditional Chinese Medicine approved the implementation of the experiment. (Approval No. 21000042023008).
Experimental reagents
Polystyrene plastic microspheres (PS-NPs; Big Goose [Tianjin] Technology Co., Ltd., Tianjin, China; FL-PS-R-001); High-fat chow (Xiaoshu Youtai [Beijing] Biotechnology Co., Ltd., Beijing, China); TC (CH0103152), TG (CH0105151), LDL-C (CH0105162), and HDL-C (CH0105161) assay kits (Sichuan Maccura Biotechnology Co., Ltd., Chengdu, Sichuan, China); eosin (GC307021), haematoxylin (GC307020) and oil Red O staining kits (CR2312030) (Wuhan Servicebio Technology Co., Ltd., Wuhan, Hubei, China); Phosphatidylcholine (PC, YJ006201H) Kit (Shanghai Enzyme Linked Biotechnology Co., Ltd., Shanghai, China).
The untargeted metabolomics and transcriptomics analyses were performed by Wuhan MetWare Biotechnology Co., Ltd., Wuhan, Hubei, China.
Grouping, modelling, and sampling
Following a 1-week acclimation period, twenty C57 mice were randomly and evenly divided into a normal control (NC) group and an NPs exposure (NPs) group. Based on literature research [26,27,28], the NPs group received drinking water containing 1000 µg/L NPs, which was refreshed daily to maintain exposure consistency. Mice had free access to food and water throughout the entire study period. Before sampling, the following model establishment, the weight, dietary intake, abdominal fat volume, and fat mass of the mice were measured for in vivo assessment. Following these measurements, the mice underwent a 12-hour fasting period during which water was provided ad libitum. Then anesthetizing the mice, orbital sinus blood samples were collected and subjected to 2-hour coagulation at room temperature prior to centrifugation (856 ×g, 30 min, 4 °C). Then, the supernatant was stored for future use. After humane euthanasia via cervical dislocation, liver specimens were surgically excised and processed, with half frozen at -80 ℃ and half fixed in 4% paraformaldehyde.
Observation indicators and methodsCharacterization of NPs
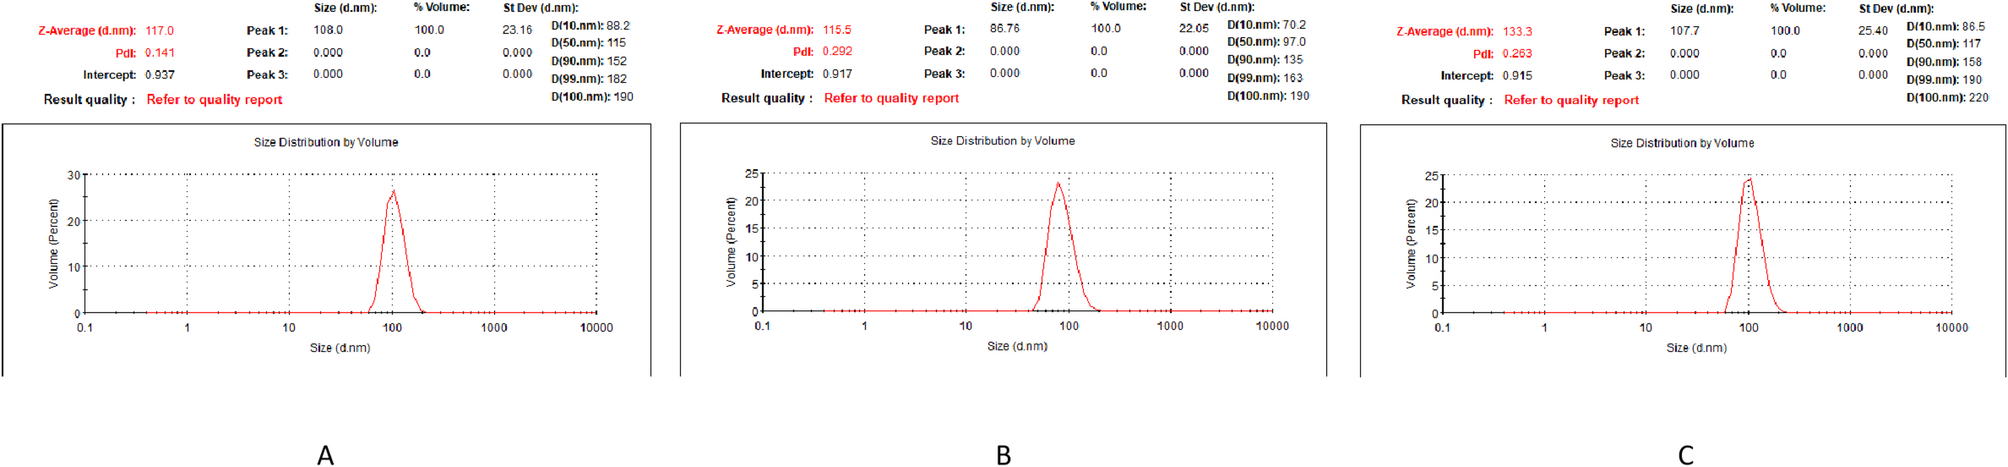
The NPs dilution was prepared using pure water, with a dilution concentration of 1000 µg/L. The average particle size and dispersity of the NPs stock solution (10 mg/10 mL), NPs dilution, and NPs dilution after 24 h were analyzed using dynamic light scattering (DLS) experiments conducted with the Malvern Zetasizer Nano ZS90 (Malvern Panalytical Ltd., Malvern, UK). All measurements were conducted under controlled conditions (25 °C) using 633 nm excitation light with 90° detection geometry, with triplicate acquisitions per sample.
Body weight and dietary uptake
Use the experimental animal body weight scale (ZK-DST, Henan Zhike Hongrun Environmental Protection Technology Co., Ltd., Zhengzhou, Henan, China) to measure the weight and dietary uptake of mice. The body weights of the experimental animals were measured every two weeks. The daily dietary quantity of mice was calculated as follows [16]. Each group of mice was provided 5 g of feed per mouse per day (50 g of feed per day for every 10 mice). After 24 h, the remaining feed was weighed. The daily dietary quantity of mice was calculated as (50 g - remaining feed)/10 mice. Measurements were taken every two weeks for three consecutive days and recorded as raw data.
Measurement of abdominal fat volume and total body fat mass
A small animal in vivo MicroCT scanner (QuantumGXII, PerkinElmer, Waltham, MA, USA) was used to measure the total abdominal fat volume below the diaphragm in the mice. Isoflurane was continuously administered to anesthetize the mice. The position of the mouse bed was adjusted to center the abdominal fat image within the CT field of view. Imaging parameters included 90 kV excitation voltage, 80 µA beam current, and 36 μm voxel size, using High Resolution acquisition over 4 min. Abdominal fat images of the mice were obtained, and after secondary reconstruction, the total volumes of visceral and subcutaneous fat in the abdomen were analysed and calculated.
Total body fat content was measured using the EchoMRI-100 H system (EchoMRI LLC, Houston, TX, USA). First, the mouse was weighed and placed in a holder suitable for its weight. Next, the holder containing the mouse was completely inserted into the detection slot of the small animal body composition analyser. The EchoMRI software was used to perform the system test and measure the total body fat content of each mouse. The instrument automatically takes two measurements and calculates the average value.
Determination of mouse liver weights
After the mice were euthanized under anaesthesia, complete hepatic excision was performed, with the organ subsequently placed on weighing paper, a balance was used to weigh it, and the weight was recorded.
Mouse blood lipid testing
An automatic biochemical analyser (7180, Hitachi High-Tech Corporation, Tokyo, Japan) was employed to quantify serum TC, TG, LDL-C, and HDL-C levels.
Histopathological examination of the mouse liver
Slices were prepared using an embedding machine (JB-P5, Wuhan Junjie Electronics Co., Ltd., Wuhan, Hubei, China) and a pathological microtome (RM2016, Leica Biosystems (Shanghai) Co., Ltd., Shanghai, China), and photographed with a digital slide scanning imaging system (Precipoint M8, Precipoint GmbH, Munich, Germany). HE and Oil Red O staining were performed to examine pathological morphology and lipid deposition in liver tissues.
HE staining: Following fixation, liver tissues were dehydrated, cleared in xylene, paraffin-embedded, and sectioned (~ 5 μm). Take photos and observe after HE staining and covering slides. Oil Red O staining: the fixed liver tissue undergoes sucrose dehydration, OCT embedding, preparation of frozen sections approximately 6 μm thick, immersion in 60% isopropanol, staining with Oil Red O solution for 10 min, followed by mounting, photographing, and observation.
Untargeted metabolomics analysisExtraction methodExtraction method for hydrophilic substances
20 mg of liver tissue was homogenized and first centrifuged at 1016 ×g, 4 °C for 30 s. Next, 400 µL of a 70% methanol solution containing the internal standard was added, and the suspension was vortexed for five minutes then incubated on ice for fifteen. The sample was then subjected to high-speed centrifugation (16260 ×g, 4 °C, 10 min), after which 300 µL of the clear supernatant was harvested and placed at − 20 °C for half an hour. Following an additional 3-minute spin under the same conditions, 200 µL of the upper phase was retrieved and set aside for downstream analysis.
Hydrophobic substance extraction methods
After homogenizing 20 mg of liver tissue, centrifuge at 1016 (×g) for 30 s at 4 °C. 1 mL of lipid extraction solvent containing the internal standard was introduced to the sample, and the mixture was agitated vigorously for 15 min. Upon the addition of 200 µL of water, the sample was mixed vigorously for one minute and then centrifuged (16,260 ×g, 4 °C, 10 min). 200 µL of the upper clear liquid was removed, and the mixture was evaporated to dryness. 200 µL of lipid reconstitution solution was added, the mixture was vortexed for 3 min, the sample was subjected to a 3-minute, 16 260 × g spin, then the supernatant was removed for analysis.
Chromatography-mass spectrometry data acquisition
Ultra-performance liquid chromatography (UPLC) and tandem mass spectrometry (MS/MS) were used to acquire the metabolomics data.
Hydrophilic interaction liquid chromatography conditions
Chromatographic separation was carried out on a Waters ACQUITY UPLC HSS T3 C18 column (40 °C) at 0.4 mL/min, using water (A) and acetonitrile (B). The gradient ran from 95:5 A/B at 0 min to 10:90 at 11.0 min, held through 12.0 min, returned to 95:5 by 12.1 min, and re-equilibrated until 14.0 min. A 2 µL aliquot was injected.
Hydrophobic liquid chromatography conditions
Chromatographic separation was performed on a Thermo Accucore™ C30 column (2.1 × 100 mm, 2.6 μm) maintained at 45 °C. Mobile phase A consisted of acetonitrile/water (60/40, v/v) with 0.1% formic acid and 10 mmol/L ammonium formate; phase B was acetonitrile/isopropanol (10/90, v/v) containing the same additives. The flow rate was 0.35 mL/min and the injection volume 2 µL. The gradient ran as follows (A:B):0 min, 80:20 → 2 min, 70:30 → 4 min, 40:60 → 9 min, 15:85 → 14 min, 10:90 → 15.5 min, 5:95 (held to 17.3 min) → 17.5 min, 80:20 → 20 min, 80:20.
Mass spectrometry conditions for hydrophilic substances
The electrospray ionization (ESI) temperature of 500 °C was used, with + 5500 V/–4500 V spray voltages for positive and negative modes. The ion source gas I (GSI), ion source gas II (GSII), and ion source gas (CUR) were adjusted to 55, 60, and 25 psi. The collision-activated dissociation (CAD) parameter was set to ‘high’, and the triple quadrupole (Qtrap) acquired each ion pair according to its optimized declustering potential (DP) and collision energy (CE).
Mass spectrometry conditions for hydrophobic substances
Using ESI at 500 °C with spray voltages of + 5500 V (pos) and − 4500 V (neg), GS1, GS2 and CUR were fixed at 45, 55 and 35 psi. CAD was Medium, and each ion-pair transition in the triple quadrupole (Qtrap) was detected under the optimized DP and CE.
Sample quality control
Three QC samples, created by blending individual sample extracts, were introduced at regular intervals during analysis to verify analytical repeatability. Data quality was evaluated by computing Pearson’s correlation among the QC injections; coefficients approaching ± 1 reflected a highly stable detection process and superior data quality.
Transcriptome sequencing analysisRNA detection
Six samples were randomly selected from each of the NC groups and the NPs groups for RNA quality assessment. RNA integrity and DNA contamination were analysed. RNA concentration was precisely determined with a Qubit 4.0 fluorometer/MD microplate reader. Ultimately, five samples from the NC group and five samples from the NPs group were included in the transcriptome sequencing analysis.
Library construction and quality control
The total RNA pool was subjected to oligo (dT) magnetic-bead capture to isolate mRNA, which was then fragmented using fragmentation buffer. Using the fragmented RNAs as templates, a reverse transcriptase system generated cDNA. The cDNA was subsequently cleaned and subjected to end repair, adenine overhang addition, adapter ligation, fragment size-fractionation, PCR amplification and final purification. Ultimately, the enriched library was obtained through PCR amplification. Once library preparation was complete, an initial concentration measurement was carried out using the Qubit fluorescent dye assay. The library passed quality control when the effective concentration was greater than 2 nM. Upon passing quality checks, the prepared library was run on the Illumina sequencer.
Bioinformatics analysis
Differential gene expression between conditions was analyzed using DESeq2, resulting in the identification of a set of DEGs between the two biological conditions. In order to control the false discovery rate (FDR), P value underwent adjustment for multiple comparisons. Genes with|log2 fold change| ≥ 1 and FDR < 0.05 were considered differentially expressed. This DEG set was then subjected to clustering analysis, and a heatmap was generated to group genes or samples with similar expression patterns. Functional annotation of the DEGs was performed using Kyoto Encyclopedia of Genes and Genomes (KEGG) pathway analysis.
RT-qPCR to verify the expression of differentially expressed gene mRNA in mouse liver tissue
Using real-time fluorescence quantitative polymerase chain reaction instrument (CFX Opus 96, Bio-Rad Laboratories, Inc., Hercules, CA, USA), water bath constant temperature shaker (SHZ-88, Haimen Kylin-Bell Lab Instruments Co., Ltd., Haimen, Jiangsu, China), and high-precision analytical balance detected differential genes mRNA expression. From 20 mg of liver, total RNA was obtained, quantified, and used for cDNA synthesis via reverse transcription. Amplification conditions were set according to the kit manual. β-actin served as the internal reference to quantify the relative mRNA levels of differential liver genes Cyp2c23 (Mus musculus cytochrome P450 family 2, subfamily c, polypeptide 23), Cyp2c40 (Mus musculus CYP2C40), and Cyp2b9 (Mus musculus cytochrome P450 family 2, subfamily b, polypeptide 9). Relative quantification analysis was performed using the 2^-ΔΔCt method. Primers were synthesized by Saiyi Biotechnology Co., Ltd., Beijing, China (Table 1).
ELISA method to verify the PC levels in mouse liver
After letting the PC kit stand at ambient conditions for twenty minutes, samples were added per the protocol and then incubated at 37 °C, washed the plate, and added the reaction substrate, then measured the absorbance at 450 nm, ploted the standard curve for linear regression, and calculated the PC levels in the mouse liver.
Statistical methods
Data analysis and visualization were performed utilizing GraphPad Prism 8 software, with sample sizes indicated for each parameter. For inter-group comparisons, statistical comparisons employed an independent t-test when normality assumptions were met, otherwise a Wilcoxon rank-sum test was used; P < 0.05 denoted significance.


Comments (0)