
Remember me
A total of 36 FFPE sample cases from 27 patients, including 24 primary tumors and 12 lymph node metastases, were selected for the analysis. Ex vivo measurements revealed a broad range of iodine concentrations, varying over three orders of magnitude from the lowest detectable avidity value of 2 × 10⁻⁶ to 2 × 10⁻³ IA g−1. Iodine avidity was assessed and analyzed primarily as a continuous variable. However, for descriptive statistics and some analysis, two equally sized groups were created, consisting of low-avidity and high-avidity tumors. The groups were created by splitting samples at the median value of iodine concentration, which was 7 × 10⁻⁵). As earlier published analysis has shown, healthy thyroid tissue in the cohort had avidity values above 7 × 10⁻³ IA g−1, with a median value of 2 × 10⁻² IA g−1 [24].
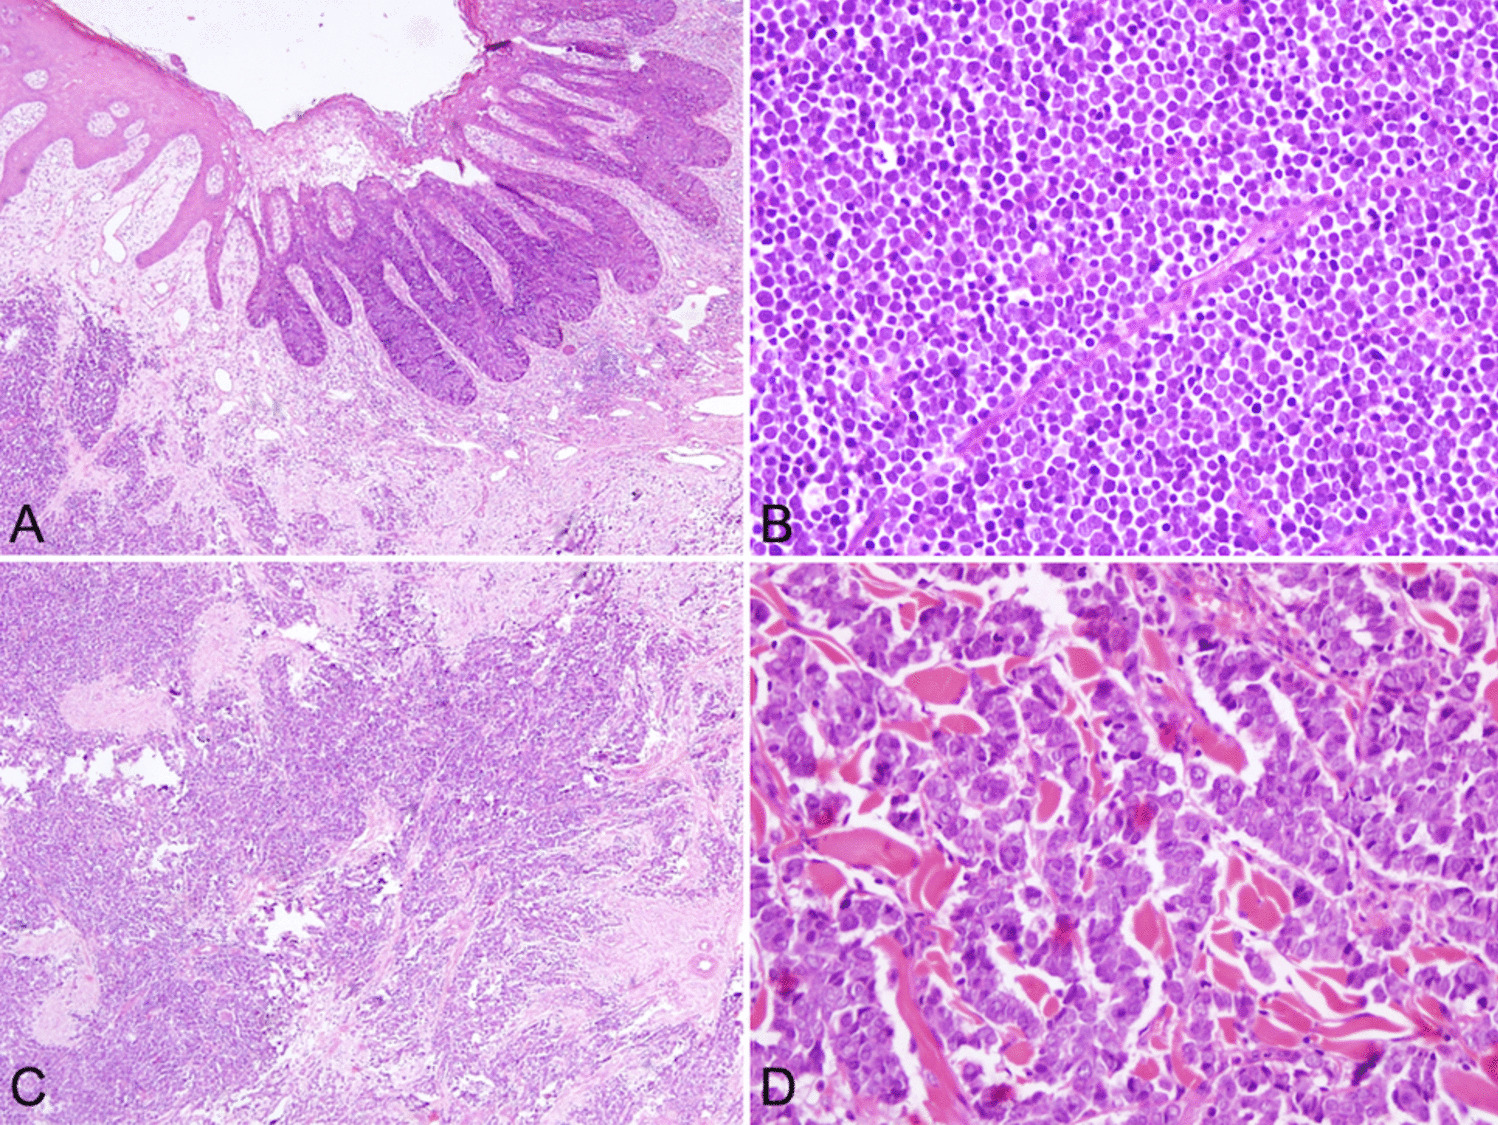
The clinical, histological, and molecular characteristics of each group are outlined in Table 1. Cases in the high-avidity group were generally younger at diagnosis, with an average age of 48.6 ± 13.8 compared to 59.3 ± 14.5 in the low-avidity group (p = 0.04). Primary tumors were more prevalent than metastases in the high-avidity group (15/18 vs. 9/18), although this difference was not statistically significant. While the majority of PTCs with unfavorable histology (9/18; 50%) were low-avidity cases (Fig. 1A, B), and the same proportion of cases with favorable histology were high-avidity cases (9/18; 50%) (Fig. 1C, D), this trend did not reach statistical significance. Regarding high-grade thyroid carcinoma, one case met the criteria for DHGTC, and one case fulfilled the diagnostic criteria for PDTC (Table 1). There was no progression in terms of tumor grade noted in any of the paired cases (primary tumor and lymph node metastases). No significant differences were noted in sex distribution, primary tumor size, or metastasis size.
Table 1 Clinical, histological, and molecular characteristics of samples with RAI avidity measurementFig. 1
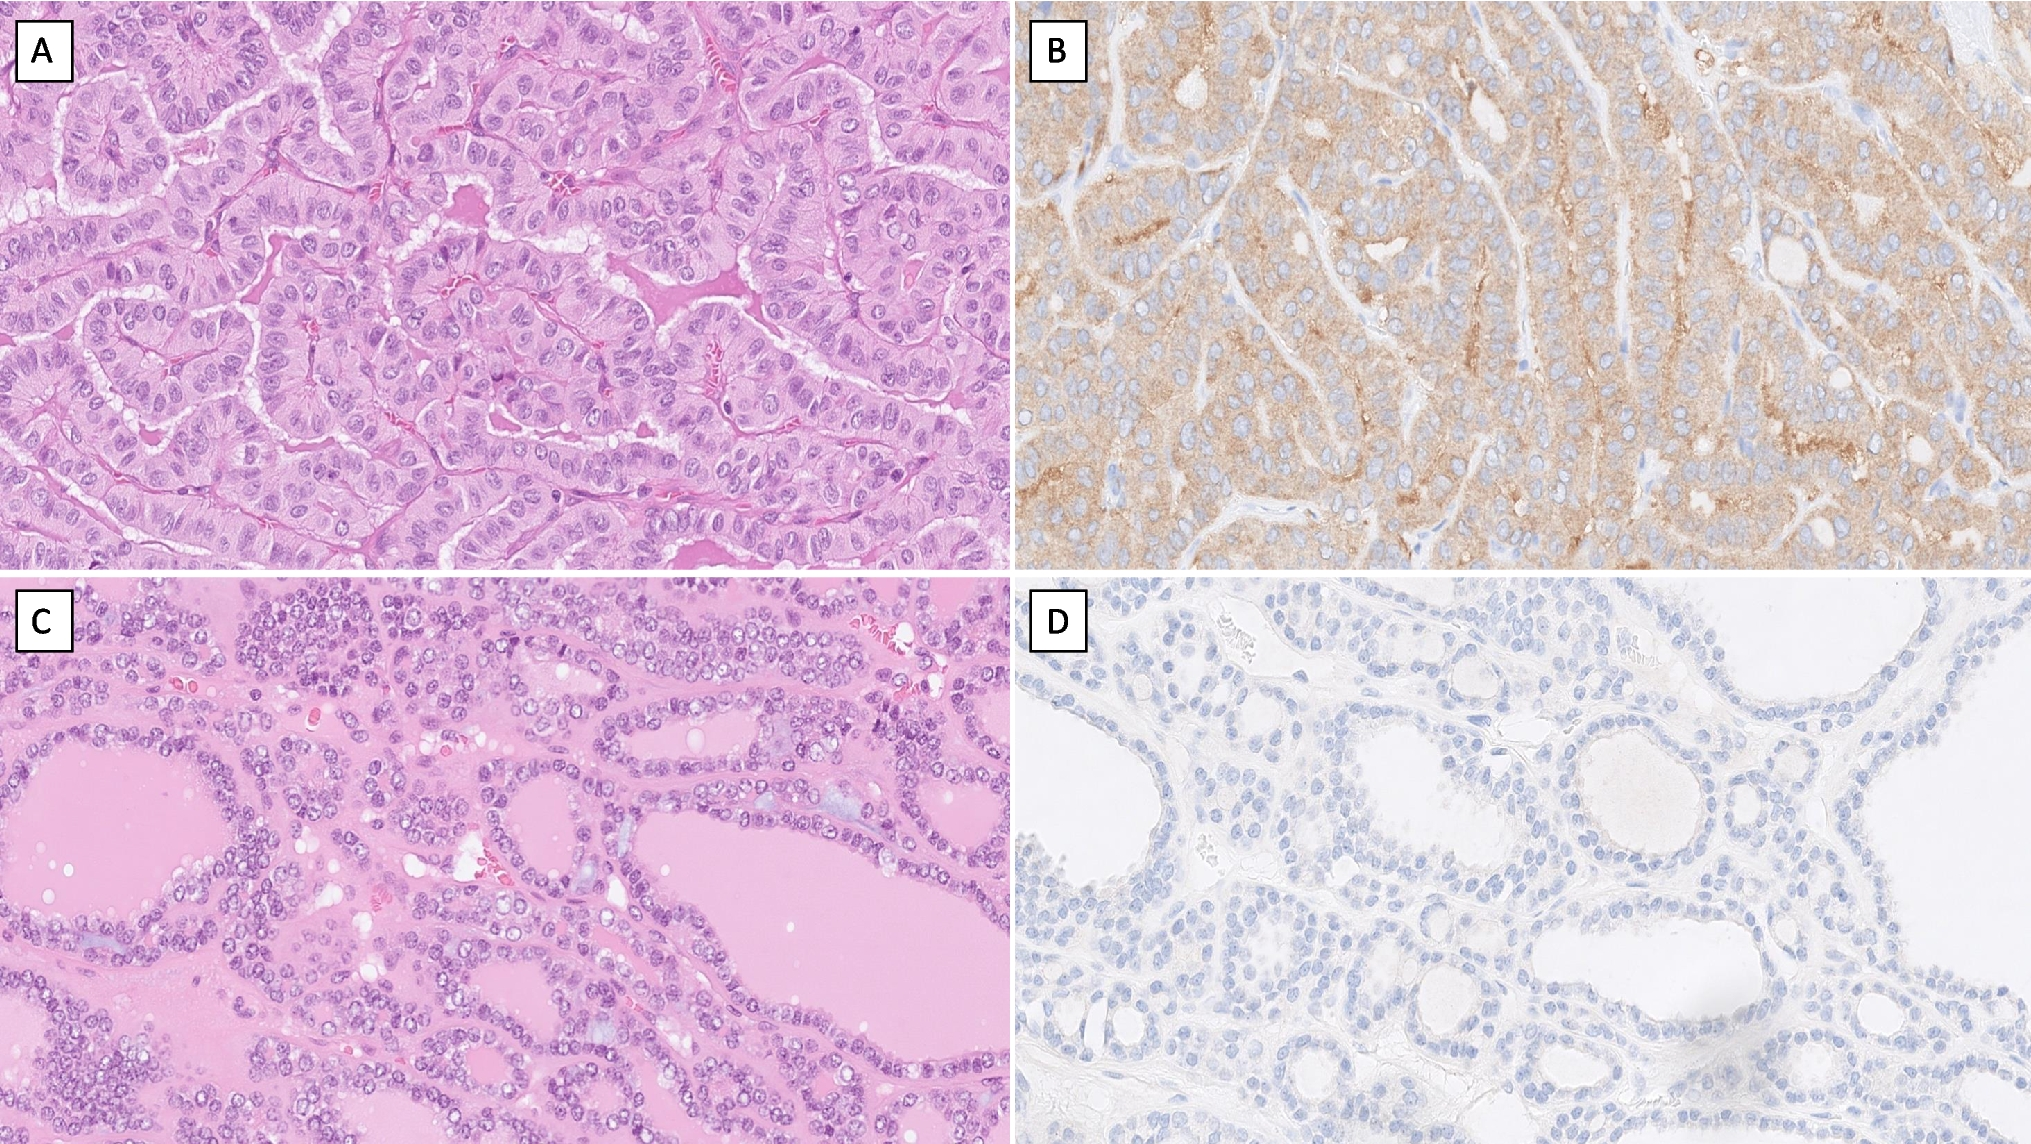
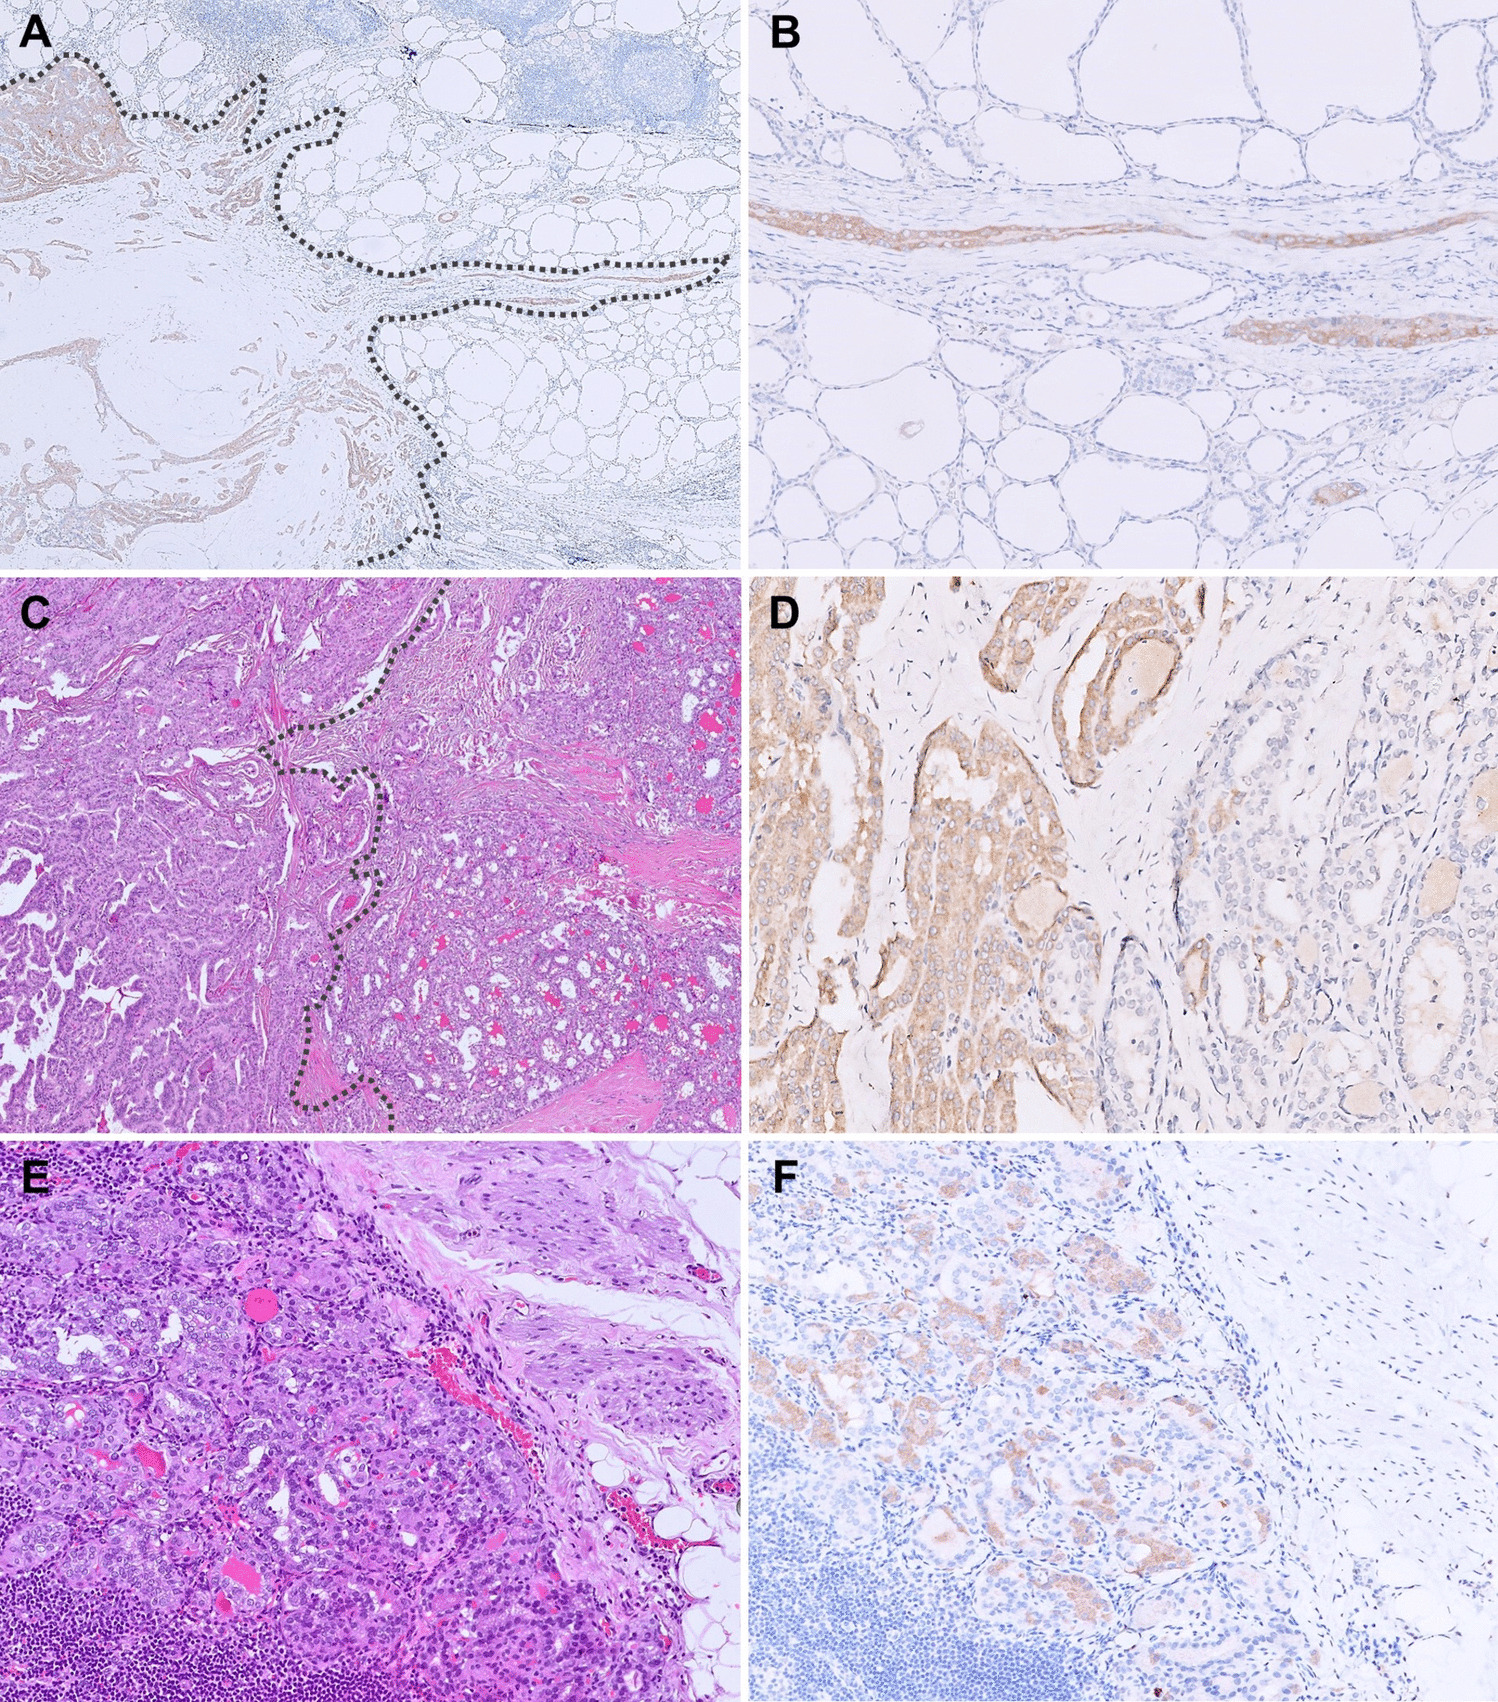
Histology of high- and low-avidity papillary thyroid carcinoma. A Hematoxylin and eosin (H&E) stained tall cell subtype of papillary thyroid carcinoma with BRAF p.V600E and C228T TERT promoter mutations. This tumor displayed low radioiodine avidity as measured ex vivo. B Clinical routine BRAF VE1 immunohistochemistry with a positive cytoplasmic signal in the same case. C H&E stained minimally invasive encapsulated follicular variant papillary thyroid carcinoma with high radioiodine avidity. D As expected, no BRAF VE1 immunoreactivity was noted. All images are magnified × 400
As previously reported [23], the mutational analysis of the cohort revealed a high prevalence of the BRAF p.V600E mutation, detected in 22 out of 36 cases. Among the high-avidity tumors, 11 cases (61%) harbored the BRAF p.V600E mutation, with 3 (27%) of these also carrying the TERT promoter mutation. Similarly, in the low-avidity group, 11 cases (61%) exhibited the BRAF p.V600E mutation, and among these, 7 (64%), carried the TERT promoter mutation. Twelve cases were wild-type for both BRAF and TERT mutations (7/18 in high-avidity vs. 5/18 in low-avidity). Two low-avidity cases failed the mutational analysis. The failed DNA analysis was likely due to the long storage time of the paraffin blocks, which may affect DNA quality and yield.
Clinical and nuclear imaging correlates in our cohort have been previously published [26]. Briefly, data from 35 patients showed that 10 developed or had persistent disease during follow-up (range: 19–46 months). Among these, four patients had non-avid persistent metastatic disease, all of whom had low iodine avidity in their primary tumors and initial lymph node metastases. The results confirmed that pre-therapeutic ex vivo measurements used in this work agree with uptake on subsequent nuclear imaging of metastases.
Transcriptomic Characterization Associated with Iodine AvidityRNA-seq data derived from 36 cases were analyzed for differential gene expression. Four cases were ruled out due to low-quality RNA, as highlighted in the MultiQC report. To identify differences in gene expression profiles and detect specific genes associated with the refractory tumor phenotype, we conducted a supervised analysis of RNA-seq data from 16 tumors in the high-avidity group and 16 in the low-avidity group. Whole-transcriptome analysis showed distinct clustering of high-avidity and low-avidity tumors (Fig. 2A). Differential expression analysis identified 63 genes that were significantly differentially expressed between the two groups (FDR < 0.05). Of these, 14 genes were upregulated, while 49 genes were downregulated in low-avidity tumors compared to high-avidity tumors. Among the 63 DEGs, we identified six that were consistently deregulated and biologically relevant to tumorigenesis and thyroid metabolism, potentially influencing the regulation of RAI avidity in thyroid cancer (Fig. 2B).
Fig. 2
Gene expression analysis of high-avidity and low-avidity cases. A Principal component analysis (PCA) plot based on high-avidity (n = 16) and low-avidity (n = 16) tumors. Each dot corresponds to an individual tumor case. B Volcano plot showing the most dysregulated genes between high- and low-avidity tumor cases. C Heatmap of the 63 differentially expressed genes (DEGs) between the two groups of cases analyzed. All the low-avidity cases are clustered together on the left part of the graph, while the high-avidity cases are clustered on the right. Three high-avidity cases were recognized as low-avidity. D Bar plot of representative gene ontology (GO) terms categorized into three main functional groups: biological process (BP) in orange, cellular component (CC) in green, and molecular function (MF) in blue. Within each group, the top ten significative (p-value < 0.05) GO terms are displayed on the y-axis and ranked by their enrichment score (x-axis), with higher scores indicating greater enrichment significance. E Expression level of the most consistent deregulated genes between high- and low-avidity cases detected by RNA-seq. CRTC2 and S100A4 were found to be upregulated in low-avidity cases compared with high-avidity, while ANO1, WWTR1, DEPTOR, and MT1G were downregulated in low-avidity cases compared with high-avidity
The heatmap in Fig. 2C shows the differential gene expression profile for each group. The first cluster (on the left) consisted predominantly of low-avidity phenotype cases. Interestingly, three cases, of which one oncocytic PTC (OPTC) and two tall cell PTCs (TCPTC), deviated from the high-avidity cluster and instead grouped with the low-avidity cases. Upon further investigation, the OPTC case exhibited a borderline avidity value, while one of the TCPTC cases developed distant metastases with low avidity during clinical follow-up observations. The second main cluster (on the right) grouped the remainder of the high-avidity phenotype cases, a distinct subgroup of two PDTC cases positioned at the far right. One of these cases exhibited distinct gene expression patterns compared to the low-avidity cases, and clinical follow-up indicated that the corresponding patient developed distant metastases with high RAI avidity.
From the 63 DEGs, we next identified six that were consistently deregulated and have known biological relevance to tumorigenesis and thyroid metabolism, likely impacting the regulation of RAI avidity in thyroid cancer. Among these, two genes (S100A4 and CRTC2) were found to be upregulated, while four genes (ANO1, WWTR1, DEPTOR, and MT1G) were downregulated in low-avidity compared to high-avidity cases, as determined by TPM values (Fig. 2E).
Furthermore, the expression of the six DEGs was tested for correlation with iodine avidity as a continuous variable. As reported in Fig. 3, the results showed a significant positive correlation between avidity and ANO1 expression (r = 0.54, CI 0.23–0.75). A 83-fold higher tumor avidity for iodine was observed for a tenfold higher ANO1 expression in the tissue. No other gene expression among the six DEGs showed statistically significant correlations with avidity.
Fig. 3
Correlation between ANO1 mRNA expression and iodine avidity in tumor tissue. The correlation coefficient was r = 0.54, CI 0.23–0.75, p < 0.01, with 83-fold higher avidity for a tumor with tenfold higher ANO1 expression. Levels of avidity observed in normal thyroid tissue (green), the lower detection limit for avidity in the experiment (orange), and the linear correlation line with confidence intervals (grey) are also displayed for clarity
To further validate these findings, RT-qPCR was then performed on a subset of cases with still available RNA or tissue (8 low-avidity and 8 high-avidity). Although the upregulation of S100A4 in low-avidity tumors was not statistically significant (p = 0.12), this gene was included in the validation list of genes due to its established role in thyroid cancer and its involvement in tumorigenesis across various other cancer types (Supplementary Fig. 1). While the differences in mRNA expression levels of ANO1 and WWTR1 between low- and high-avidity cases were not statistically significant, both genes exhibited the same trend of lower expression in low-avidity tumors. Conversely, CRTC2 and S100A4 mRNA levels were higher in low-avidity tumors, with statistical significance observed for S100A4, corroborating the findings from the RNA-seq analysis.
In addition to the genes that showed consistent dysregulation, SLC5A5 (encoding NIS) was investigated separately due to its known association with thyroid cancer and iodine metabolism. Excluding those samples with TPM = 0, the analysis showed a significant positive correlation between SLC5A5 expression and iodine avidity (r = 0.38, CI 0.01–0.67) (Supplementary Fig. 4). Similarly, comparing the high- and low-avidity groups, high-avidity samples exhibited a 5.8-fold higher expression (CI 1.5–23).
Gene Ontology and Pathway Enrichment AnalysisTo explore the biological significance of the previously identified DEGs, gene ontology (GO) and pathway enrichment analyses were conducted. GO analysis classified the DEGs into functional categories, including biological processes (BP), molecular functions (MF), and cellular components (CC). Figure 2D highlights the top 10 significantly enriched BP, MF, and CC categories, ranked according to their enrichment scores. Although not shown in Fig. 1D, the GO analysis revealed significant enrichment in processes specifically related to the thyroid, such as “thyroid hormone generation” and “thyroid hormone metabolic processes.” Additionally, several biological processes and molecular functions associated with cell adhesions and wound healing, including “response to vascular endothelial growth factor stimulus,” “adherens junction,” and “cell–cell junction,” were also significantly enriched. These processes have been previously linked to more advanced stages of thyroid cancer [21]. Notably, the enrichment of “phosphatidylinositol 3-kinase signaling” aligns with the role of this pathway in regulating RAI avidity. Moreover, pathway enrichment analysis (Supplementary Fig. 2) highlighted significant enrichment in the PI3K-AKT and MAPK signaling pathways, as well as pathways involved in thyroid hormone synthesis, underscoring the crucial role these processes play in influencing iodine avidity.
ANO1 ImmunohistochemistryANO1 immunoreactivity is illustrated in Fig. 4, along with controls. Overall, the immunoreactivity in thyroid tumors was weak and variable, also in adjacent normal thyroid tissues. Notably, ANO1 expression was confined to the apical membrane and was never detected in the cytosol or nuclear compartment. H-scores ranged from 0 to 150 (data not shown), with a median value of 25 indicating faint expression localized to the apical membrane.
Fig. 4
ANO1 immunoreactivity in papillary thyroid carcinoma (PTC) with variations in radioiodine avidity. All photomicrographs were captured at × 400 magnification. The top row shows control experiments for each slide, demonstrating strong cytosolic ANO1 expression in a gastrointestinal stromal tumor (GIST) and weaker membranous staining in a de-identified case of Graves’ diffuse hyperplasia as well as negative immunoreactivity in normal colon. The bottom row illustrates weak and focal ANO1 expression in adjacent normal thyroid tissue followed by two PTC cases, one with high iodine avidity (HA) and one with low (LA). The H scores shown are 150 for the avid case and 0 for the non-avid case. Note that in the thyroid samples, ANO1 expression is localized to the apical membrane
The correlation coefficient between ANO1 immunohistochemical H-score and iodine avidity was r = 0.51 (CI 0.07–0.78, p = 0.03) (Supplementary Fig. 3). However, the correlation between ANO1 H-score and mRNA expression was not significant, with r = 0.28 (CI − 0.23–0.67, p = 0.27).
Multivariate ModellingThe multivariate modelling used the DEGs found in the RNA-seq (ANO1, WWTR1, S100A4, CRTC2, GLIS3, and NKX2_1). Additionally, the expression of SLC5A5 was tested in the modelling due to its well-established role in iodine transport through the plasma membrane. The process of elimination of variables resulted in a predictive model with ANO1 expression performing well. Markers from the previously established model that still performed well were immunohistochemical Tg expression, high-risk histology (tall cell and hobnail variant PTC, DHGTC, and PDTC), and type of sample (primary tumor vs. lymph node metastasis). The resulting model was less complex than previously described while performing similarly in terms of predictive power (adjusted R2 of 0.55). Therefore, data on ANO1 expression likely improve any predictive scheme for iodine avidity. Replacing ANO1 mRNA expression with ANO1 intensity score from immunohistochemistry resulted in a similar, albeit slightly lower, model performance (adjusted R2 of 0.48). While the modelling results were used to select the most impactful predictors of iodine avidity, no external validation was included, and the results are therefore not suited for generalization.
Comments (0)