
Remember me
A total of 54 tissue samples from 54 individual patients were collected at the Medical University of Vienna (n = 28) and at the Medical University of Graz (n = 26), comprising TC (n = 37, 68.5%) and AC (n = 17, 31.5%). Women were predominant in this cohort (64.8%), and the median age at diagnosis was 61 years (range 21–82). Most TC were diagnosed as stage 1 (78.4%), whereas most AC were stage 2 (29.4%) or higher (p = 0.002), see Table 1. Over the course of the disease, 25/53 (47.2%) developed metastases (TC vs. AC: p < 0.001), primarily to the liver (n = 19), bone (n = 12), brain (n = 7), and lungs (n = 7). SSTR imaging showed a positive scan in 14/26 patients (53.8%). Endocrine activity was present in 7/28 patients (25.0%). All tumors originated from the lung (primary lung NET). While most TC tissues (94.6%) were obtained from the lung, this was the case in only about half of the AC tissues (8/17). In total, 9/54 (16.7%) tissues were not from the initial diagnosis but were obtained later during the disease course (38–160 months).
Table 1 Patient demographics and basic disease characteristicsIn total, 50 patients (92.6%) had primary tumor resection. Surgery was not curative in 7 patients (for 2 no data was available), while 26 were recurrence-free at the last follow-up and 15 had a relapse (median time to relapse 47.4 months). The median overall survival (OS) of the entire patient cohort was 224.1 months (95% CI 116.9–not calculable) and the 10-year survival probability 69.0%. There was no difference in OS based on histology (median OS for TC not reached versus 161.1 months in AC, p = 0.6). Twenty-three patients (42.6%) started systemic therapy, with 5 being treated with adjuvant intent. The median progression-free survival (PFS) following systemic first-line therapy in the 18 patients with metastatic disease was 18.1 months (95% CI 6.0–27.7 months). The median PFS for the specific treatments was 5.4 (platinum/etoposide), 17.0 (everolimus), 14.5 (PRRT), 17.6 (other), and 23.6 months (somatostatin analogs).
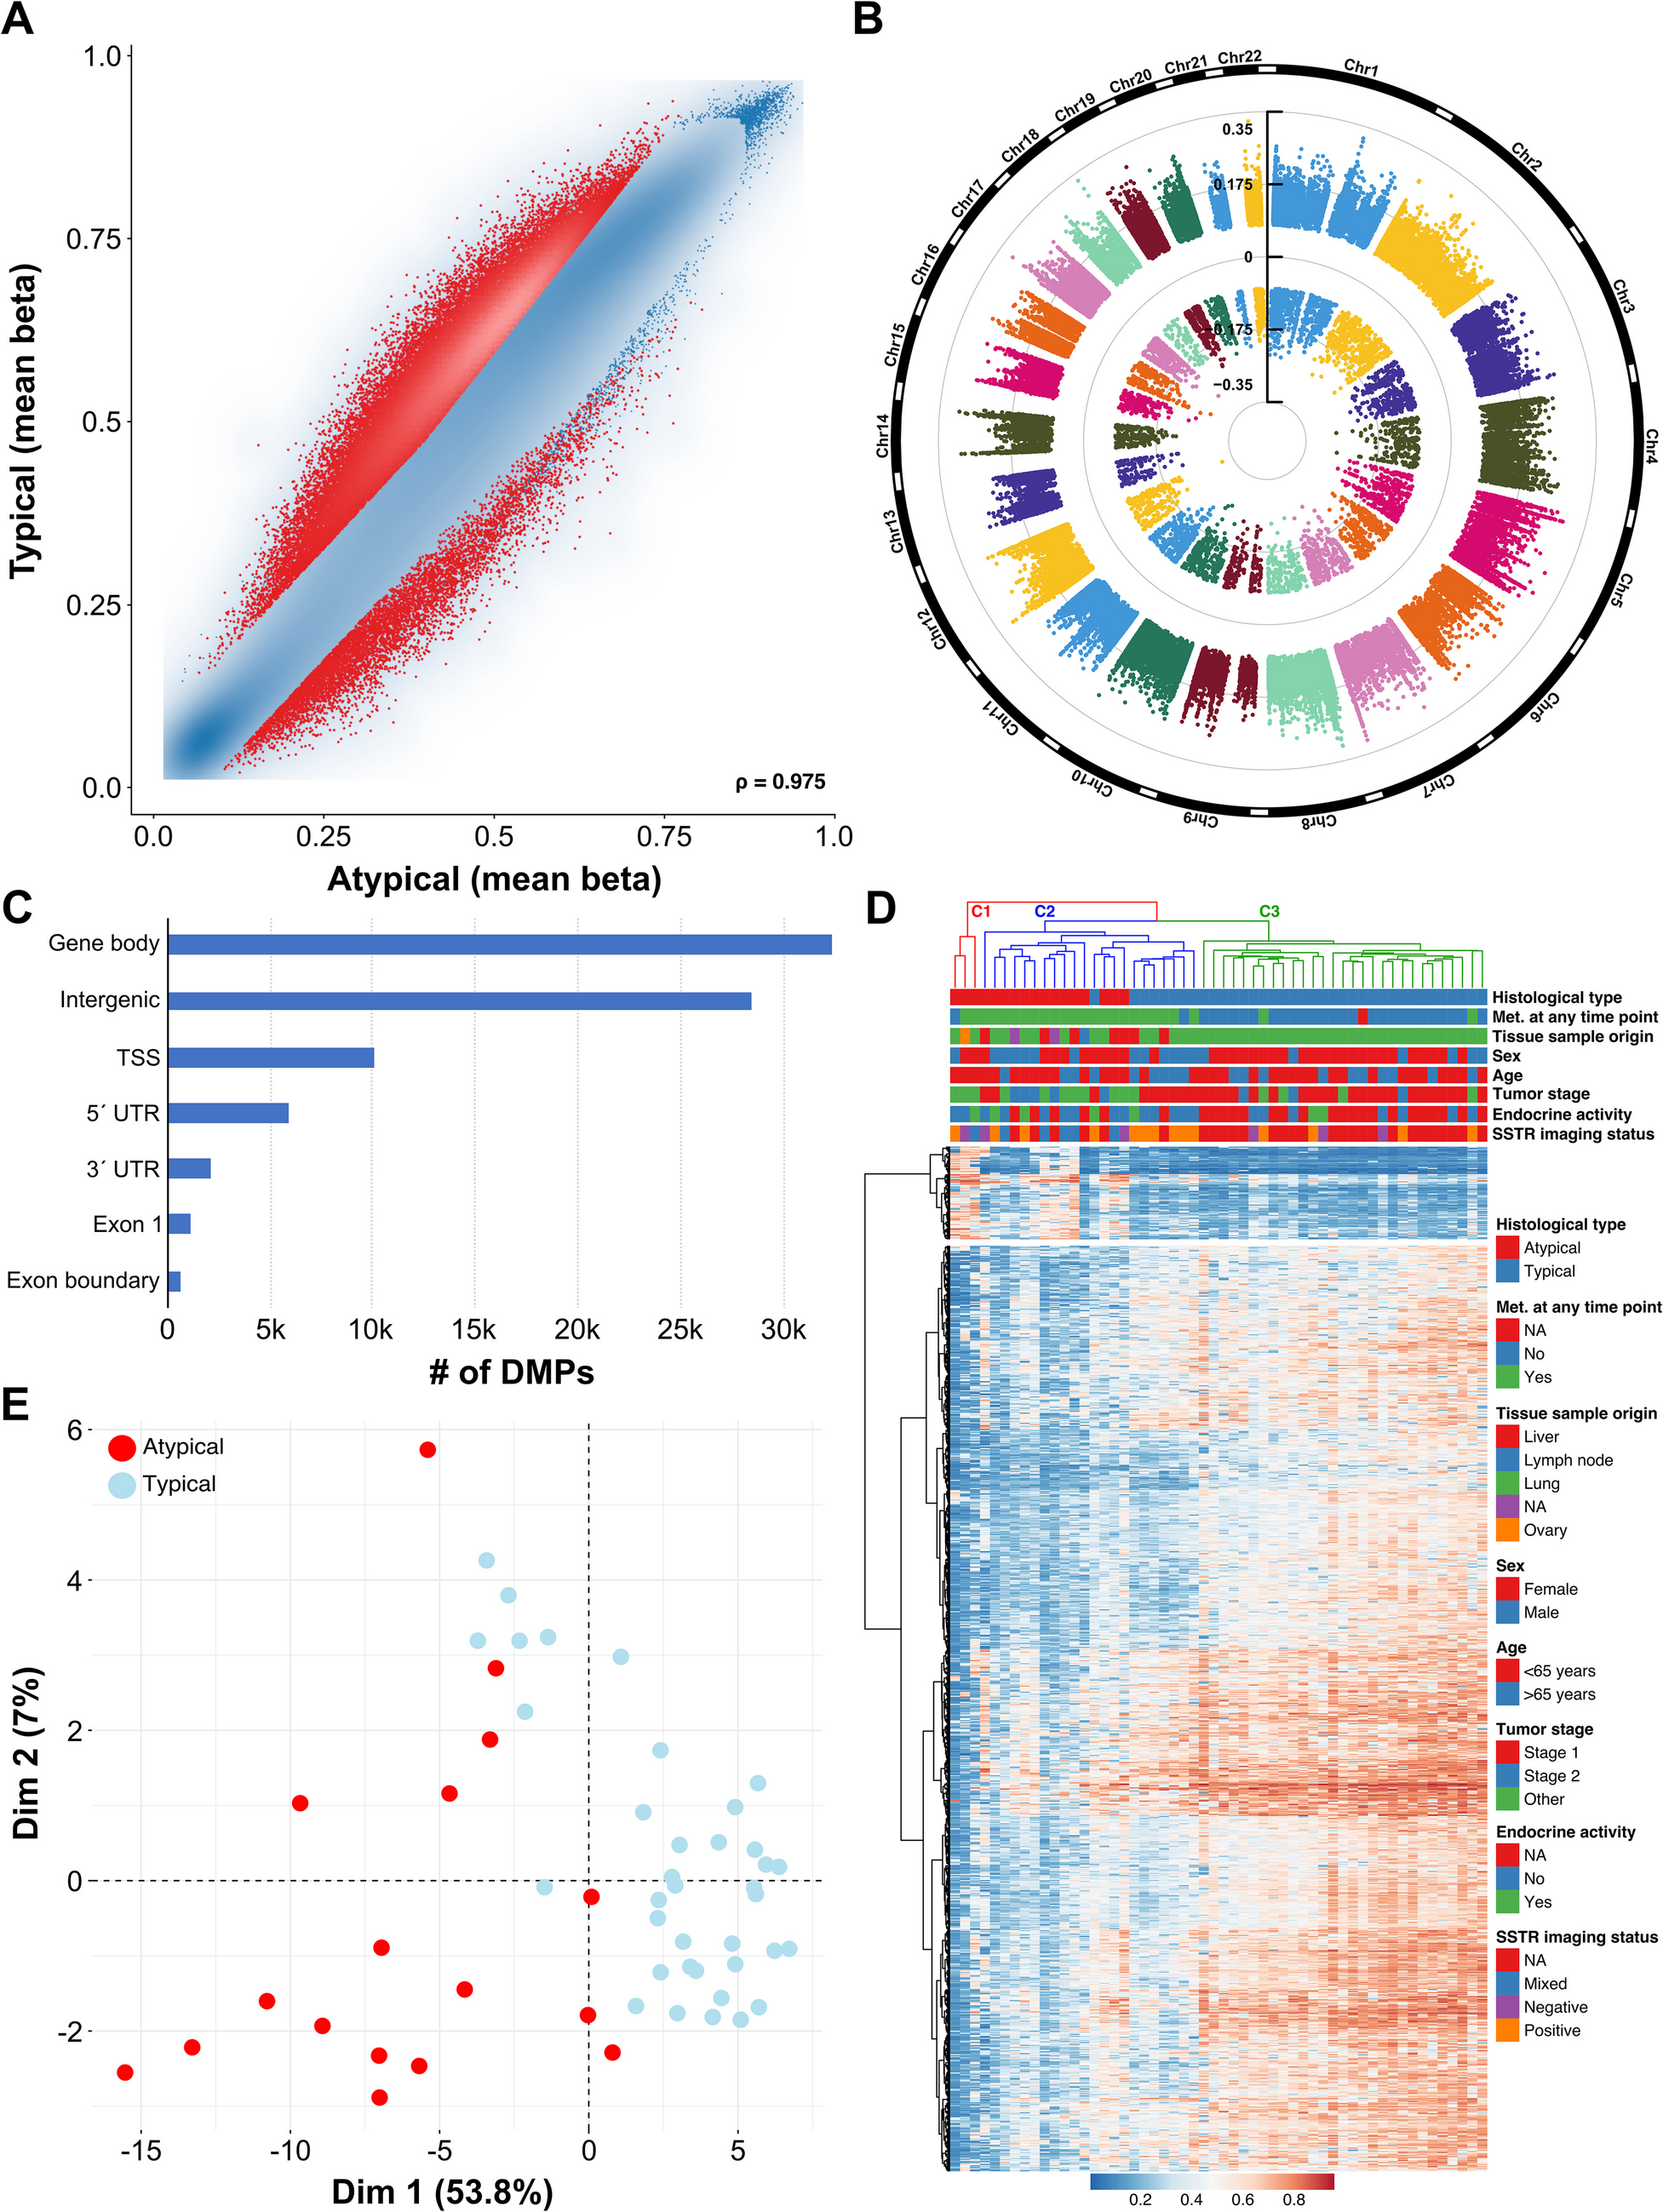
DNA Methylation in Typical Versus Atypical Lung NETTo characterize differences in the tumor methylomes within our lung NET cohort, we employed the Illumina MethylationEPIC BeadChip microarray technology. After quality control and probe filtering, 603.109 probes remained for further analysis. Differential methylation analyses between typical and atypical lung NET revealed substantial differences in both hypo- and hypermethylation (see Fig. 1A). These differentially methylated CpG probes (DMPs) were evenly spread over the chromosomes and were primarily located in gene bodies and in intergenic regions (40% and 35%, respectively, see Fig. 1B and C).
Fig. 1
DNA methylation analysis of lung NET patients. A Scatter plot of differentially methylated CpG sites (DMPs) between typical carcinoid (TC) and atypical carcinoid (AC). Each dot represents a unique CpG site, and the red dots represent DMPs. B Circular Manhattan plot of the chromosomal distribution of these DMPs. C Genomic locations of DMPs (absolute figures in thousands). D Heatmap showing the hierarchical clustering based on the top 1000 DMPs between patients with TC and AC. E Unsupervised clustering using principal component analysis (based on total variance)
Hierarchical cluster analysis of the TC and AC samples using the topmost 1000 probes (909 hypomethylated and 91 hypermethylated in AC) identified three distinct subgroups, see Fig. 1D. The largest cluster C3 (right) included only typical carcinoids (n = 29, 100%), which were almost exclusively non-metastasized (n = 26/29, 89.7%), whereas cluster 2 (middle) was enriched with atypical carcinoids (n = 14/22, 63.6%) and consisted entirely of patients with metastatic disease except one case (n = 21/22, 95.5%). Based on the dendrogram in Fig. 1D, C1 was separated early from the two other clusters, suggesting that these three AC are more dissimilar from the C2/C3 tumors (see Discussion).
Furthermore, unsupervised clustering based on total variance was conducted using principal component analysis (PCA), see Fig. 1E. PC1 accounted for 53.8% of the variation in the data and PC2 for 7%. While TC samples clustered more tightly, AC samples showed greater variation in their methylome data. A similar pattern became evident in a UMAP (Uniform Manifold Approximation and Projection) graph, see Figure S1. Most typical carcinoids clustered separately from atypical carcinoids in the UMAP, indicating that they have a distinct methylation pattern.
Potential Prognostic Role of Methylation ClustersThe identified clusters were examined for prognostic differences in PFS and OS. Only a few patients died during the follow-up period (n = 8), with two in the TC group and 6 in the AC subset. Hence, no clear OS difference was observed between TC and AC, see above. Consequently, the methylation clusters identified in Fig. 1D did not correspond to a statistically significant difference in prognosis, even though most events (n = 7) were recorded in cluster 2 (primarily atypical or metastatic carcinoids), with the median OS durations for C1 to C3 being 161.1, 224.1 months, and not reached, respectively, see Figure S2. In terms of therapies, everolimus was the most frequently applied drug (n = 10), but the survival results are restricted to a low number of patients (C1: n = 2, events = 2, median PFS 19.4; C2: n = 8, events = 6; median PFS 7.3 months; p = 0.8; C3: n = 0).
Functional Classification of Methylation Differences Between TC and ACFor functional characterization of genes affected by differential methylation, DMPs located either 1500 bp around the transcription start site or in the first exon were subjected to Gene Ontology (GO) enrichment analyses. Figure 2A shows the GO categories that are most significantly enriched. Methylation differences were most significant within genes involved in immune response and G protein-coupled receptor signaling (biological processes, BP), signaling receptor activity (molecular functions, MF), and cell periphery and plasma membrane (cellular components, CC).
Fig. 2
Functional classification. A Gene Ontology of the differentially methylated genes. FDR, false discovery rate; BP, biological process; MF, molecular function; CC, cellular component. B Heatmaps showing mean methylation of genes involved in G protein-coupled receptor signaling and cell adhesion in typical carcinoid (TC) and atypical carcinoid (AC) samples
Therefore, it was of interest to further analyze the G protein-coupled receptor signaling pathway, which includes the SSTR encoding genes SSTR1, SSTR2, SSTR3, SSTR4, and SSTR5. Between TC and AC, several genes showed differential methylation in their promoter regions (see Fig. 2B); however, SSTR-encoding genes were not affected by differential methylation. For the GO category cell adhesion, differentially methylated promoters are also shown.
Methylation Profiles According to Other NET CharacteristicsMetastatic CohortLooking only at metastatic lung NET, typical and atypical carcinoids clustered separately (7/10 and 13/15 in the two clusters, respectively) and showed methylation differences, see Figure S3A. Likewise, considering only the TC cohort (Figure S3B, clustering based on samples with metastasized at any time point yes versus no), separation of the same cases (except one case) allocated to C2 (Fig. 1) was found.
SSTR StatusAs shown in Fig. 3, methylation patterns of patients that were either positive or negative on SSTR imaging varied strongly. The differentially methylated CpG sites were regularly spread across the chromosomes and mostly located in gene bodies and intergenic regions, see Fig. 3B and C. In the cluster analysis using the top 1000 DMPs, we found that SSTR-negative tumors formed a separate methylation cluster (5/6 patients). Concordantly, several cell signaling GO categories were most significantly enriched, including G protein-coupled receptor signaling, serotonin receptor signaling, molecular transducer activity, and signaling receptor activity.
Fig. 3
DNA methylation differences based on SSTR imaging status. A Scatter plot of DMPs between SSTR-positive and -negative patients. B Chromosomal distribution and C genomic locations of these DMPs. D Gene Ontology of genes that showed differential methylation. E Hierarchical clustering using the topmost 1000 DMPs
Endocrine ActivitySimilarly, methylation differences between tumors with versus without endocrine activity are shown in Fig. 4. Lung NET with no endocrine activity exhibited hypermethylation in the majority of differentially methylated CpG sites, while few were hypomethylated, see Fig. 4A. The chromosomal distribution and genomic location of these CpG sites were similar to previous analyses, see Fig. 4B and C. Hierarchical clustering suggested that hormonally active tumors have distinct methylation profiles, since they formed a distinct cluster (7/8 samples), see Fig. 4E. As previously, GO terms concerning cell signaling were implicated, see Fig. 4D.
Fig. 4
DNA methylation differences based on endocrine activity. A Scatter plot of DMPs between lung NET with versus without endocrine activity. B Chromosomal location and C genomic position of these DMPs. D Gene Ontology of the genes affected by differential methylation. E Clustering of samples based on the topmost 1000 DMPs
Comments (0)