
Remember me
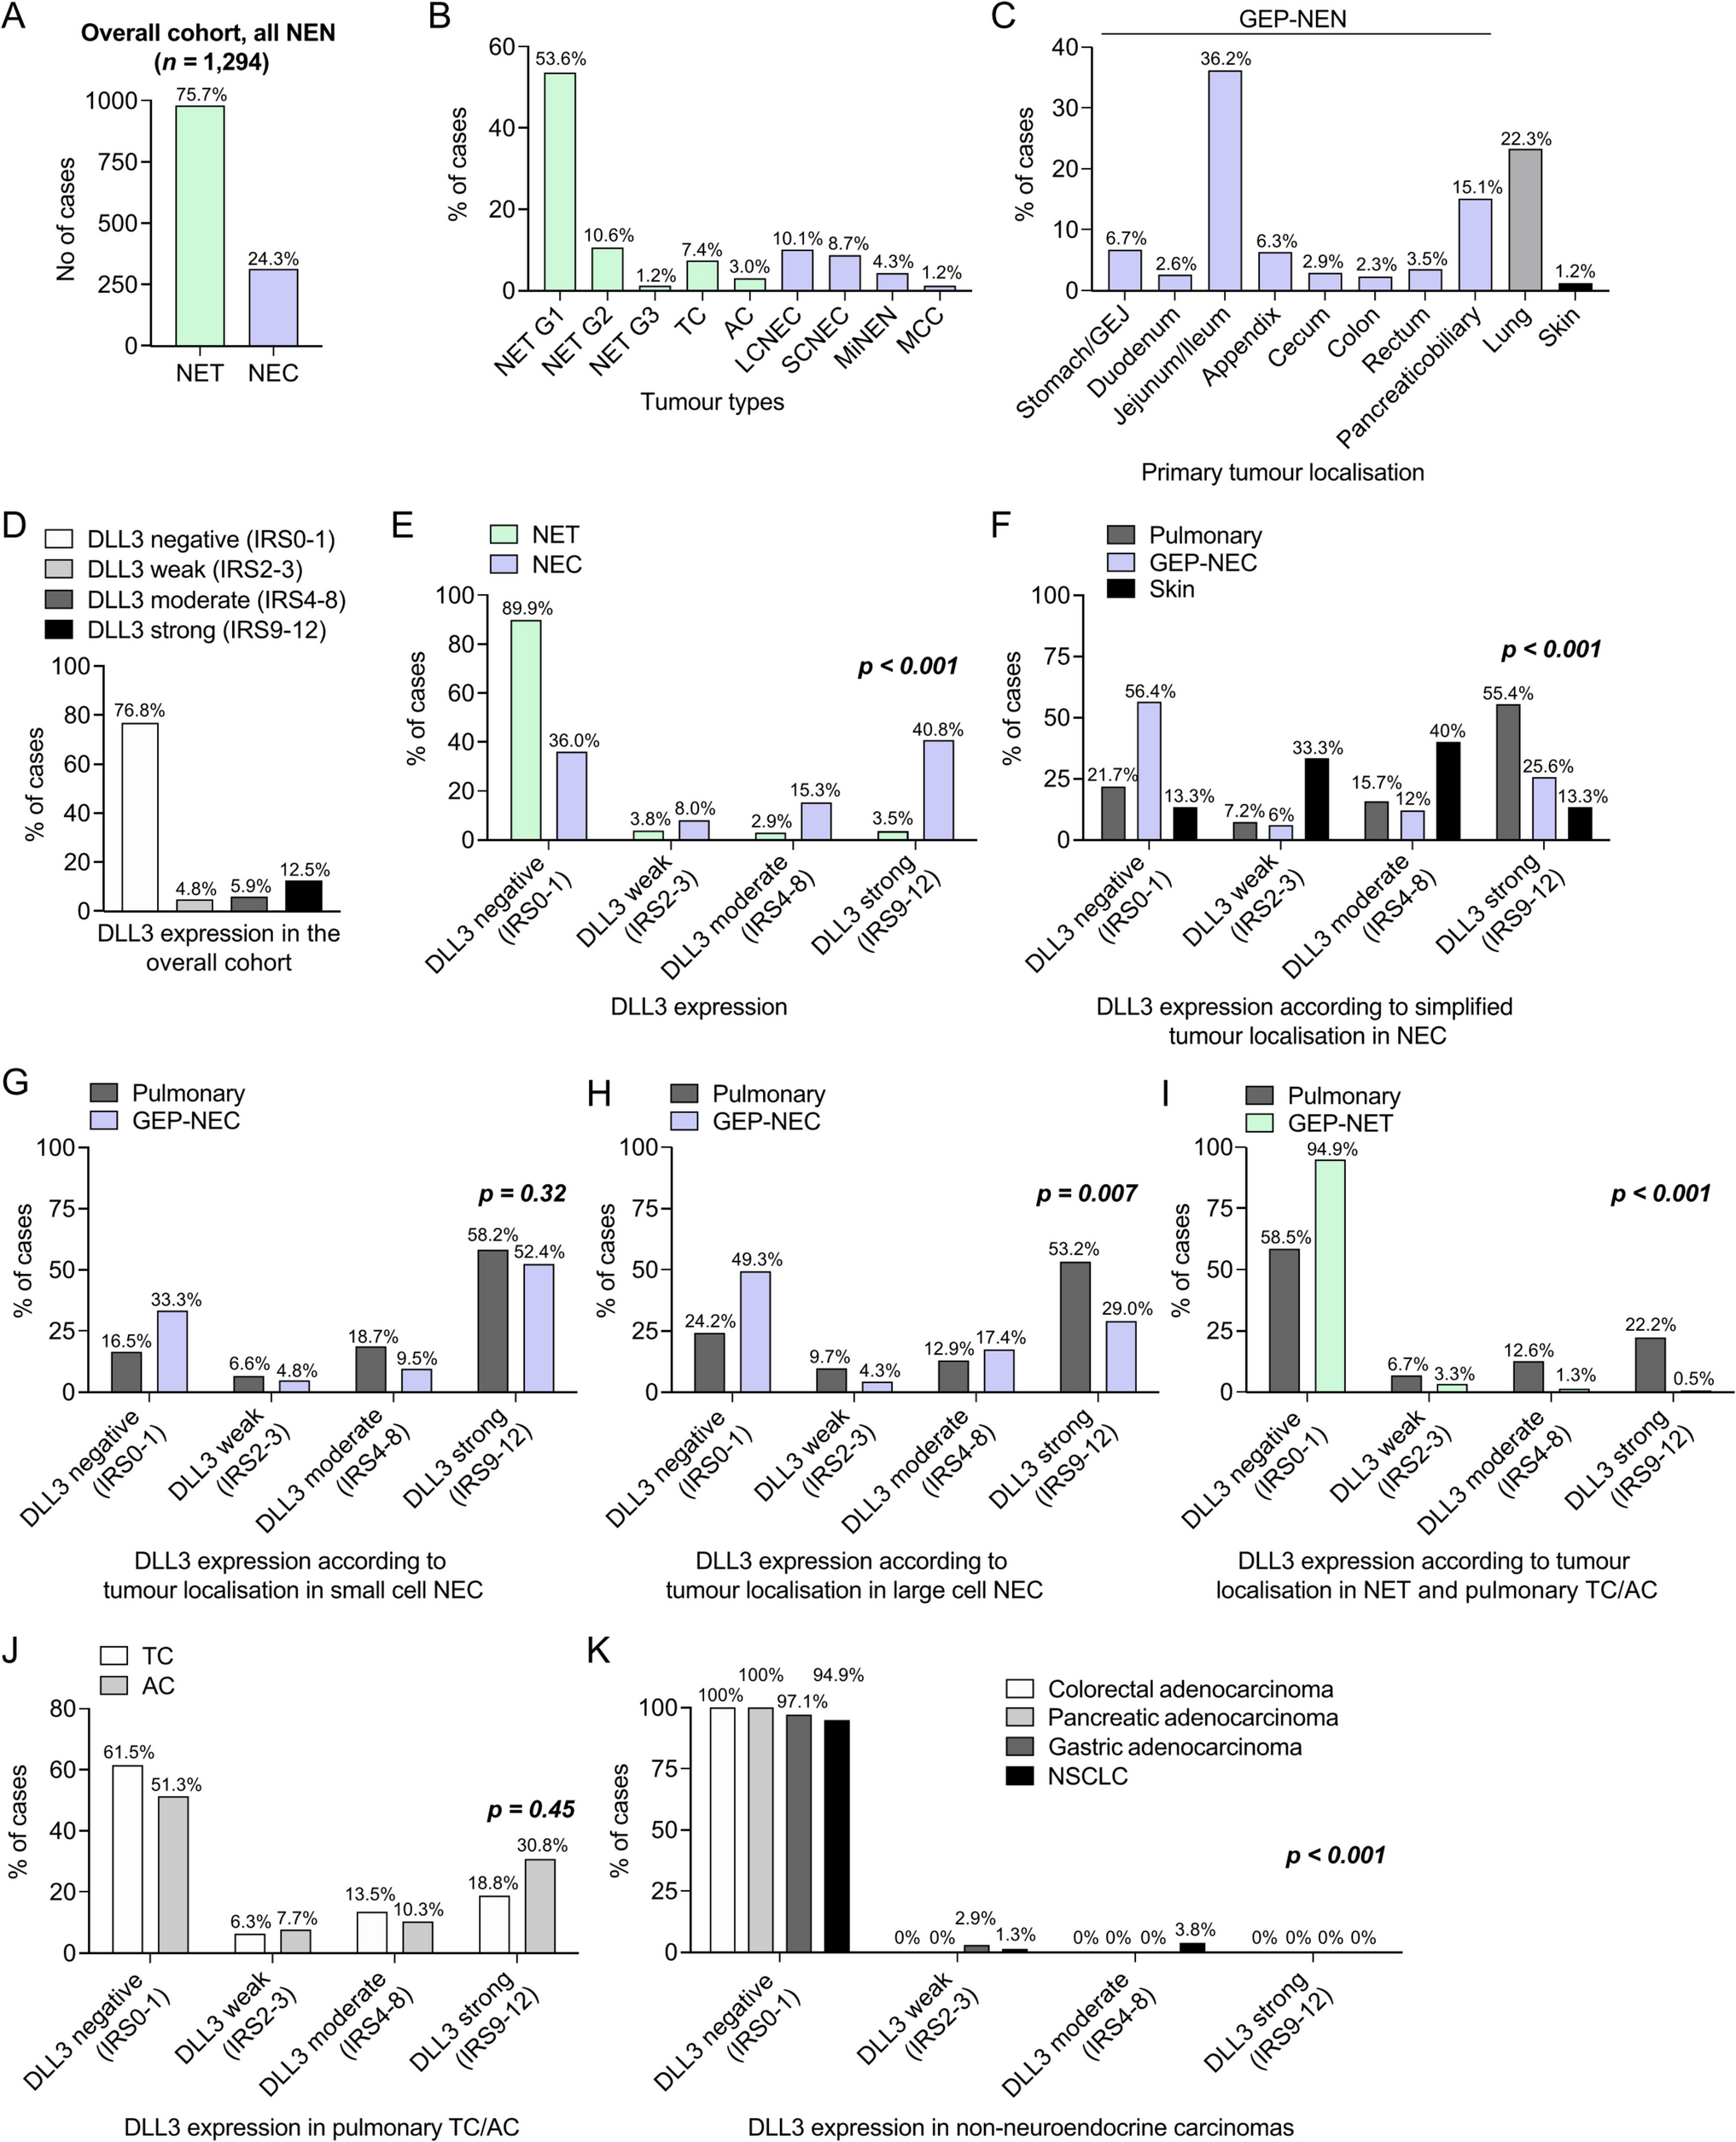
Our multicentric NEN cohort included 980 primary NET (75.7%, including pulmonary carcinoids) and 314 primary NEC (24.3%, Fig. 1A) and comprised 301 (23.3%) pulmonary, 978 (75.6%) gastroenteropancreatic NEN (GEP-NEN) and 15 (1.2%) cutaneous NEN (Merkel cell carcinomas, detailed localisation see Fig. 1C). Besides 803 (62.1%) unifocal NET from various sites, our cohort included 177 (13.7%) jejunoileal NET from 27 individual patients with multifocal jejunoileal NET [25]. Of the 314 NEC (166, 12.8% pulmonary/133, 10.3% GEP-NEC/15, 1.2% cutaneous), 131 (41.7%) were diagnosed as LCNEC, 112 (35.7%) were diagnosed as SCNEC and 56 (17.8%) were MiNEN along with 15 (4.8%) Merkel cell carcinomas. Among well-differentiated NEN, 693 (70.7%) NET were graded as G1, 137 (14.0%) as G2, and 15 (1.5%) as G3, in addition to 96 (9.8%) TC and 39 (4.0%) AC of the lung.
Fig. 1
Overview of the cohort and DLL3 expression in different NEN. A Frequency of NET (including AC/TC) and NEC (including MiNEN) in the overall cohort of 1294 NEN. B Frequency of different NET (G1/G2/G3, TC/AC) and NEC (SCNEC/LCNEC/MiNEN) subtypes in the overall cohort. C Detailed localisations of the investigated NEN in the overall cohort. D Frequency of DLL3 expression groups according to the IRS in the overall cohort (all NEN). E General comparison of DLL3 expression groups according to the IRS between NET and NEC. F Frequency of DLL3 expression groups according to the IRS in NEC between different simplified localisations (pulmonary, GEP-NEC, skin). G Frequency of DLL3 expression groups according to the IRS in pulmonary and gastroenteropancreatic SCNEC. H Frequency of DLL3 expression groups according to the IRS in pulmonary and gastroenteropancreatic LCNEC. I Frequency of DLL3 expression groups according to the IRS in gastroenteropancreatic NET and pulmonary TC/AC. J Frequency of DLL3 expression groups according to the IRS in pulmonary TC and AC. K Frequency of DLL3 expression groups according to the IRS in pulmonary and gastroenteropancreatic non-neuroendocrine carcinomas. DLL3, Delta-like-protein 3; NEN, neuroendocrine neoplasm; NET, neuroendocrine tumour; NEC, neuroendocrine carcinoma, LCNEC, large cell neuroendocrine carcinoma; SCNEC, small cell neuroendocrine carcinoma; MiNEN, mixed neuroendocrine-non-neuroendocrine carcinoma; TC, typical carcinoid; AC, atypical carcinoid; GEP, gastroenteropancreatic; MCC, Merkel cell carcinoma
The additional NEN metastases cohort comprised metastases of 51 (76.1%) metastasised NET and 16 (23.9%) NEC. Regarding metastatic localisation, 30 (44.8%) metastases were located in the liver, 32 (47.8%) in lymph nodes and five (7.5%) at other metastatic sides (peritoneum, soft tissue, adrenal gland) (for details regarding the cohort, see Supplementary Table 2).
DLL3 Expression in the Overall NEN CohortExpression of DLL3 (any degree) was observed in 300/1294 (23.2%) NEN, while 994 (76.8%) neoplasms were DLL3 negative (Fig. 1D). According to the IRS, 62 (4.8%) neoplasms showed a weak (IRS 2–3), 76 (5.9%) showed a moderate (IRS 4–8) and 162 (12.5%) showed a strong expression (IRS 9–12). Examples of the different DLL3 expression groups according to the IRS are given in Fig. 2 for pulmonary NEN and in Fig. 3 for GEP-NEN.
Fig. 2
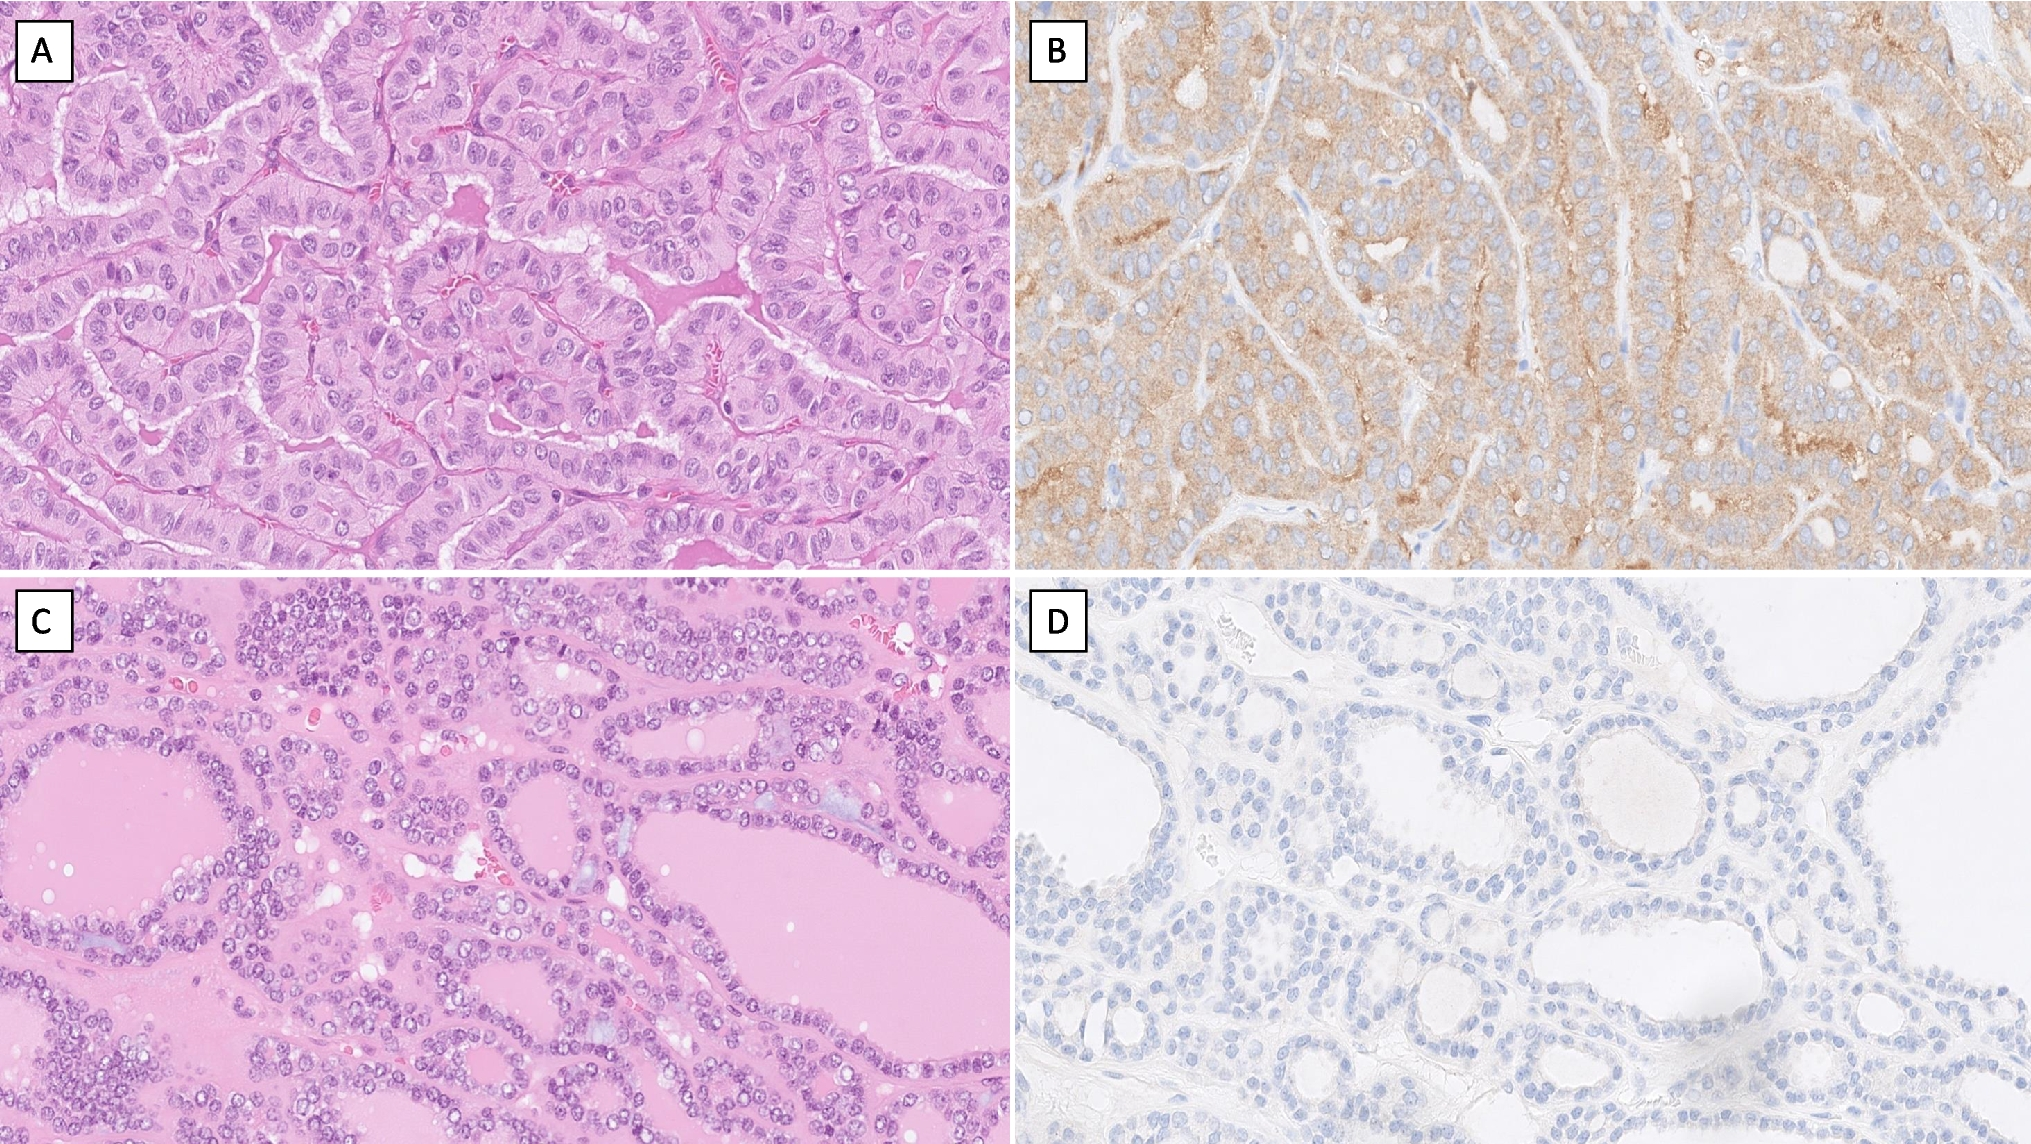
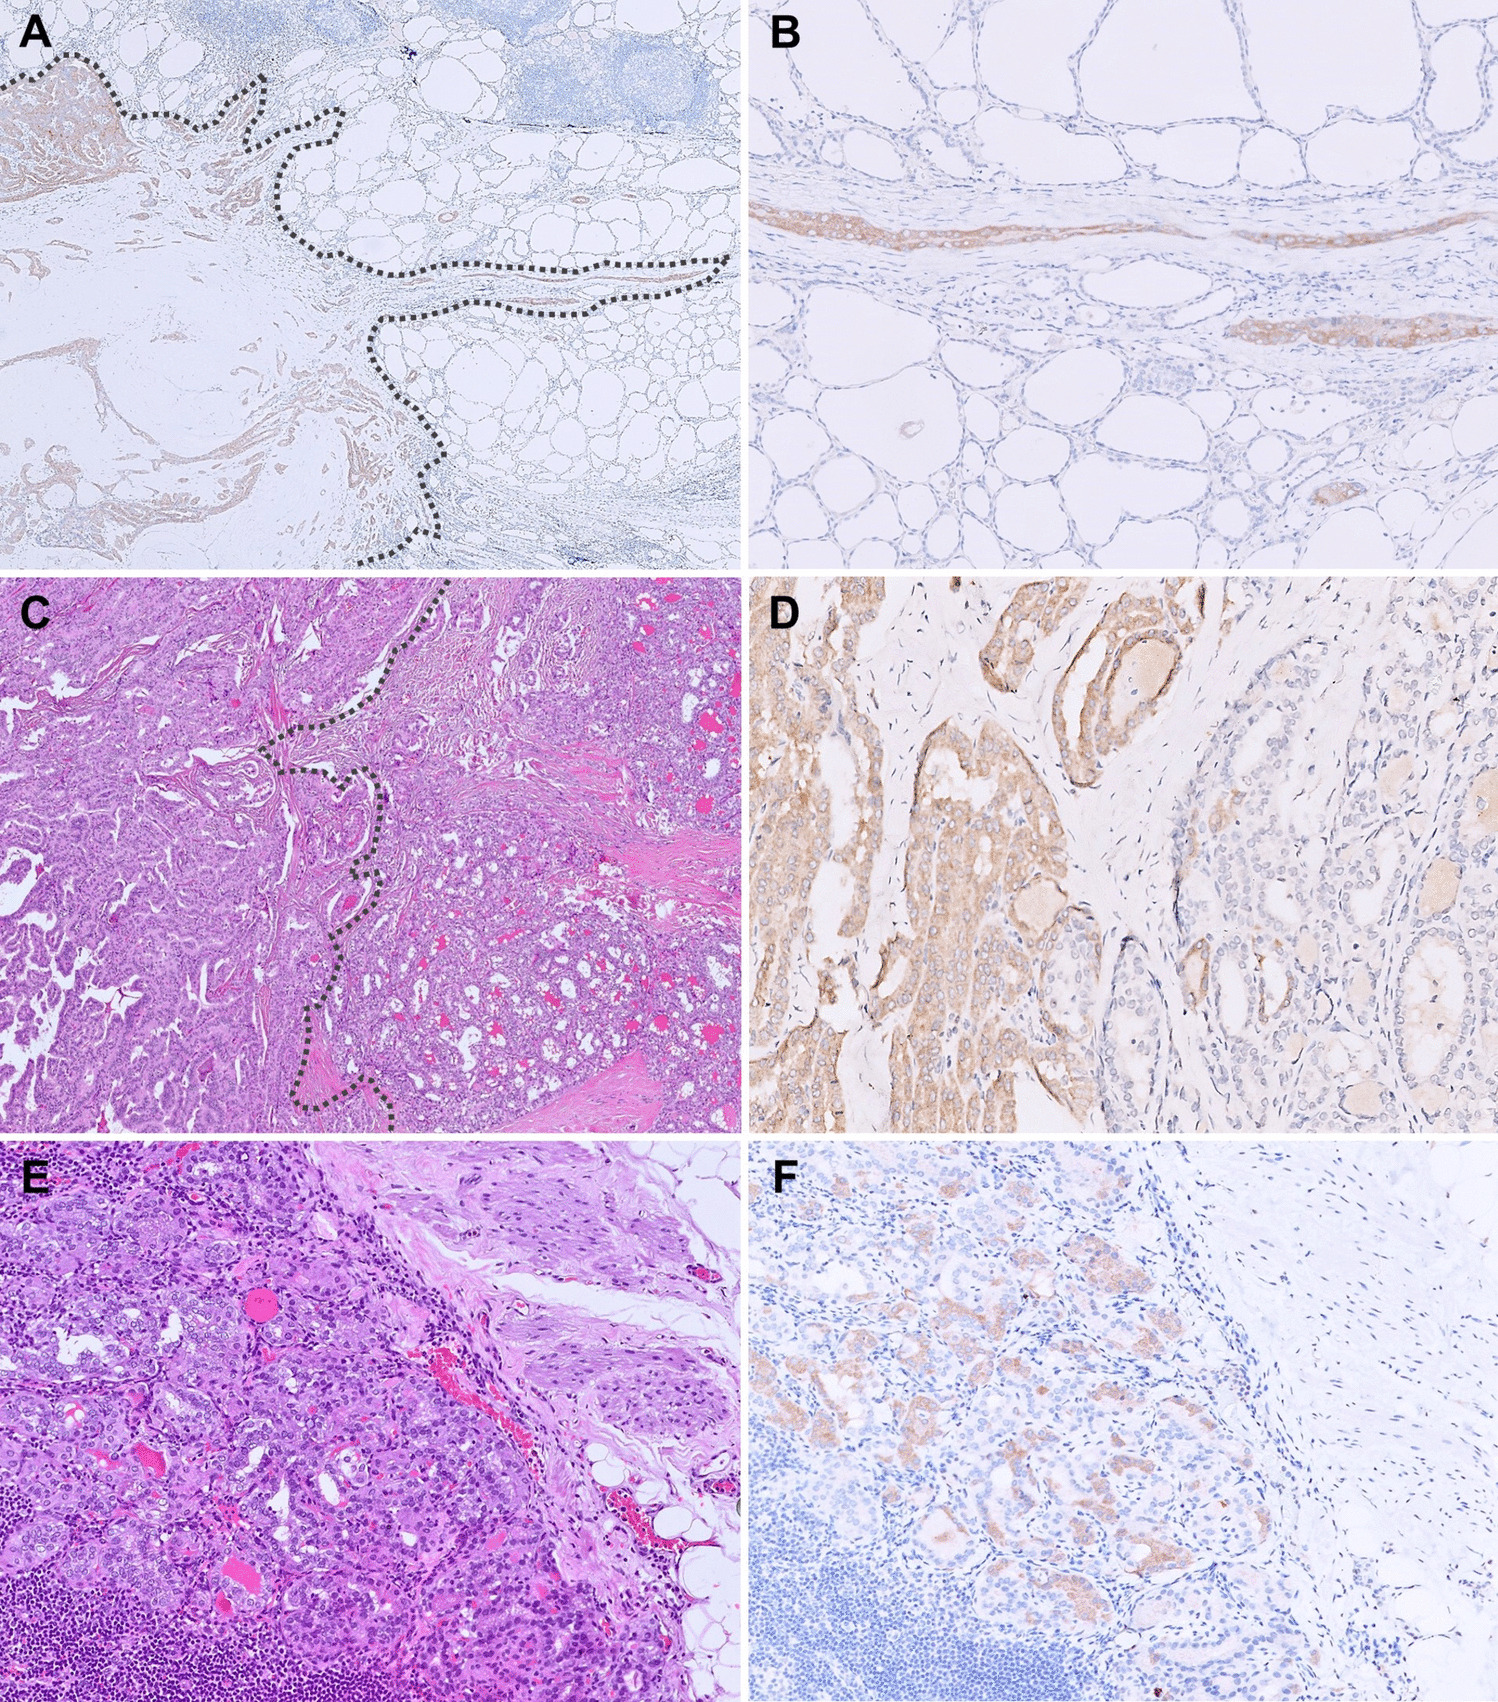
Expression of DLL3 in pulmonary NEN. A–E Pulmonary carcinoids (HE, A). B Example of pulmonary typical carcinoid with complete absence of DLL3 expression (IRS 0). C Example of weak DLL3 expression in pulmonary typical carcinoid showing a weak expression intensity in > 10% of tumour cells (IRS 2). D Moderate DLL3 expression in pulmonary typical carcinoid with up to strong cytoplasmatic staining intensity, which is restricted to > 10% of tumour cells (IRS 6). E Strong DLL3-expression in pulmonary atypical carcinoid with strong expression intensity in > 80% of carcinoid cells (IRS 12). F–J Examples of different pulmonary LCNEC (HE, F). G Example of negative DLL3 expression in pulmonary LCNEC without any cytoplasmatic DLL3 expression (IRS 0). H Pulmonary LCNEC with weak DLL3-expression demonstrating an up to strong staining intensity in < 10% of carcinoma cells (IRS 3). I Moderate DLL3 expression in pulmonary LCNEC with strong staining intensity in > 10% of tumour cells (IRS 6). J Example of pulmonary LCNEC with strong cytoplasmatic staining reaction in > 80% of carcinoma cells falling into strong DLL3 expression group (IRS 12). K–O Different pulmonary SCNEC (K, HE). L Pulmonary SCNEC with no expression of DLL3 at all (IRS 0). M Example of weak DLL3 expression demonstrating up to strong staining reaction in < 10% of tumour cells (IRS 3). N Moderate DLL3 expression in pulmonary SCNEC with up to strong cytoplasmatic staining reaction in > 10% of tumour cells (IRS 6). O Example of pulmonary SCNEC with strong staining reaction in almost all carcinoma cells meaning an overall strong DLL3 expression (IRS 12). Overview: × 20 magnification, Inlay: × 100 magnification. HE, hematoxylin and eosin; DLL3, Delta-like-protein 3; IRS, immunoreactive score; NEN, neuroendocrine neoplasm; LCNEC, large-cell neuroendocrine carcinoma; SCNEC, small-cell neuroendocrine carcinoma
Fig. 3
DLL3 expression in gastroenteropancreatic NEN. A–E Different pancreatic NET (HE, A). B Example of pancreatic NET with complete absence of DLL3 expression (IRS 0). C Weak DLL3 expression in pancreatic NET with an up to moderate cytoplasmatic staining reaction in < 10% of tumour cells (IRS 2). D Example of pancreatic NET with moderate expression intensity in > 10% of tumour cells meaning a moderate DLL3 expression (IRS 4). E Strong DLL3 expression in pancreatic NET with strong staining intensity in > 50% of tumour cells (IRS 9). F–J Examples of DLL3 expression in different GEP-LCNEC (HE, F). G Example of pancreatic LCNEC with complete absence of DLL3 expression (IRS 0). H Example of weak DLL3 expression in rectal LCNEC with an up to strong expression intensity in < 10% of carcinoma cells (IRS 3). I Moderate DLL3 expression in rectal LCNEC demonstrating an up to strong staining intensity in > 10% of tumour cells (IRS 6). J Example of pancreatic LCNEC with strong cytoplasmatic staining reaction in almost all tumour cells meaning a strong DLL3 expression (IRS 12). K–O SCNEC of different sides of the GEP (K, HE). L Example of SCNEC in colon with no expression of DLL3 at all (IRS 0). M SCNEC of the colon demonstrating a weak staining reaction in > 10% of tumour cells corresponding to an overall weak DLL3 expression (IRS 2). N Moderate DLL3 expression in rectal SCNEC showing a moderate staining reaction in > 50% of carcinoma cells (IRS 6). O Example of gastric SCNEC with strong DLL3 expression in almost all tumour cells (IRS 12). Overview: × 20 magnification, Inlay: × 100 magnification. HE, hematoxylin and eosin; DLL3, Delta-like-protein 3; IRS, immunoreactive score; NEN, neuroendocrine neoplasm; LCNEC, large-cell neuroendocrine carcinoma; SCNEC, small-cell neuroendocrine carcinoma; GEP, gastroenteropancreatic
DLL3 Expression in NECDLL3 was expressed in 201/314 (64.0%) NEC. SCNEC (90/112, 80.4%) and Merkel cell carcinoma (13/15, 86.7%) showed a significantly higher frequency of DLL3 expression (any degree; p < 0.001) compared to LCNEC (82/131, 62.6%) and MiNEN (16/56, 28.6%). In terms of expression intensity, the rate of a strong DLL3 expression was significantly pronounced in SCNEC (64/112, 57.1%; p < 0.001) compared to LCNEC. In MiNEN, DLL3 expression was predominantly concordant across components when all expression intensities were considered, with concordance observed in 90% of the cases. Notably, when DLL3 positivity was present, the non-neuroendocrine component consistently displayed weaker expression intensity than the NEC component (Supplementary Fig. 1).
Pulmonary NEC (130/166, 78.3%; p < 0.001) showed a significantly increased rate of general DLL3 expression compared to GEP-NEC (58/133, 43.6%; p < 0.001), and also, the rate of strongly positive cases (pulmonary NEC: 92/166, 55.4% vs. GEP-NEC: 34/133, 25.6%; p < 0.001) was significantly enriched in pulmonary NEC (Fig. 1F). When we analysed pulmonary SCNEC vs. extrapulmonary SCNEC separately, we observed no significant differences (p = 0.32) in DLL3 expression (Fig. 1G). In contrast, pulmonary LCNEC (p = 0.007) and MiNEN (p = 0.04) were significantly more often DLL3 positive compared to their extrapulmonary counterparts (Fig. 1H). For detailed distribution of DLL3 expression groups in NEC/MiNEN according to their detailed anatomic sides also see Supplementary Fig. 2A.
DLL3 Expression in NET and Pulmonary TC/ACDLL3 was expressed in 99/980 (10.1%) NET/TC/AC, with 37 (3.8%) showing a weak, 28 (2.9%) showing a moderate and 34 (3.5%) displaying a strong expression, while 881 (89.9%) neoplasms were completely DLL3 negative.
Regarding tumour localisation, pulmonary AC (19/39, 48.7%) and TC (37/96, 38.5%) showed a much higher rate of DLL3 positivity compared to GEP-NET (43/845, 5.1%; p < 0.001). While the majority of DLL3 positive pulmonary carcinoids (DLL3 positive TC and AC: 56/135, 41.5%) showed a strong (30/135; 22.2%) or moderate (17/135; 12.6%) expression (p < 0.001), the majority of DLL3 positive GEP-NET showed a weak expression (28/845, 3.3%) (Fig. 1I–J, Supplementary Fig. 2B, Supplementary Table 1).
In pulmonary carcinoids, we did not observe significant differences in general DLL3 expression (p = 0.28) or the distribution of DLL3 expression groups (p = 0.45) between TC and AC (Fig. 1J). In GEP-NET, NET G3 (8/15, 53.3%) showed a much higher fraction of DLL3 expression compared to NET G2 (6/15, 4.4%) and NET G1 (29/693, 4.2%; p < 0.001). For detailed distribution of DLL3 expression groups in NET/TC/AC according to their anatomic sides, also see Supplementary Fig. 2B and Supplementary Table 1.
DLL3 Expression in NET Vs. NECIn the overall cohort, general DLL3 expression (any degree) was far more frequent in NEC (201/314; 64.0%; p < 0.001) than in NET and pulmonary carcinoids (99/980; 10.1%), also with much higher frequencies of moderate and strongly positive NEC (NEC: 176/314, 56.1%; NET/TC/AC: 62/980, 6.3%; p < 0.001) (Fig. 1E).
In separate analyses of both pulmonary and GEP-NEN, DLL3 expression was again strongly associated with NEC (p < 0.001, respectively) with higher fractions of DLL3 expression in pulmonary NEC (130/166, 78.3%) compared to GEP-NEC (58/133, 43.6%).
The comparison between GEP-NET G3 and GEP-NEC revealed no significant differences when all intensities of DLL3 expression were considered (8/15 DLL3-positive GEP-NET G3 vs. 58/133 DLL3-positive GEP-NEC; p = 0.508). However, strong DLL3 expression was predominantly observed in GEP-NEC, while GEP-NET G3 generally displayed lower DLL3 expression intensity, with only one case showing strong expression (1/15 strongly DLL3-positive GEP-NET G3 vs. 34/133 strongly DLL3-positive GEP-NEC; p = 0.003).
DLL3 Expression in Primary NEN Vs. MetastasesIn exploratory analyses of DLL3 expression between primary NEN and their corresponding metastases, we observed a high concordance. Overall DLL3 expression (positive vs. negative) was concordant in 92.5% of the paired samples (62/67, p < 0.001). When evaluating specific DLL3 expression groups, the identical IRS score was observed in 91% of the paired samples (61/67, p < 0.001). Among the six pairs with changes in DLL3 expression between the primary tumour and metastasis, an increase in DLL3 expression was observed in five cases, mostly from a DLL3 negative primary to a DLL3 positive metastasis. In contrast, a single case of pulmonary LCNEC exhibited a complete loss of DLL3 expression in its corresponding metastasis. For further details, see Supplementary Table 2 and Supplementary Fig. 3.
Prognostic Implications of DLL3 Expression in Pulmonary and Extrapulmonary NENDLL3 expression (any degree) was associated with worse OS in the overall NEN cohort (p < 0.001), as expected due to the association of DLL3 expression with NEC. No statistical differences between the different DLL3 expression groups were noted (data not shown).
In separate statistical analyses, no association of DLL3 expression with survival was observed in NEC (p = 0.32; data not shown), which was also the case in separate analyses in pulmonary (p = 0.708) and GEP-NEC (p = 0.87) (Supplementary Fig. 4A–B). In univariable analyses, DLL3 positive pulmonary TC/AC (p = 0.005; median OS not reached) (Supplementary Fig. 4C) and GEP-NET (p = 0.018; median OS: 80 vs. 106 months for DLL3-positive vs. DLL3-negative GEP-NET) (Supplementary Fig. 4D) showed shorter OS. However, this association was not retained in multivariable analyses adjusting for pTNM stage, grade, sex, and age (p = n.s. for both pulmonary carcinoids and GEP-NET; data not shown).
DLL3 Expression in Non-neuroendocrine CarcinomasWe observed the expression of DLL3 in a collective of primary resected 479 non-neuroendocrine carcinomas including colorectal, gastric, pancreatic, and pulmonary carcinomas. Expression of DLL3 was rare in non-neuroendocrine carcinomas (6/479, 1.3%) with two gastric adenocarcinomas showing a weak expression (2/69, 2.9%) and four positive pulmonary carcinomas—one weak (1.3%), three moderate (3.8%)—while a strong expression was never observed and all colorectal and pancreatic adenocarcinomas were entirely negative (Fig. 1J).
Comments (0)