
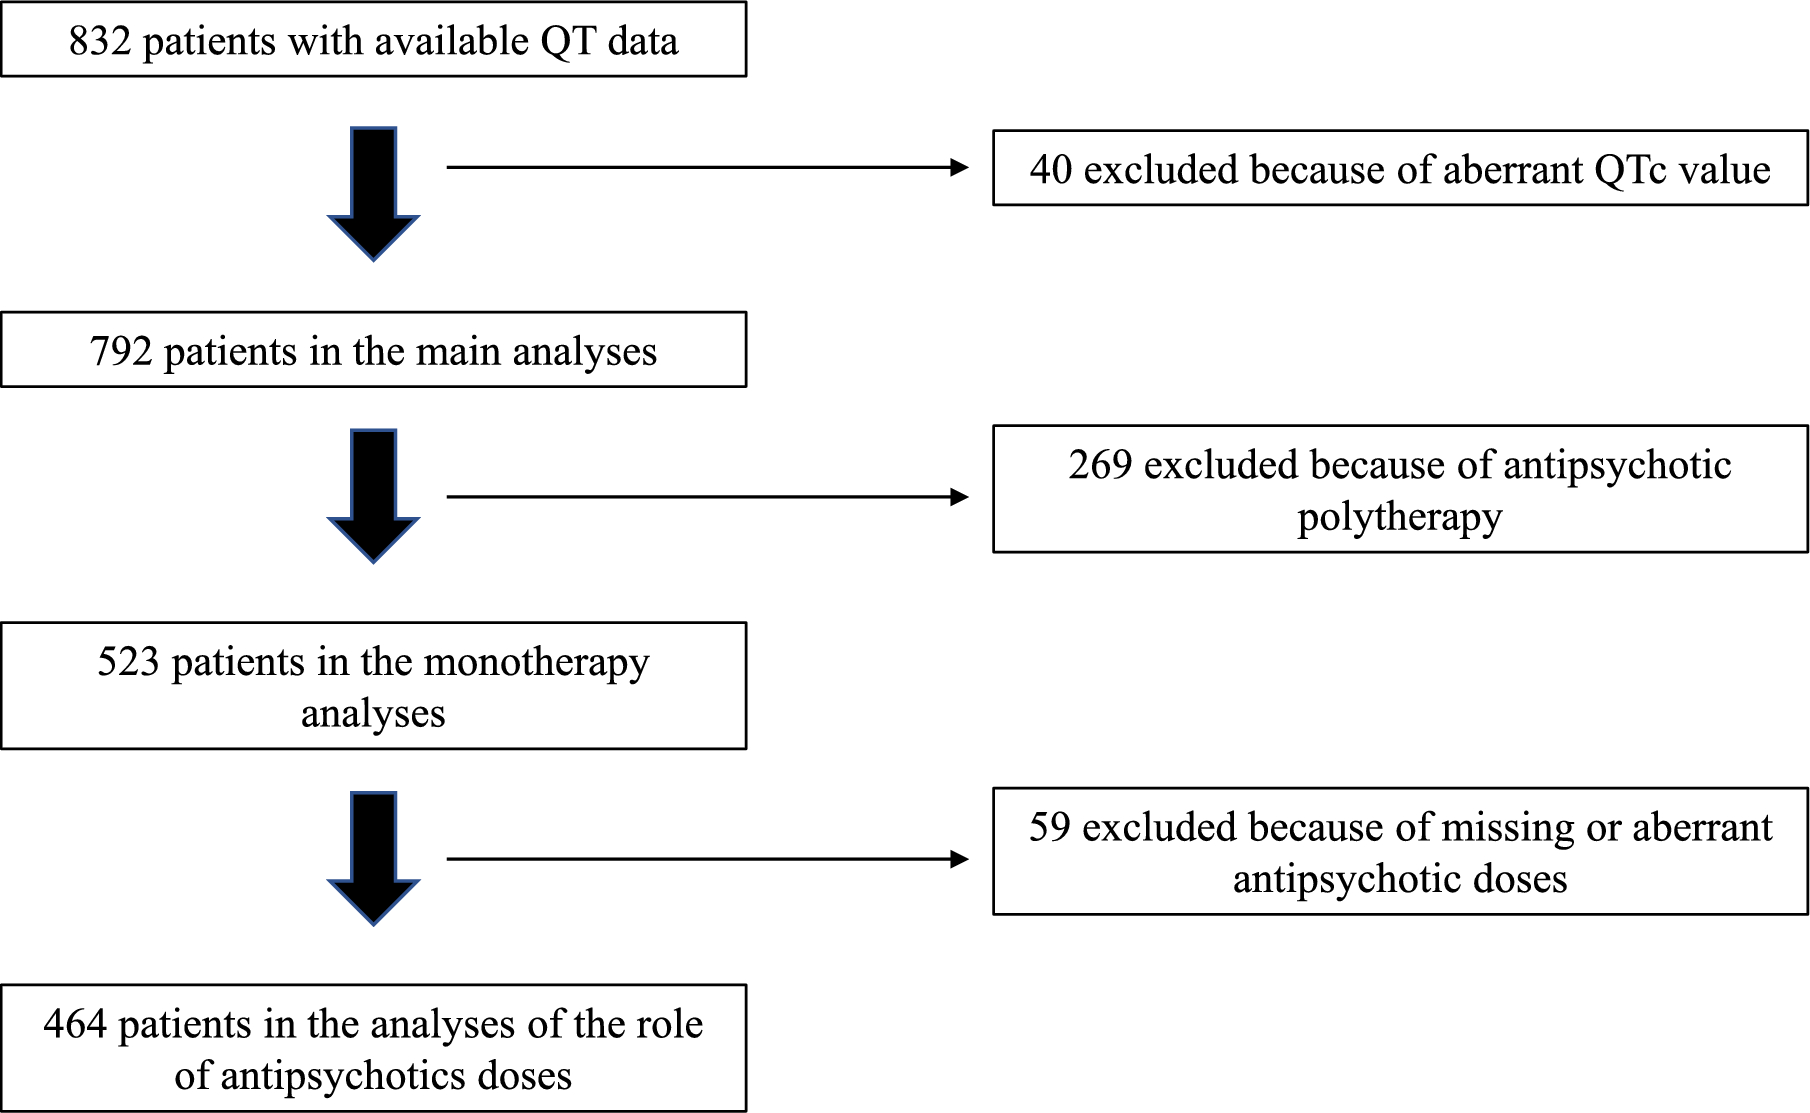
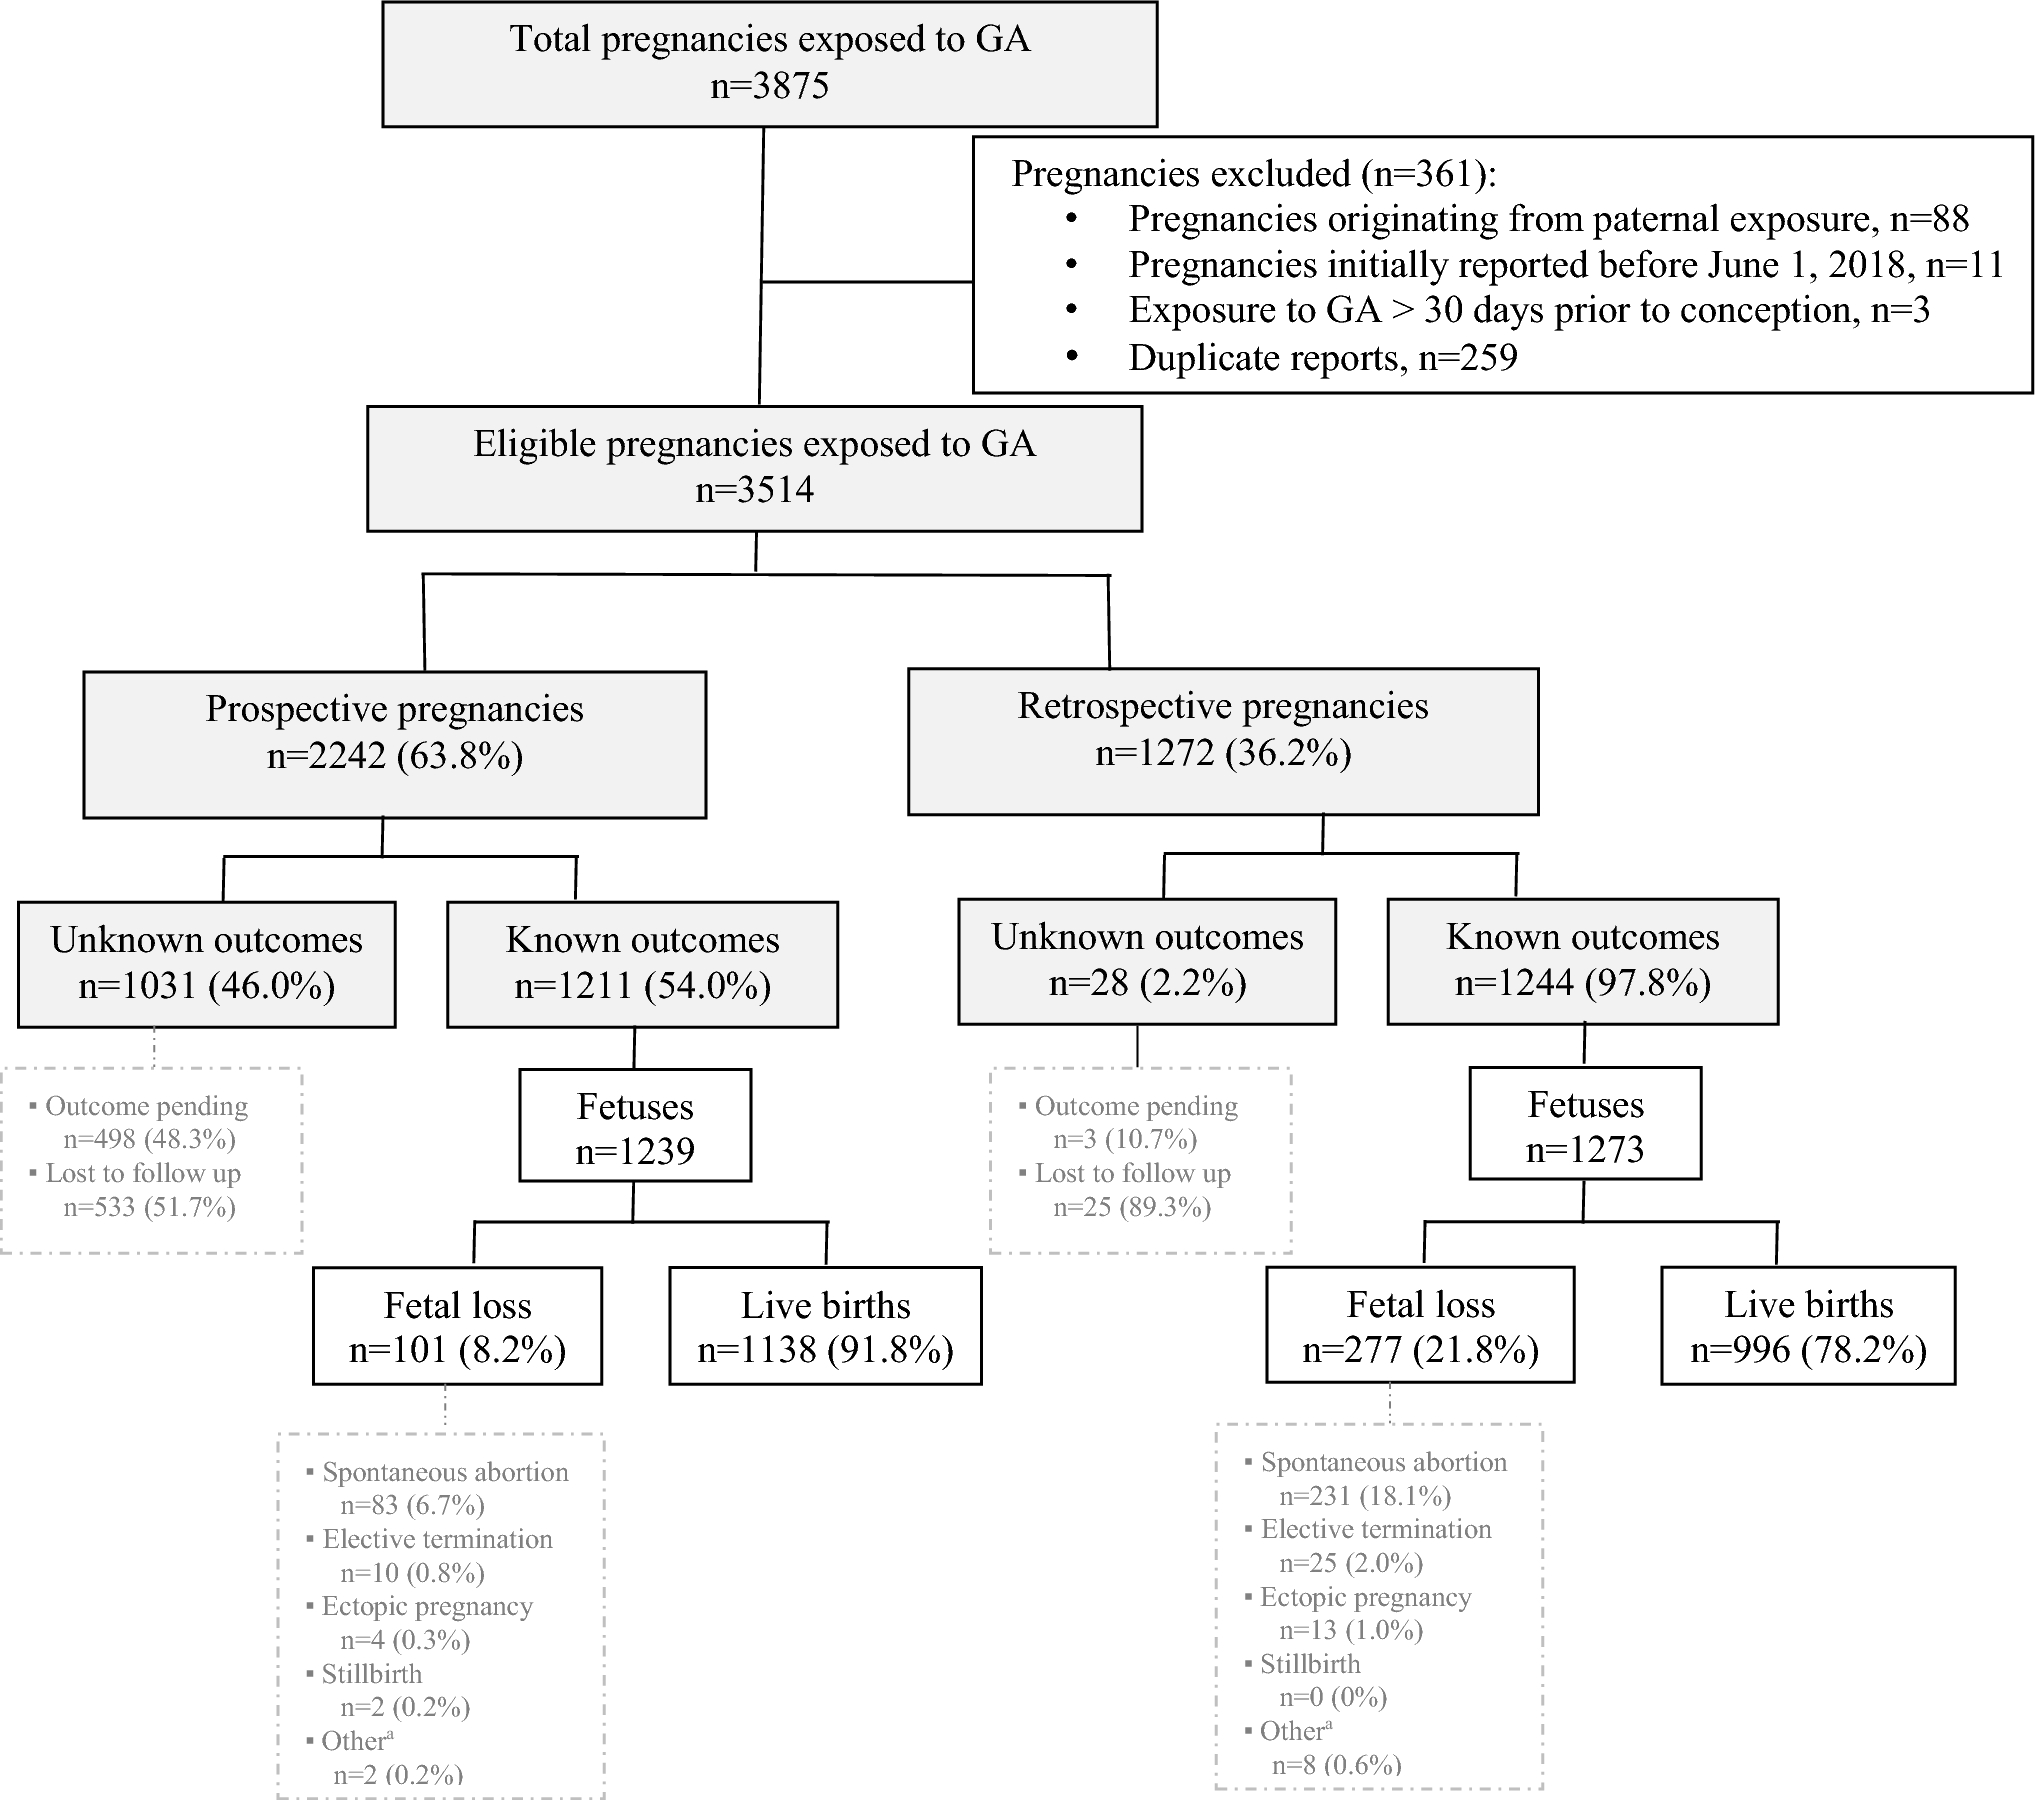
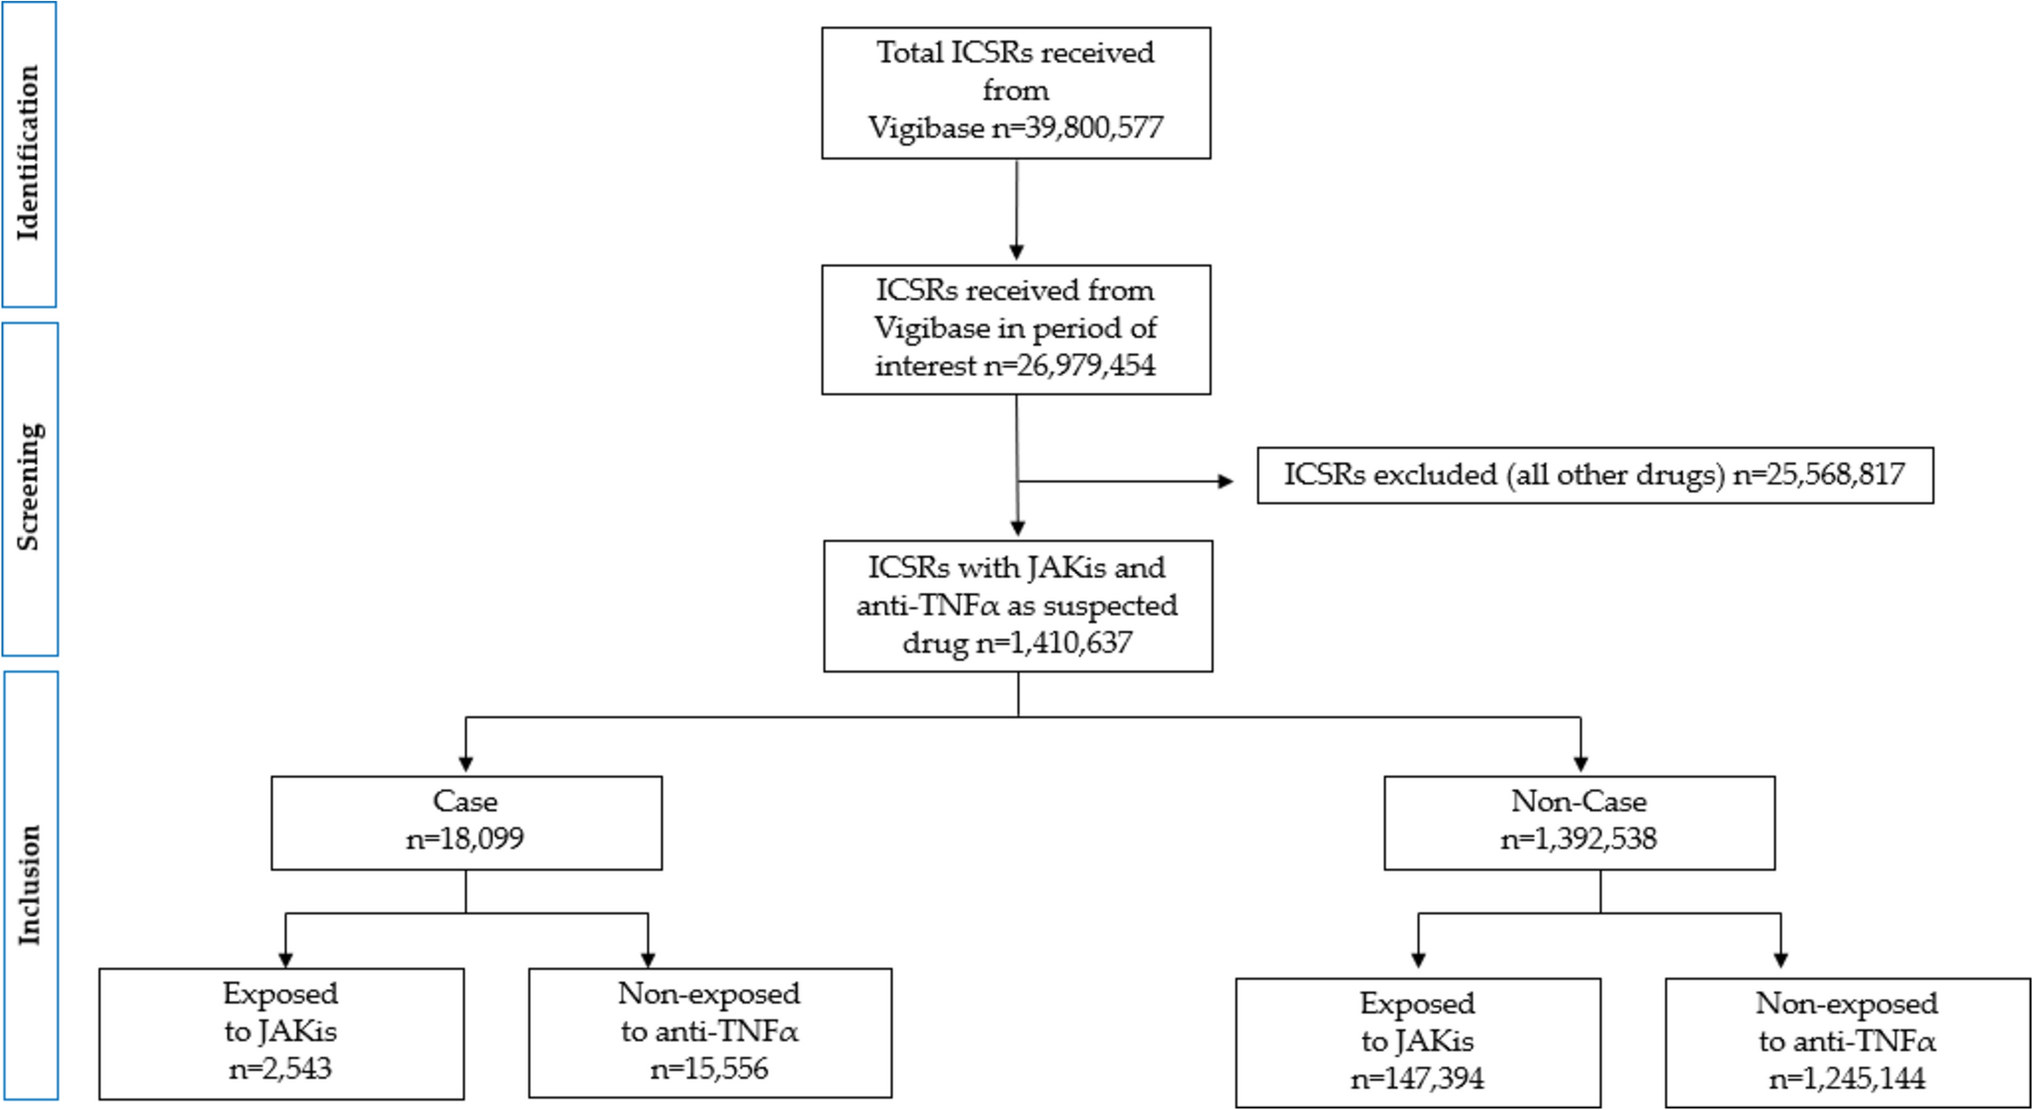
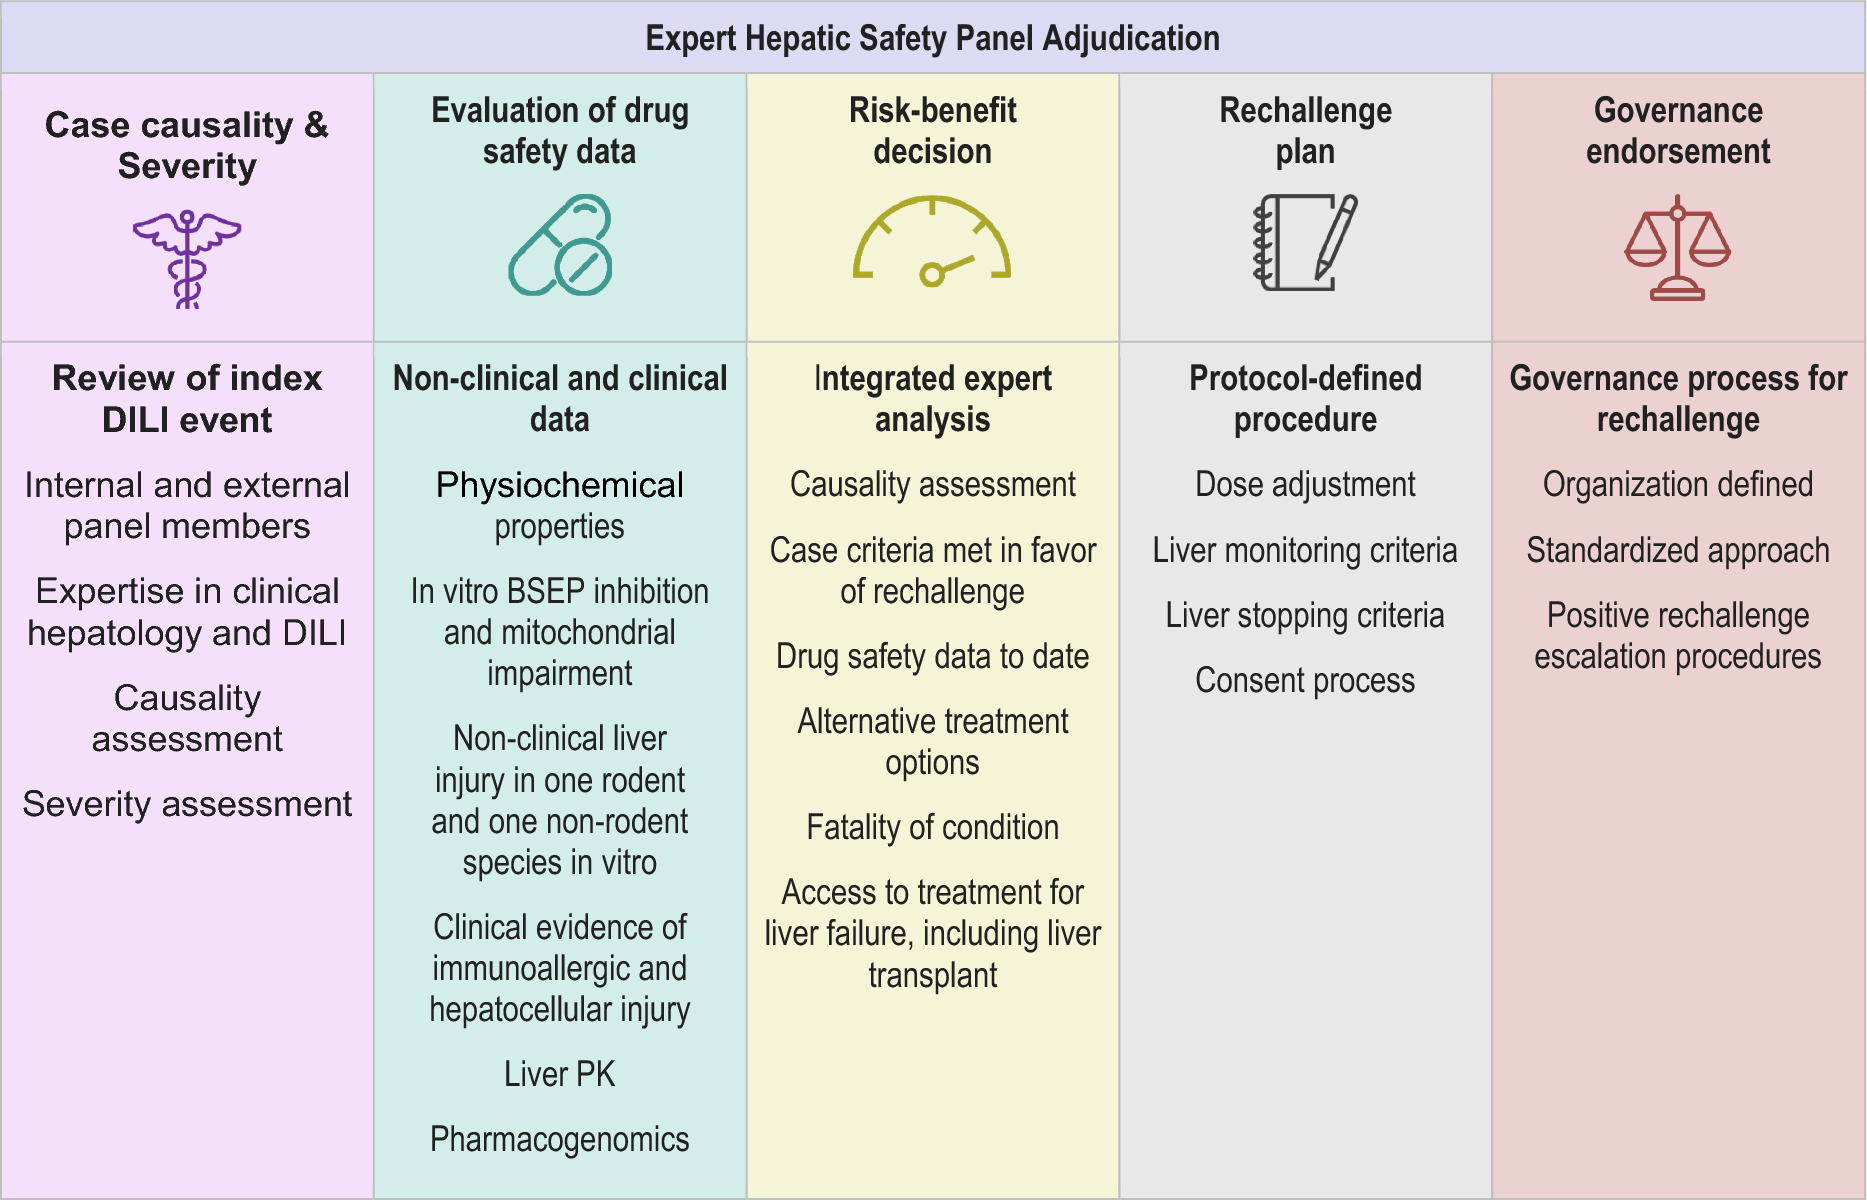
Remember me
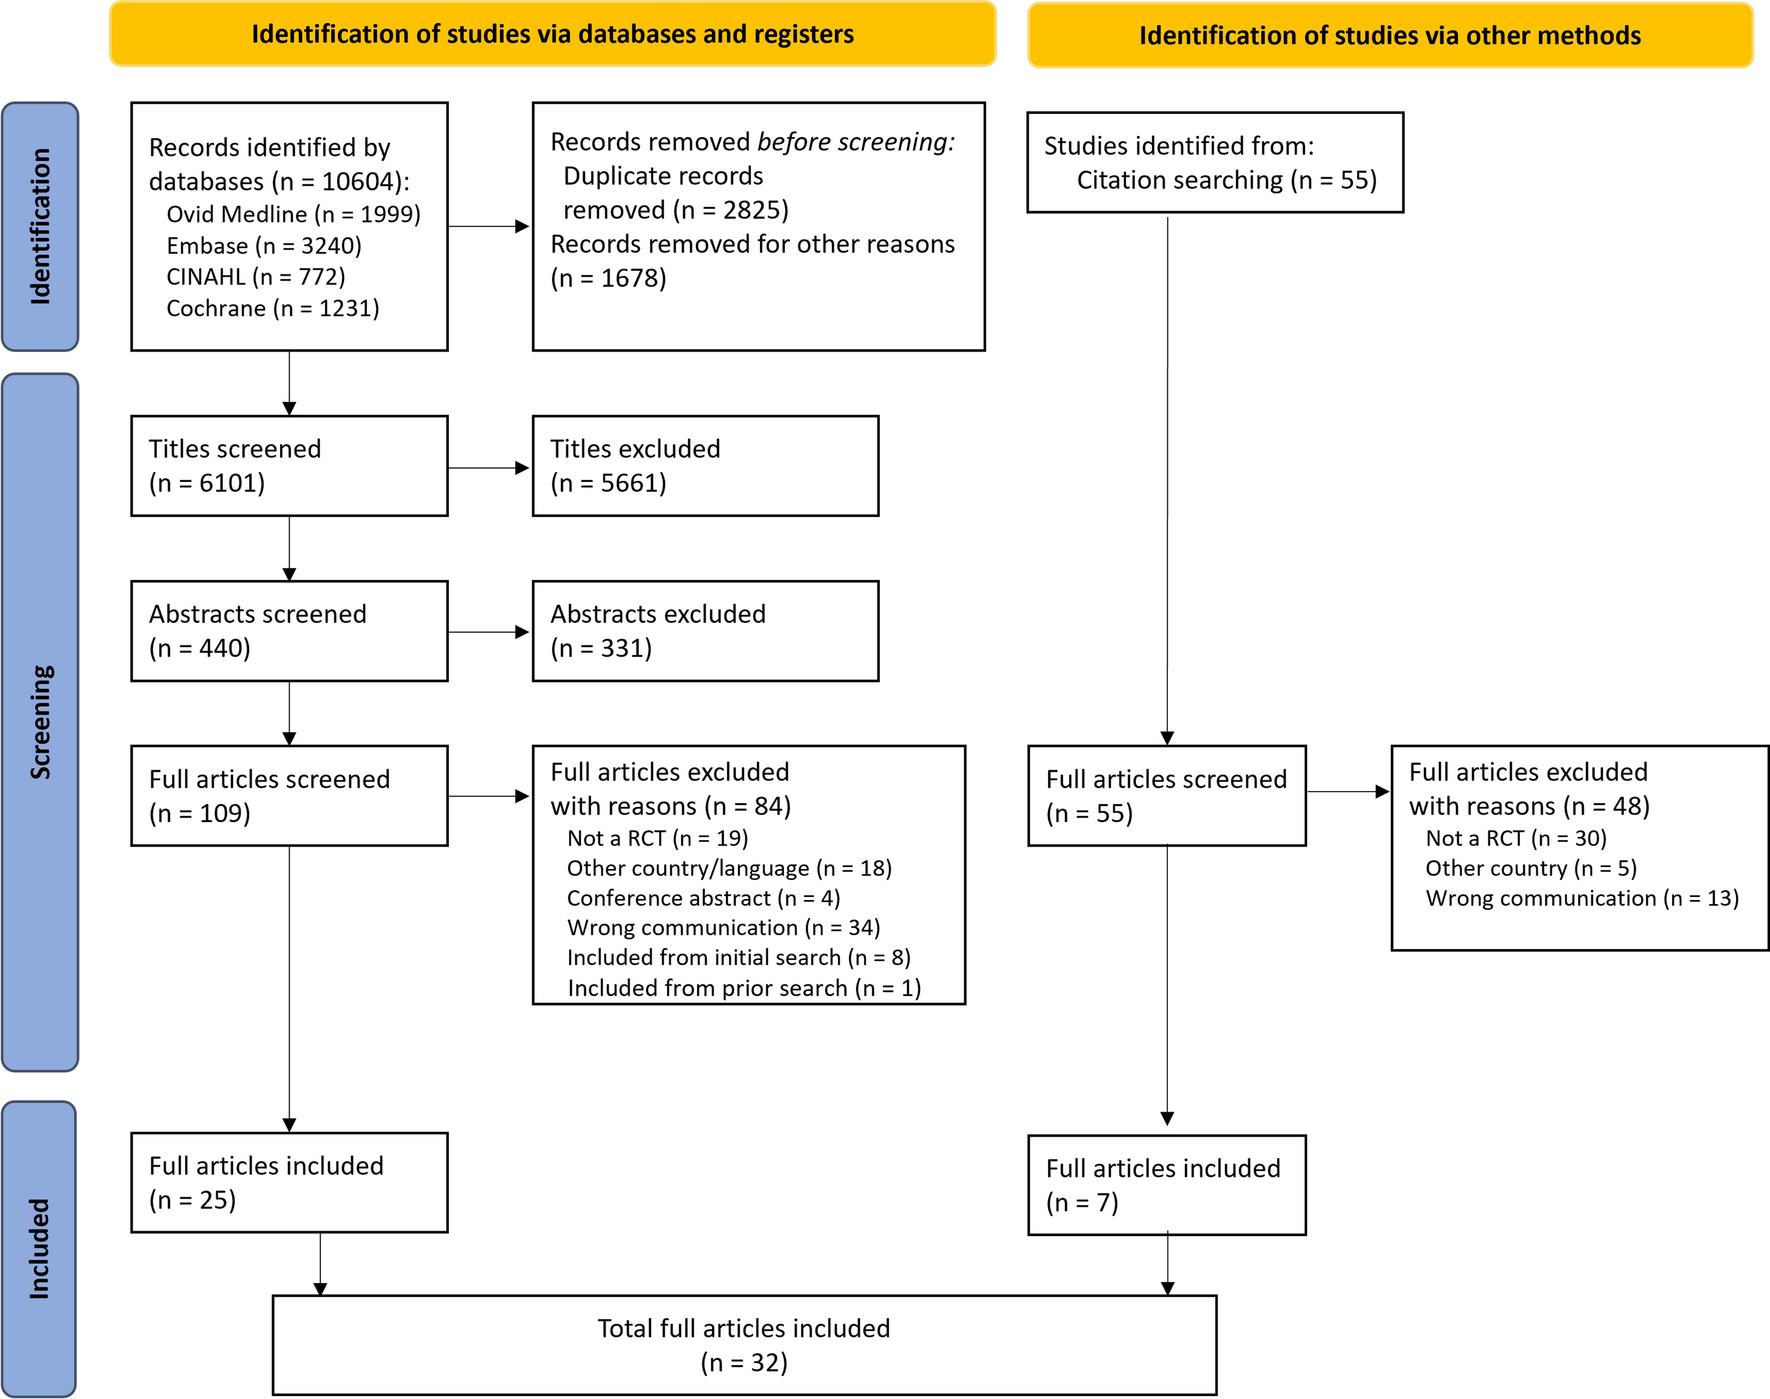

The search flow diagram incorporating both searches is available in Fig. 1. A total of 6101 unique titles were identified by the literature search using databases and registers. After title review and adjudication, 440 titles were eligible for abstract review. Following abstract review and adjudication, 109 articles moved on to full review. Full article review resulted in the exclusion of 84 articles, yielding a sample of 25. A secondary search strategy of reviewing 55 citations of included studies resulted in an additional seven identified studies. In total, 32 articles were included in data extraction and synthesis.
Fig. 1
PRISMA diagram. Flow chart illustrating the study selection process. RCT randomized controlled trial
3.2 Study CharacteristicsStudies included in the review represented research studies conducted in the US (n = 23), UK (n = 2), Ireland (n = 2), South Africa (n = 2), Australia (n = 2), and Canada (n = 2). Articles were sub-categorized based on the type of medication information communication being investigated, including WMI (n = 12) [22,23,24,25,26,27,28,29,30,31,32,33], PGCL (n = 10) [23, 34,35,36,37,38,39,40,41,42], SI (n = 2) [36, 43], and technology-supported tools (n = 14) [23, 26, 32, 33, 44,45,46,47,48,49,50,51,52,53]. Five articles included intervention components falling in multiple domains [23, 26, 32, 33, 36].
The most common outcomes assessed were knowledge (n = 19), behaviors (n = 17) attitudes/beliefs (n = 11), and clinical outcomes (n = 3). In most studies, knowledge was assessed based on individual item or sum total correct responses to knowledge questions developed by the researchers based on the control or intervention content [34, 40, 45]. In seven studies, behavior outcomes were examined with participants demonstrating comprehension of instructions by dosing tablet medication or administrating inhaled medication according to instructions for use. Other behavioral outcomes included online tracking data (e.g., patient portal, website), dosing errors, medication safe use (e.g., disposing of leftover medication), and objective or self-reported adherence to prescribed regimens. Those examining attitudes most commonly assessed participant ratings of helpfulness, satisfaction, understandability, or preferences. Beliefs explored participants’ risk perceptions, perceived drug efficacy, self-efficacy, and health-related quality of life. One study assessed participant performance on a measure of functional health literacy [40]. Another assessed several additional outcomes including health decision making, health-related quality of life, disease burden, and health status [45]. Rates of verbal counseling along with a PMI intervention was examined in one study [28].
Quality assessment (see Fig. 2) determined that risk of bias was low (n = 4), fair (n = 24), or high (n = 4). The most common reason for concerns with quality were lack of pre-registering analyses plans. A third of studies had sample sizes under 30 participants in respective experimental conditions.
Fig. 2
Study quality ratings. Summary chart of quality ratings based on the revised Cochrane risk-of-bias tool
3.3 Design and DevelopmentTwenty-one studies reported details of intervention [22,23,24, 26,27,28, 30, 31, 33, 34, 36, 37, 39,40,41, 45, 47, 49, 51,52,53]. These included pretesting (i.e., formal pilot testing of the intervention) among the intended sample (n = 14), obtaining input (e.g., feedback on design or content) from patients (n = 11), receiving guidance from experts/clinicians (n = 8), or designing the intervention according to recommendations from prior literature and/or organizational recommendations (n = 14). Of the 21 studies, eight used one method, three used two methods, seven used three methods, and three used all four methods when developing the intervention. We conducted an exploratory quantitative analysis examining if there was a benefit of positive findings when patients were involved in PMI development (i.e., either pretesting or obtaining direct input). We assigned 1 point to the study if there were main effects between standard of care and enhanced PMI, 0.5 points for mixed or partially positive findings, and 0 points for no between-group differences. We identified that among studies which included one or more details of development, positive outcomes were identified at a higher rate (66.7%) compared with when details on development were not described (61.4%). In addition, studies which had details of development that received input from patients (14/21) had a positive finding rate of 71.8% compared with 56.4% when studies used expert/clinician input or findings from the literature only (7/21).
3.4 Written Medication InformationTrial descriptions of studies testing WMI (n = 12) are reported in Table 1. Included studies evaluated CMI (n = 10) [23, 25,26,27,28,29,30,31,32,33], a PPI (n = 1) [24], and a PIL (n = 1) [22]. Most explored knowledge outcomes (n = 8) followed by attitudes and/or beliefs (n = 6), behavior (n = 4), clinical outcomes (n = 1), and physical function (n = 1). Of the ten studies examining WMI, six included interventions that were developed with multiple health literacy (HL) principles. These are described in greater detail hereafter, grouped by design element.
Table 1 Studies testing written medication information (n = 12)3.4.1 Plain LanguageCompared with traditional, standard of care WMI, enhanced WMI interventions utilizing HL principles of active and plain language were associated with better knowledge in four studies [22, 24, 27, 28]. In sub-analyses, Patel et al. found interactions by HL, where participants with adequate HL receiving the optimized package insert showed added knowledge benefits [24]. Findings were mixed in a study which consisted of two multi-component experimental conditions, both utilizing a one-page medication sheet (MedSheet) about opioid medication [23]. However, the unique contribution of the MedSheet could not be determined.
3.4.2 PictogramsPictograms with paired text were examined in two studies [22, 27]. Both Browne et al. and Ancker et al. demonstrated that PILs with illustrations alongside paired text were associated with better knowledge compared with standard-of-care conditions. In Browne et al., pictograms had high clarity and acceptability for future use among adults with lower education [22]. Diagrams describing drug mechanisms of action and visual icon arrays showing benefits information were examined in both papers by Green et al. [30, 31]. These studies used two multiphase optimization strategy analysis methods in the same sample but with slightly varying outcomes (beliefs about medication questionnaire alone or in combination with knowledge). In the analysis of the former, diagrams and benefit icon arrays were included in the optimized leaflet, whereas the latter showed that diagrams and benefit icon arrays were included in the second most highly rated leaflet.
3.4.3 FormattingDifferent information formats were tested in four studies [24,
Comments (0)