
Remember me
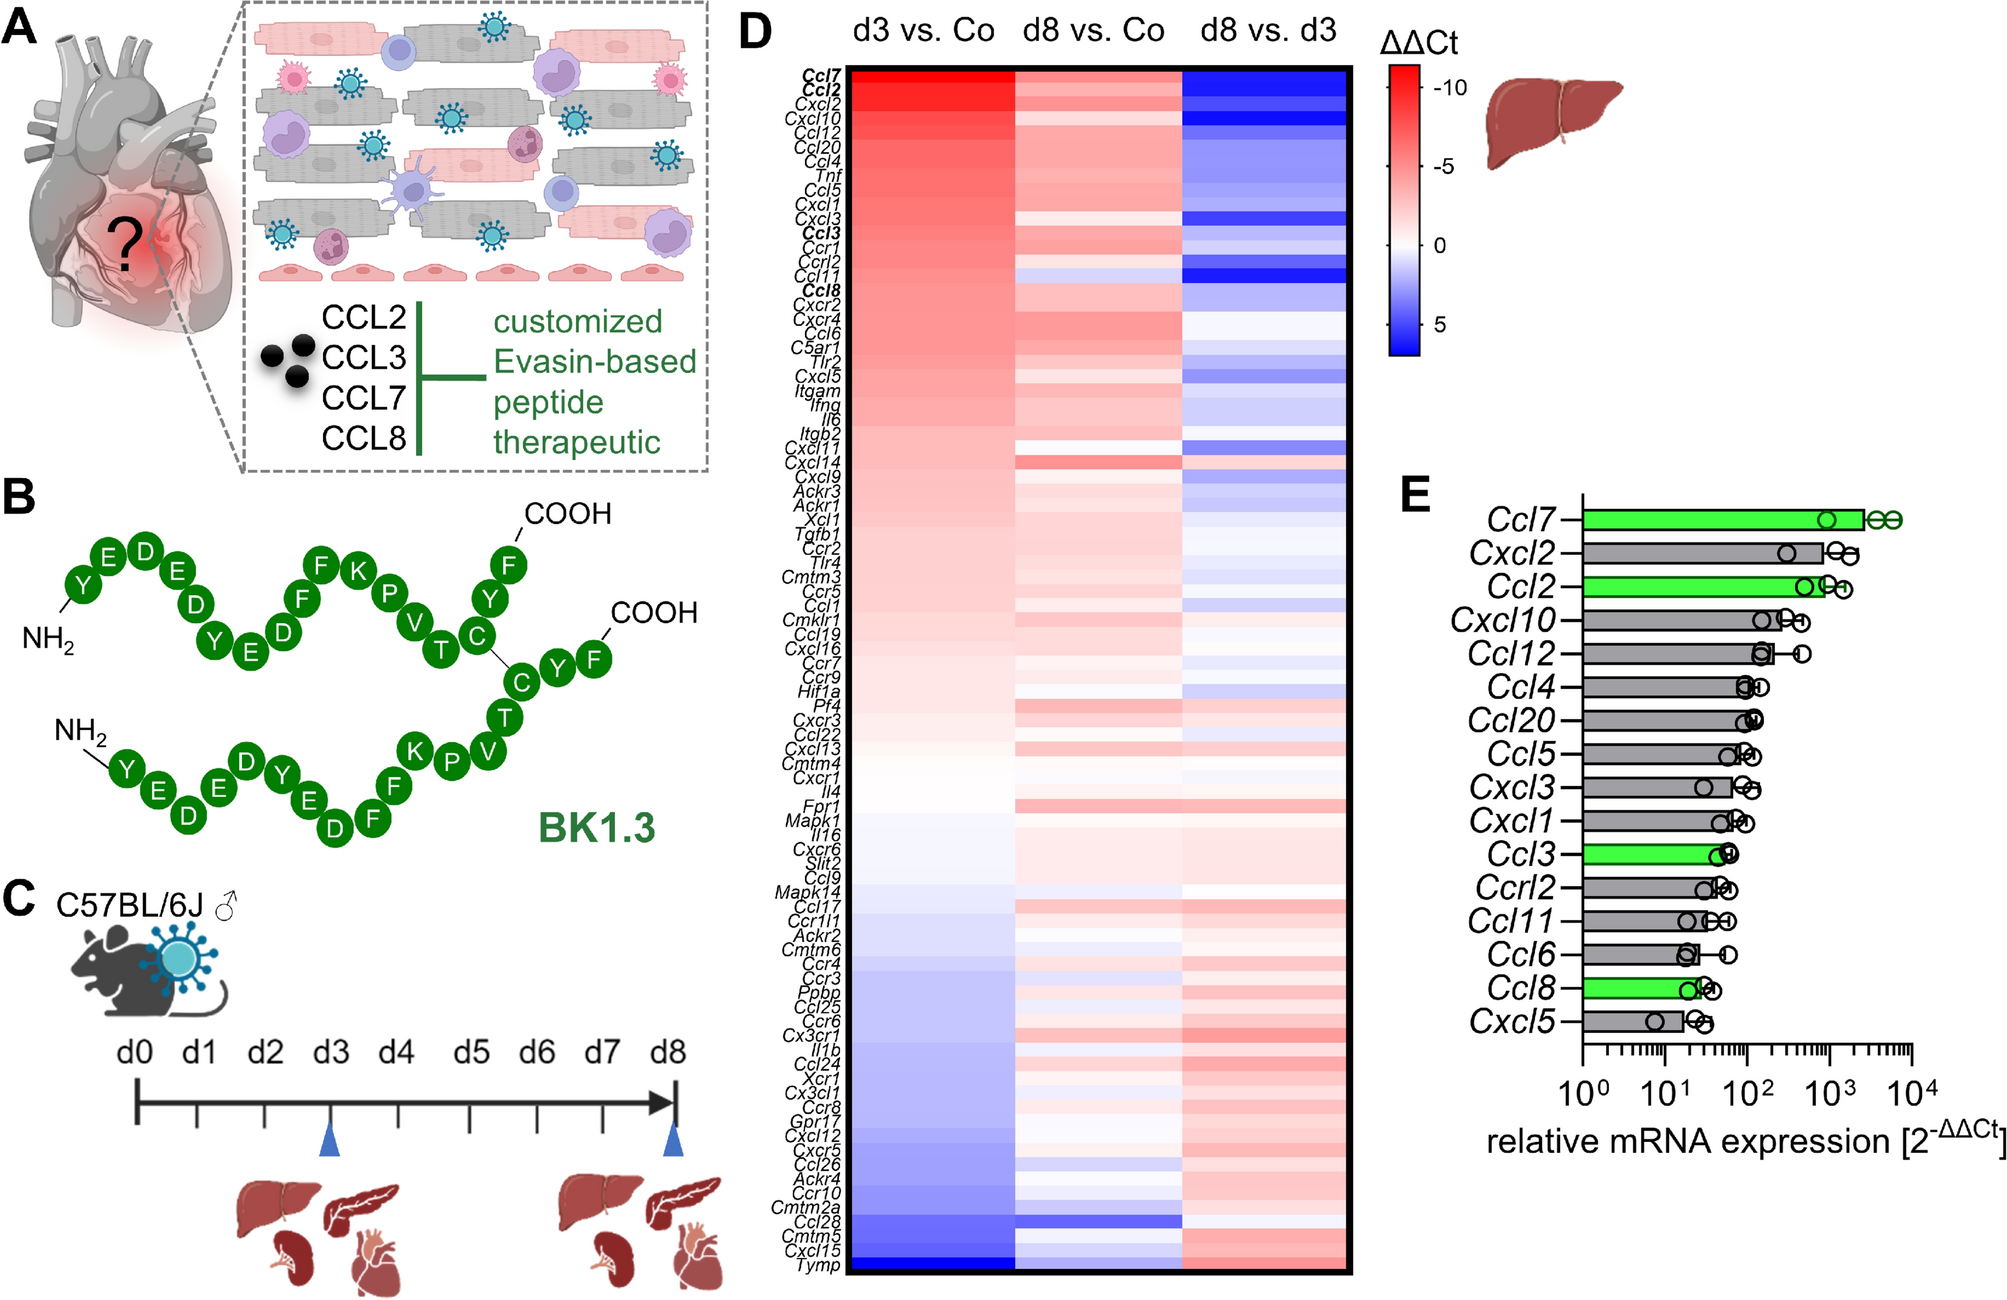
The identification of P672 and BK1.3, their structure, chemokine-binding affinities and anti-inflammatory properties have been described elsewhere [23, 27]. Peptides were synthesized by the peptide synthesis facility at Charité Universitätsmedizin Berlin. The peptides BK1.3 (NH2-YEDEDYEDFFKPVTCYF-COOH) and its scrambled variant BK1.3 SCR (NH2-VEYFYDYDFEKFCEPTD-COOH) were synthesized as dimers through disulfide bond formation using an automated microwave-assisted peptide synthesizer Liberty Blue (CEM, Matthews, NC, USA). The synthesis was conducted on Rink Amide ProTide Resin with 0.19 mmol/g loading (CEM), employing standard Fmoc chemistry. Post-synthesis, peptides were cleaved from the resin with a trifluoroacetic acid-based cocktail (Thermo Fisher Scientific, Waltham, MA, USA), precipitated with diethyl ether (Carl Roth, Karlsruhe, Germany), dissolved using 10% acetic acid (Carl Roth) and lyophilized. Crude peptides were purified using preparative HPLC (Shimadzu Germany, Duisburg, Germany) on a C18 column (Kromasil, Bohus, Sweden) with gradient elution, followed by lyophilization to yield uniform batches. The formation of dimers was achieved by adjusting the pH of the peptide solution to 8.5–9.0 and incubating it with activated carbon (VWR, Radnor, PA, USA) at room temperature, monitored via analytical HPLC (Shimadzu Germany) on a Zobrax C18 column (Agilent Technologies, Santa Clara, CA, USA) to confirm the shift in retention time indicative of dimerization. Final products were characterized by HPLC (Shimadzu Germany) and MALDI-TOF mass spectrometry (Bruker, Billerica, MA, USA), confirming the successful synthesis and purity of both BK1.3 and BK1.3 SCR dimers. Quality control assessment of BK1.3 and its scrambled variant SCR included a THP-1 cell migration assay, following methods described previously [61]. The assays demonstrated an IC50 of 4.2 nM for BK1.3 against CCL8-induced cell migration, which is consistent with previous reports [23]. BK1.3 and SCR were stored as lyophilized powders. Before injection, peptides were thawed and dissolved in 0.5% DMSO (Biomol, Hamburg, Germany). The volume administered per intraperitoneal injection was 100 µL. The dosage of 5 mg/kg body weight was based on the average baseline weight of the mice.
BK1.3 quality testing in acute LPS-induced lung inflammation mouse modelTo study the antiinflammatory efficacy of the produced BK1.3 batch in vivo, we employed an established model of acute LPS-induced lung inflammation [46]. Animal procedures were approved and carried out in accordance with the United Kingdom Home Office Animals (Scientific Procedures) Act 1986, under project licence PPLP973A60F5. In summary, 8–10-week-old male C57BL/6 J mice (Charles River, United Kingdom) were treated with 2 mg/kg of LPS (Lipopolysaccharides, L6143; Merck, Darmstadt, Germany) in a final volume of 20 µL PBS (Gibco, Thermo Fisher Scientific) intranasally. For this procedure, mice were narcotized with 3.5% isoflurane (Zoetis, Parsippany, NJ, USA) and the whole volume of LPS solution was slowly distributed between both nostrils. At the time of lung inflammation induction, mice received an intraperitoneal injection of either BK1.3 (5 mg/kg), SCR (5 mg/kg) or PBS in a final injection volume of 100 µL. A second intraperitoneal dose of BK1.3, SCR or PBS was repeated 9 h later. Mice were sacrificed by exsanguination under terminal anaesthesia 24 h after induction of lung inflammation. Tracheal intubation for bronchoalveolar lavage fluid (BALF) collection was performed post-mortem by washing the lung twice with 1 mL of PBS using a 2.5 mL syringe fixed to a 22G Vasofix safety catheter (VWR).
Immediately after collection, BALFs were centrifuged for 10 min at 500 g 4 °C, the supernatant was removed, and cells resuspended in fetal calf serum-containing (FCS) stain buffer (BD, Franklin Lakes, NJ, USA). Mouse Fc Block (BD) was applied in a 1:200 dilution for 30 min at 4 °C, the samples were washed with stain buffer and subsequently staining was performed with an antibody mix for 30 min in the dark at 4 °C. The antibody-fluorochrome conjugates included in the antibody mix were provided by Miltenyi (Bergisch Gladbach, Germany). More details on the antibody-fluorochrome conjugates are given in Supplemental Table S1. After another wash step, samples were fixed in 2% formaldehyde (Thermo Fisher Scientific) for 10 min and 1 µL of Fixable dead stain near-IR (Thermo Fisher Scientific) was added to each sample. Measurements were immediately done on the Attune Flow Cytometer (Thermo Fisher Scientific). Fluorophore spill-over was compensated carefully. Attune™ Cytometric Software v5.2.0 (Thermo Fisher Scientific) and FlowJo V10.6.2 software (Ashland, Wilmington, DE, USA) were used for analysis. A representative image of the gating strategy is depicted in Fig. 2C.
Production of Evasin P672The P672 protein was produced as a secreted N-terminal His8-StrepII tagged protein in mammalian cells as described [27]. HEK293F cells were transiently transfected with a plasmid containing the P672 sequence and an N-terminal His8-StrepII purification tag (HHHHHHHHSAWSHPQFEKGGGGS). P672 was purified from the cell culture supernatant using nickel affinity chromatography, followed by size exclusion chromatography to ensure high purity. The purity, molecular weight, and glycosylation status of the protein were confirmed by SDS-PAGE, with results consistent with published data [27]. To assess the biological activity of P672, an in vitro CCL8-induced THP1 cell migration assay was performed. The assay measured the ability of P672 to inhibit chemotaxis, with IC50 values determined to be in the range of 4.6 to 10.0 nM. The purified P672 protein was stored in PBS (Thermo Fisher Scientific) at −80 °C until use. Before injection, the protein was thawed and diluted in 0.5% DMSO to prepare the injection solution. For intraperitoneal administration, 100 µL of the protein solution was injected into each subject at a dosage of 5 mg/kg body weight, based on the average baseline weight of the mice.
Animals6- to 8-week-old male C57BL/6 J mice were purchased from Charles River, Germany or provided by the breeding facility of Charité—Universitätsmedizin Berlin Charité. Littermates from each cage were randomly assigned to the treatment and control group. Mice were intraperitoneally infected with 105 plaque-forming units of CVB3-H3. The virus batch was produced by transfection of CVB3-H3 cDNA (pBKCMV-H3) into HEK293T cells and amplified in HeLa cells as described elsewhere [39]. Intraperitoneal injection of Evasin peptide BK1.3 (5 mg/kg body weight) or the control peptide SCR (5 mg/kg body weight) was initiated 12 h after infection and continued at 12-h intervals until the end of the experiment. Body weight was measured at least once a day and rectal body temperature was taken at baseline, on day 3 and on day 8 post infection. The animals were euthanized using a lethal overdose of isoflurane (CP-Pharma, Burgdorf, Germany) on days 3 and 8 post-infection for subsequent analysis. Retrobulbar blood was collected immediately before euthanisation at the aforementioned time points and subsequently blood glucose levels were measured with Accu-Chek glucometer (Roche Diabetes Care, Indianapolis, IN, USA). Afterwards, systemic circulation was flushed by PBS (AppliChem, Darmstadt, Germany) injection into the heart and the mice were dissected. The removed organs were weighed, directly frozen in liquid nitrogen and later stored at −80 °C.
All animal experiments conducted in this study were approved by the local animal welfare authorities in Berlin (“Landesamt für Gesundheit und Soziales”), registered under permit number G0139/20. We adhered strictly to the German Animal Welfare Act and the Animal Welfare Laboratory Animal Regulations, in accordance with the European Directive 2010/63/EU on the protection of animals used for scientific purposes. Measures to minimize suffering were rigorously implemented. Oral administration of Tramadol (Grünenthal, Stolberg, Germany) via drinking water was used for refinement, following our previously published protocol [52]. Animal welfare was assessed at least twice daily and recorded in score sheets that included parameters such as body weight, general condition, breathing pattern, behavior, and signs of pain. Animals meeting termination criteria as per the score sheets were euthanized to prevent undue suffering.
Histology and immunohistochemistryTissue samples were taken from the heart, pancreas and liver and fixed in 4% formaldehyde solution (Carl Roth). The fixed samples were stored refrigerated in PBS (AppliChem) until they were embedded in paraffin, sectioned and stained. Hematoxylin and eosin (H&E) staining was carried out for all organs. The cardiac inflammation was assessed by the blinded rating of the myocarditis score (0: no inflammatory infiltrates, 1: small foci of inflammatory cells between myocytes, 2: larger foci of > 100 inflammatory cells, 3: ≤ 10% of cross-section involved, 4: 10%–30% of a cross-section involved) [58]. Pancreas destruction was evaluated with a scoring system ranging from 0 to 100% destruction. Following a histological scoring system used by Veteläinen et al. [62], liver tissue sections were graded for inflammation and necrosis (0: no inflammation/necrosis; 1: scattered immune cells/mild necrosis (< 10%), 2: immune cell foci/marked necrosis (10%–50%), and 3: diffuse immune cell infiltrates/severe necrosis (> 50%)). F4/80 immune cells were identified by staining with an F4/80 antibody (BM8, 14–4801-85, Invitrogen) and nucleated F4/80+ cells were counted in high-power fields.
Serum analysisWhole blood obtained from retrobulbar sampling was centrifuged at 10,000 × g for 10 min. The serum supernatant was separated and stored at −80 °C. Serum levels of albumin and enzyme activities of aspartate aminotransferase (ASAT), alanine aminotransferase (ALAT) and alkaline phosphatase (AP) were measured by the veterinary diagnostic laboratory (SYNLAB Vet, Berlin, Germany). Free fatty acid serum levels were determined with a colorimetric Free Fatty Acid Kit (Abcam, Waltham, MA, USA) in accordance with the manufacturer’s instructions.
EchocardiographyBaseline echocardiography was performed on all mice two days prior to infection. During the infection, echocardiography was conducted on day 3 for animals sacrificed on that day and on day 7 for those sacrificed on day 8. The echocardiography was carried out using the Vevo 3100 echocardiography machine (FUJIFILM VisualSonics, Toronto, ON, Canada), an MX400 ultrasound probe, a heated examination table with electrodes, heated ultrasound gel (Parker Laboratories, Fairfield, NJ, USA), and a heat lamp. Anesthesia in mice was induced with 3–5% isoflurane (CP-Pharma) inside an anesthesia chamber and was continued with 1.5–2% isoflurane maintenance dose via non-invasive mask ventilation during the echocardiography session. Heart rate, respiratory rate, and body temperature were continuously monitored and kept within physiological ranges throughout the examination. All measurements were performed by a single, experienced investigator.
Echocardiographic analysis included image acquisition of the parasternal long-axis, mid-papillary parasternal short-axis, and apical 4-chamber views, as well as pulsed-wave Doppler of mitral blood flow and tissue Doppler of the septal mitral annulus. Measurements adhered to small animal echocardiography guidelines [64]. Post-acquisition image analysis was conducted using VevoLab 3.2.1 software (FUJIFILM VisualSonics), with each outcome parameter averaged from data obtained from at least three image analyses.
End-diastolic and end-systolic left ventricular volumes, stroke volume, cardiac output, and ejection fraction were derived from the parasternal long-axis B-mode view using the Simpson method. Left ventricular anterior and posterior wall thicknesses during systole and diastole were measured from M-mode images acquired in the parasternal short-axis view. Blood flow velocities for early (E) and atrial (A) diastolic filling were measured with transmitral pulsed-wave Doppler. Isovolumetric relaxation and contraction times, as well as aortic ejection time, were quantified. Tissue Doppler imaging of the septal mitral annulus was used to determine wall motion velocities during early (E’), atrial (A’), and systolic (S’) phases. Additionally, speckle tracking analysis was performed using VevoLab 3.2.1 software. Guidelines on speckle-tracking in mice were considered [5]. Endocardial and epicardial borders were traced over three ECG-monitored respiratory artifact-free heart cycles in a parasternal long-axis view. Global longitudinal strain was derived from at least three separate image acquisitions and the average was calculated.
Immune cell isolation from organsSplenocytesThe protocol for splenocyte isolation is described elsewhere [52].
Heart tissueRemoved heart tissue was weighed and minced into small pieces in cooled, supplemented RPMI medium (Life Technologies, Waltham, MA, USA) containing 2% fetal calf serum (FCS; Sigma-Aldrich, St. Louis, MO, USA), 30 mM HEPES (Life Technologies) and 1% penicillin/streptomycin (Life Technologies). Collagenase 2 (Worthington, Lakewood, NJ, USA) and DNase I (Sigma-Aldrich) were added to a final concentration of 1 mg/ml and 0.15 mg/ml, respectively, and the tissue was incubated for 30 min at 37 °C with continuous shaking. Enzymatic digestion was halted with 10 mM EDTA (Ethylenediaminetetraacetic acid, VWR), and the tissue solution was filtered through a 70 µm cell strainer (Corning, Corning, NJ, USA). The samples were then centrifuged at 310 × g for 10 min at 4 °C, and the supernatants were carefully removed. Red blood cell lysis was performed using a buffer (10 mM KHCO3 (Carl Roth), 155 mM NH4Cl (Thermo Fisher Scientific), 0.1 mM EDTA (VWR) in distilled water) for 3 min at room temperature. After centrifugation, the leukocyte pellets were resuspended in FACS buffer containing 2% FCS (Sigma-Aldrich) and 2 mM EDTA.
Hepatic tissueLiver pieces were weighed and placed in a supplemented RPMI medium containing 0.1% bovine serum albumin (BSA; AppliChem) and 1% penicillin/streptomycin (Life Technologies) on ice. The liver tissue was cut into small pieces, and Collagenase 4 (Worthington) was added to a final concentration of 0.2%. The samples were incubated for 20 min at 37 °C, followed by the addition of DNase I to a final concentration of 0.9 mg/ml and further incubation under the same conditions. Digestion was stopped with 2 mM EDTA and 0.1% BSA in HBSS (Hanks’ Balanced Salt Solution; Thermo Fisher Scientific), and the tissue was filtered through a 70 µm cell strainer. The tissue solution was then diluted with cooled PBS and centrifuged twice at 55 × g for 1 min at 4 °C, discarding the pellet each time. A final centrifugation was performed at 500 × g for 10 min at 4 °C, and the supernatant was removed. The pellet was resuspended in 6 ml of 30% Nycodenz solution (Serumwerk Bernburg, Bernburg, Germany), and 4 ml of HBSS containing 0.1% BSA was added. Additional 6 ml of HBSS with 0.1% BSA were carefully layered on top to create two distinct phases. Gradient centrifugation was carried out for 22 min at 4 °C and 1,400 × g with slow acceleration and no deceleration, producing a white mid-layer containing leukocyte populations. The leukocytes were extracted by pipetting, pelleted by centrifugation at 500 × g for 10 min at 4 °C, and resuspended in FACS buffer. Leukocyte concentration was determined using a Neubauer counting chamber (Hirschmann Laborgeräte, Eberstadt, Germany).
Flow cytometryImmune cells isolated from 20 mg of heart tissue and a specified number of cells from spleen and liver tissues were used for flow cytometry staining. Samples were first incubated with an Fc blocking agent (Miltenyi) at a 1:50 dilution for 20 min at 4 °C. This was followed by staining with an antibody mix for 20 min at 4 °C in the dark. The used antibody-fluorochrome conjugates were provided by BD, Biolegend (San Diego, CA, USA) and Life Technologies. More details on the antibody-fluorochrome conjugates are given in Supplemental Table S1. Samples were then washed with PBS and centrifuged for 3 min at 4 °C and 300 × g. Live/dead staining was performed with Fixable Viability Dye eFluor 780 (eBioscience, San Diego, CA, USA), incubated at a 1:1000 dilution in PBS for 30 min in the dark. After another wash, samples were fixed with 2% formaldehyde (Carl Roth), then washed and resuspended in FACS buffer. For absolute immune cell counts, 123 count eBeads (Life Technologies) were added to heart samples. Flow cytometry was conducted using a FACSymphony instrument (BD), and data were analyzed with FlowJo V10.6.2 software. Representative gating strategies are shown in Supplemental Figs. S1, S2, S3.
Quantification of infectious viral particlesVirus titer was quantified by plaque assay. HeLa cells (Henrietta Lacks-derived; ATCC, Manassas, VA, USA) were cultured in supplemented MEM (Life Technologies) containing 5% FCS (Sigma-Aldrich), 1% penicillin/streptomycin (Life Technologies), 2% HEPES (Life Technologies), and 1% non-essential amino acids (NEAA) (Life Technologies). HeLa monolayers were seeded in 24-well plates (Greiner, Kremsmünster, Austria). Tissue samples from the heart, liver, spleen, and pancreas were weighed and homogenized in 1 ml of MEM using 2 mm Zirconia beads (BioSpec Products, Bartlesville, OK, USA) in a FastPrep machine (Savant Instruments, Hyderabad, Telangana, India). Serial tenfold dilutions of the tissue suspensions were applied to the HeLa monolayers and incubated for 30 min at 37 °C. Following incubation, the supernatants were removed, and the infected monolayers were overlaid with Eagle’s agar containing MEM, 0.68% penicillin/streptomycin, 1.6 g/l NaHCO3 (Carl Roth), 9% FCS, and 0.7% Difco Agar Noble (BD Bioscience, Heidelberg, Germany). After two days, cell lysis plaques were stained with MTT (3-(4,5-dimethylthiazol-2-yl)−2,5-diphenyltetrazolium bromide; Sigma-Aldrich) and counted. For each tenfold dilution, two replicates were analyzed, and results were expressed as plaque-forming units (pfu) per gram organ tissue.
Quantitative Real-Time PCRLiver tissue was homogenized, and RNA was extracted using Trizol (Thermo Fisher Scientific) following the manufacturer’s instructions. The final RNA concentration was determined using a NanoDrop spectrophotometer (VWR). For cDNA synthesis and subsequent quantitative real-time PCR, Qiagen’s 2-Step RT-PCR 96-well protocol was strictly followed. A total of 2.5 µg of RNA was used for cDNA synthesis with the QuantiNova Reverse Transcription Kit (Qiagen, Venlo, Netherlands). The synthesized cDNA was then mixed with the QuantiNova SYBR Green PCR Kit (Qiagen) and applied to the PCR array of the Mouse Chemokines & Receptors QuantiNova® LNA® PCR Focus Panel (SBMM-022ZC; Qiagen). The PCR reactions were run on the StepOnePlus real-time PCR system (Thermo Fisher Scientific). Data analysis was conducted in an R environment using a library designed for high-throughput quantitative real-time PCR data [26]. CT values equal to or greater than 40 were excluded from further analysis. The CT values were scaled across all samples according to the ratio of the geometric means of each sample’s CT values. We performed differential gene expression analysis to determine ΔΔCT values between all pairs of experimental groups within each tissue. Actb, Gapdh, and Hsp90ab1 were used as housekeeping genes. Statistical analyses were performed with the wrapper function limmaCtData (stringent = FALSE and spacing = 1) that employes the limma package [54] and its functions lmfit and ebayes with a contrast matrix providing empirical Bayes moderated t-statistics on the fitted linear models for each gene in all pairwise comparisons.
Sample preparation for proteomicsHeart and liver tissues (5–20 mg) were weighed into Lysing Matrix D Tubes (MP Biomedicals, Irvine, CA, USA), and the volume was adjusted to 300 µl with RIPA lysis buffer (Thermo Fisher Scientific) supplemented with 1.25 × protease inhibitor (Merck). The samples were homogenized using a FastPrep device (MP Biomedicals) at 6 m/s for three cycles of 30 s each. After homogenization, debris was pelleted by centrifugation at 2,500 g for 5 min, and the protein concentration was determined using the Pierce Protein Assay Kit (Thermo Fisher Scientific). A total of 25 µg of protein was transferred into an Eppendorf TwinTec plate (Eppendorf, Hamburg, Germany) for SP3 protein preparation.
The lysates were processed on a Biomek i7 workstation (Beckman Coulter, Indianapolis, IN, USA) following the SP3 protocol, as previously described, with one-step reduction and alkylation [49]. Briefly, 16.6 μl of reduction and alkylation buffer (40 mM TCEP (tris(2-carboxyethyl)phosphine; Merck), 160 mM CAA (2-chloracetamide; Sigma-Alrdrich), 200 mM ABC (ammonium bicarbonate; Honeywell, Morris Plains, NJ, USA)) were added, and the samples were incubated at 95 °C for 5 min before cooling to room temperature. For protein binding, 250 μg of paramagnetic beads (in a 1:1 ratio of hydrophilic/hydrophobic beads; GE Healthcare Technologies, Chicago, IL, USA) were added, and proteins were precipitated with 50% acetonitrile (Thermo Fisher Scientific). The samples were washed twice with 80% ethanol (Sigma-Aldrich) and once with 100% acetonitrile before reconstitution in 35 μl of 100 mM ABC. The samples were digested overnight at 37 °C for 17 h using a Trypsin/LysC Mix stock solution at 0.1 µg/µl (Promega, Madison, WI, USA) at a protein ratio of 1:50 (w/w). The digestion was terminated by adding formic acid (Thermo Fisher Scientific) to a final concentration of 0.1%. Peptide concentration was measured using the Pierce Quantitative Fluorometric Peptide Assay (Thermo Fisher Scientific), and the samples were transferred to a new plate and stored at −80 °C until analysis by LC–MS/MS without further conditioning or clean-up.
Proteome analysis by DIA LC–MS and DIA-NNLC–MS analysis was conducted using an Evosep One system (Evosep Biosystems ApS, Odense, Denmark) coupled with a Bruker timsTOF Pro 1 mass spectrometer. A total of 200 ng of tryptic-digested peptides were loaded onto Evotip Pure tips (Evosep Biosystems ApS) following the manufacturer’s protocol. Liquid chromatography was performed using the Evosep 30 SPD LC method, which features a 44-min gradient, with an EV1137 performance column (ReproSil-Pur C18, 1.5 µm beads by Dr. Maisch, Ammerbuch, Germany, 15 cm × 150 µm) maintained at 50 °C. The column was coupled to a 10 µm Zero Dead Volume (ZDV) captive spray emitter. For mass spectrometry acquisition, the Bruker default method “dia-PASEF-long gradient” was employed. The acquisition covered a mass range of m/z 100 to 1700 and an ion mobility range of 1/K0 0.6—1.6, using 32 mass steps per cycle. The collision energy increased progressively depending on the ion mobility window, ranging from 20 to 59 eV, with a window width set to 50 Da. Accumulation and ramp times were maintained at 100 ms. Data processing steps of spectra deconvolution, protein identification and relative quantification were conducted using DIA-NN 1.8.1 (Data-Independent Acquisition by Neural Networks) [24]. The peptide search was performed in library-free mode, utilizing deep learning to create a new in silico spectral library from the Uniprot reference proteome from mus musculus (downloaded on August 27, 2023). DIA-NN standard settings were applied, precursor charge range was set to 2–4, scan window radius was set to 7, mass accuracy and MS1 accuracy set to 15, and match between runs activated.
Computational simulation of liver metabolism in infectionWe used HEPATOKIN1 [6] in combination with a detailed model of lipid droplet metabolism [7] to evaluate the functional implications of protein abundance changes observed during infection and treatment in the liver. The model comprises the central hepatic metabolic pathways of glycolysis, gluconeogenesis, glycogen synthesis, glycogenolysis, fructose metabolism, galactose metabolism, the creatine phosphate/ATP shuttle system, the pentose phosphate cycle composed of the oxidative and non-oxidative branch, the citric acid cycle, the malate aspartate redox shuttle, the glycerol-3-phosphate shuttle, the mitochondrial respiratory chain, the beta-oxidation of fatty acids, fatty acid synthesis, ketone body synthesis, cholesterol synthesis, TAG synthesis and degradation, the synthesis and hydrolysis of TAG, the synthesis and export of VLDL, the urea cycle, the metabolism of the amino acids serine, alanine, glutamate, glutamine, and aspartate, and ethanol metabolism. The model contains the key electrophysiological process of the inner mitochondrial membrane including the mitochondrial membrane potential, mitochondrial ion homeostasis, and the generation and utilization of the proton motive force described by kinetic equations of the Goldman-Hodgkin-Katz type [8]. We used the protein abundance data obtained from LC–MS/MS analysis to generate individual instantiations of the metabolic model describing the liver of each animal. For this purpose, the maximal activities \(_\) of enzymes and transporters \(_\) for each animal were computed according to \(_}^_}=_}^_} \frac_}_}\), where \(_\) and \(_\) denote the label-free quantification intensities for protein E in the animal a and the reference liver, respectively. As a reference, we used the mean label-free quantification intensities of protein E in control livers. The maximal activity \(_}^_}\) of enzyme E for the reference livers was assumed to be identical to the generic model HEPATOKIN1 that has been fitted to experimental data of fluxes and metabolites obtained in perfused whole livers, isolated cells, or tissue sections derived from whole livers. All rate equations and the \(_}^_}\) values can be found in [6].
StatisticsStatistical analysis was performed using GraphPad Prism V10.1.1 software (La Jolla, CA, USA) for Windows. Outliers in the primary data identified by the ROUT method (Q = 1%) were not considered for further statistical analysis and are not shown in the graphs. The D’Agostino-Pearson test was used to test the data for normal distribution. Unless otherwise indicated, individual data points, mean values, and standard deviations (SD) are depicted in each graph. Viral titer data were log10 transformed prior to statistical analysis. In the corresponding graphs, the log10 transformed data are plotted on a linear scale labelled to the power of 10. In general, the applied statistical test is indicated in the figure legends for each graph. In summary, two group comparisons were analyzed with unpaired t-tests (Figs. 2D, 7G, 8A-D, F-I, 10A-D, G). If an F-test determined unequal variances, an unpaired t-test with the Welch correction was performed. One-way ANOVA was used to compare three or more unmatched groups and was followed by multiple comparisons with either Dunnett´s or Tukey’s test (Figs. 3B, D-G, 4A-F, H-I, 5A-B, 6A-D, 7D-E). Data with the two factors of time and treatment were analyzed by the means of Two-way ANOVA with repeated measures in Fig. 7B and paired Two-way ANOVA test in Figs. 3C, 5C-D, 7F and 9C as well as Tables 1, 2. Two-way ANOVA test was followed by either Tukey or Sidak multiple comparisons as indicated in the figure legends. Survival rates were compared using the Log-rank (Mantel-Cox) test. Statistical analysis of proteomic data was performed by a two‐sample t‐test with Benjamini–Hochberg correction for multiple testing. Principal Component Analysis (PCA) was performed to reduce the dimensionality of the proteomic dataset. Using MATLAB (R2023b, MathWorks), the pca function was employed on the dataset. The results were used to identify the principal components that capture the most significant variance within the data. P-values of less than 0.05 were considered statistically significant in all analyses and are indicated by asterisks (*), non-significant results are indicated by “ns”. If the statistical results are not further specified within graphs, the corresponding statistical tests described in the figure legends were non-significant.
Comments (0)