Experimental models and study design
All procedures conform to the Guide for the Care and Use of Laboratory Animals published by the US National Institutes of Health (revised 2011) [10]. The experiments were approved by the Committee for Animal Care and Use at the Institute of Physiology of the Czech Academy of Sciences (Prague, Czech Republic) # 39/2021, Institute of Clinical and Experimental Medicine (IKEM, Prague, Czech Republic) # 27/2019 and conducted following the recommendations of ARRIVE guidelines, Guide for the Care and Use of Laboratory Animals and EU Directive 2010/63/EU for animal experiments. All efforts were made to minimise the number of rats used in this study.
All animals were housed under controlled laboratory conditions in a room with a constant temperature of 22 °C, humidity of 55–75% and a regular 12 h:12-h light/dark regime and were fed with a standard pellet diet and tap water ad libitum. The animals included in this study were randomly distributed to the investigated, previously confirmed models of HF due to either post-MI cardiac damage induced by temporary LAD ligation [24] or pressure overload-induced cardiac damage either by abdominal aortic constriction (AAC) [30] or using a transgenic (mRen-2)27 rat (TGR) model [37]. The respective models are further described below. At the end of each experiment, the animals were sacrificed by intraperitoneal injection of pentobarbital at the dose of 800 mg/kg and the hearts were rapidly excised and washed in ice-cold PBS. The left ventricles (LVs) were frozen in liquid nitrogen and kept at -80 °C until further analyses.
Post-myocardial infarction heart failure induced by LAD ligation
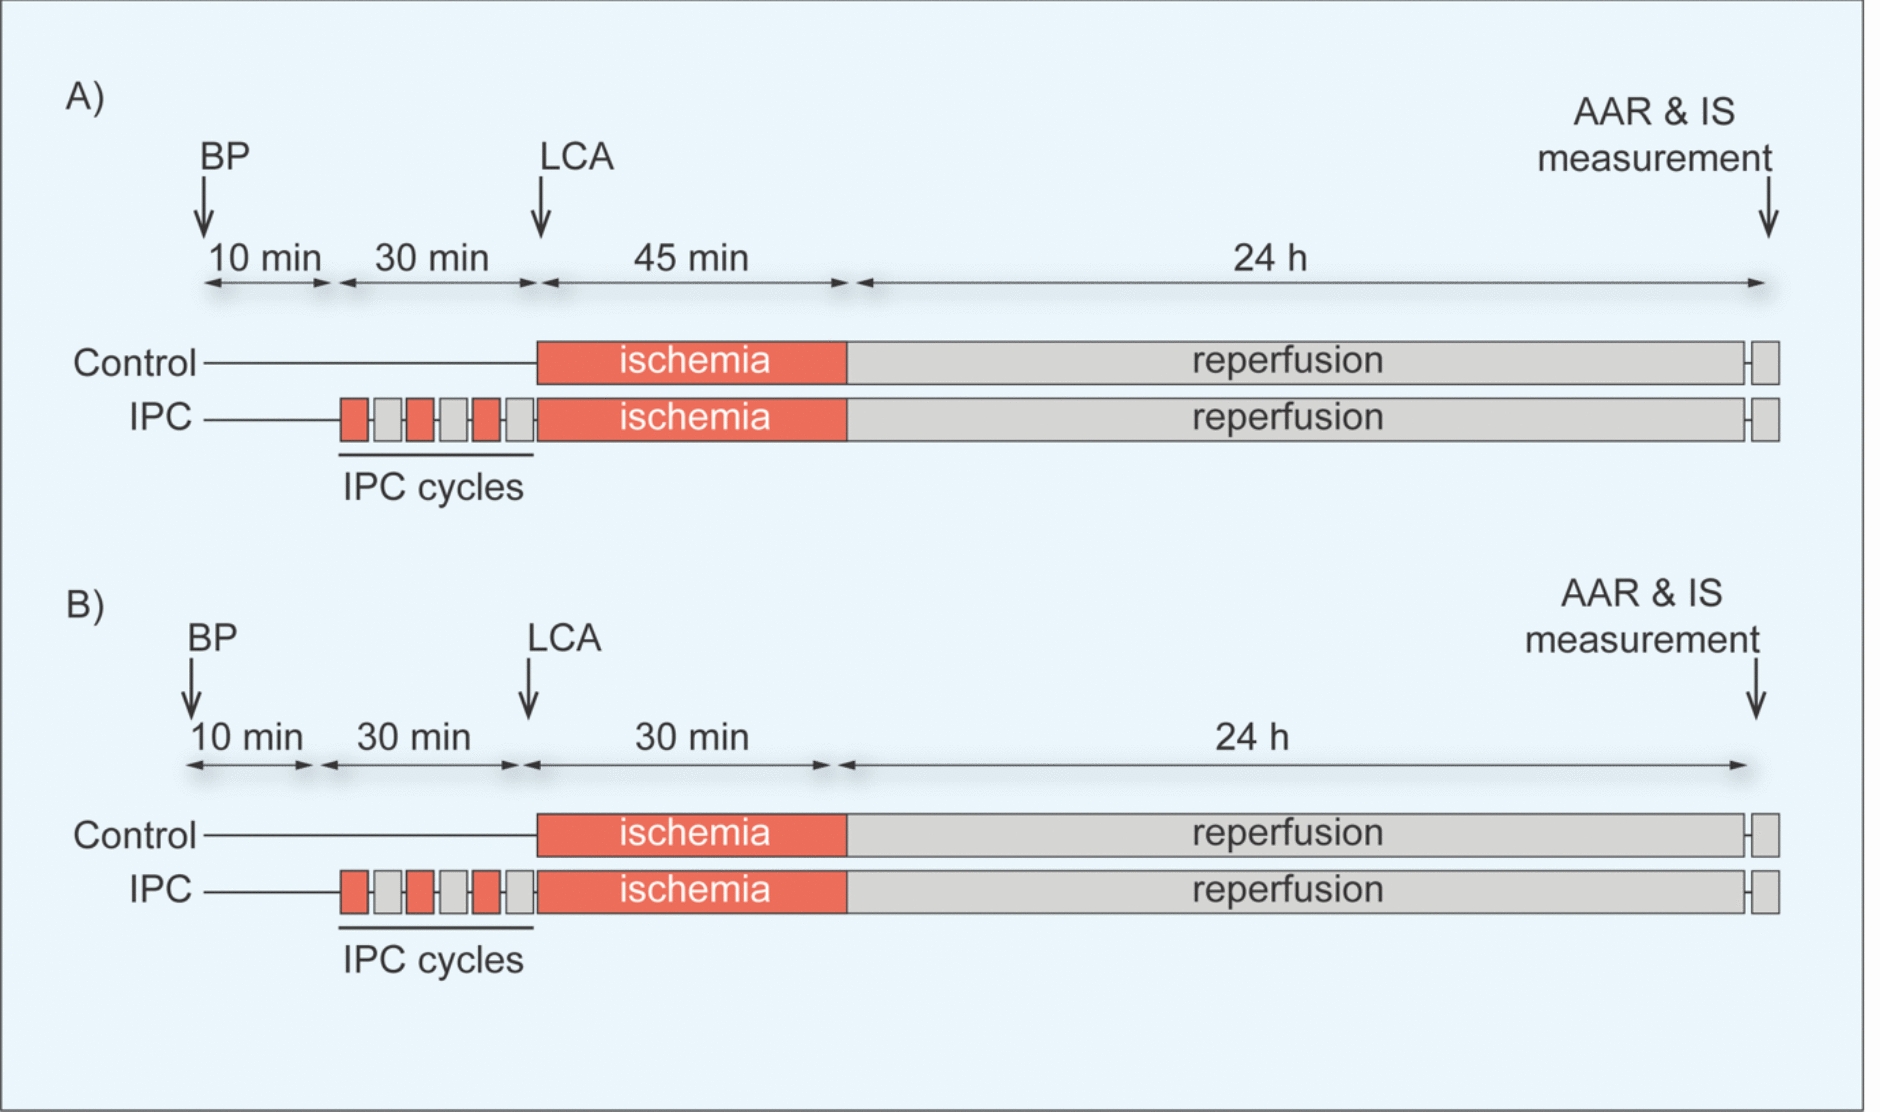
After the incubation period, adult male Wistar rats (250–300 g, Institute of Physiology of the Czech Academy of Sciences, Prague, Czech Republic) were randomly assigned into the following groups: untreated sham‐operated animals (Sham, n = 5), animals subjected to LAD ligation with subsequent development of HF being (n = 10) or not (n = 14) treated with GSK'872 for 7 days (5 mg/kg/d, ip). The dose of the drug was chosen according to the previously published studies employing the same route of drug administration [8, 51]. In anaesthetized open‐chest animals (sodium pentobarbital, 60 mg/kg ip), ischaemia was induced by the ligation of LAD 1‐2 mm distal to the left atrial appendage for 1 h, then the ligation was released resulting in ischaemia and reperfusion injury. Sham‐operated rats underwent chest surgery without the occlusion. The RIP3 inhibitor was applied daily for 7 days whilst the first dose of the drug was administrated immediately after LAD ligation release and then every 24 h. After chest closure, all spontaneously breathing animals recovering from anaesthesia were housed in separate cages with given analgesia (ibuprofen, 20 mg/d po). The mortality of post-MI rats was 50% (7/14) in untreated and 20% (2/10) in GSK'872-treated animals. Seven days after ischaemia and reperfusion injury, the rats were sacrificed as described above. Blood samples were taken from the right ventricular cavity using a needle mounted on an EDTA-coated S-Monovette® 7.5 ml K3E tube (Sarstedt, Germany) and were afterwards centrifuged (10 min, 5371 rpm) to get the plasma for further analyses. After the heart dissection, the whole free LV wall of sham‐operated animals was harvested whilst in the HF group, the LV was dissected into the infarcted area (HFi) and the surrounding non‐infarcted tissue (HFni). A schematic illustration of the experimental protocol of post-MI HF is shown in Fig. 4.
Pressure overload-induced cardiac damage
Pressure overload in newborn male Wistar rats (Institute of Physiology of the Czech Academy of Sciences, Prague, Czech Republic) was induced at the age of 2 days by AAC (n = 7) as described earlier [30]. Briefly, under ether anaesthesia (1.9%), the abdominal cavity was opened by an incision from the left dorsolateral side and the aorta was exposed in the subdiaphragmatic suprarenal region. A silk suture was tied around the aorta using a hypodermic needle of 0.25 mm in outer diameter as a template. The incision was sutured and smeared with 1% iodocollodium. Analgesia (Metamizole, Two hundred mg/kg in the drinking water of the nursing mother) was given for 3 days after the surgery. In sham-operated animals (n = 6), the aorta was exposed but not constricted. The animals were sacrificed at the age of 90 days. In another model of pressure overload, induced by Ren-2 overexpression, adult male TGR rats (n = 6) and HanSD rats (n = 3) as transgene-negative controls at the age of 14–16 weeks (250–300 g, IKEM, Prague, Czech Republic) were used.
Echocardiography
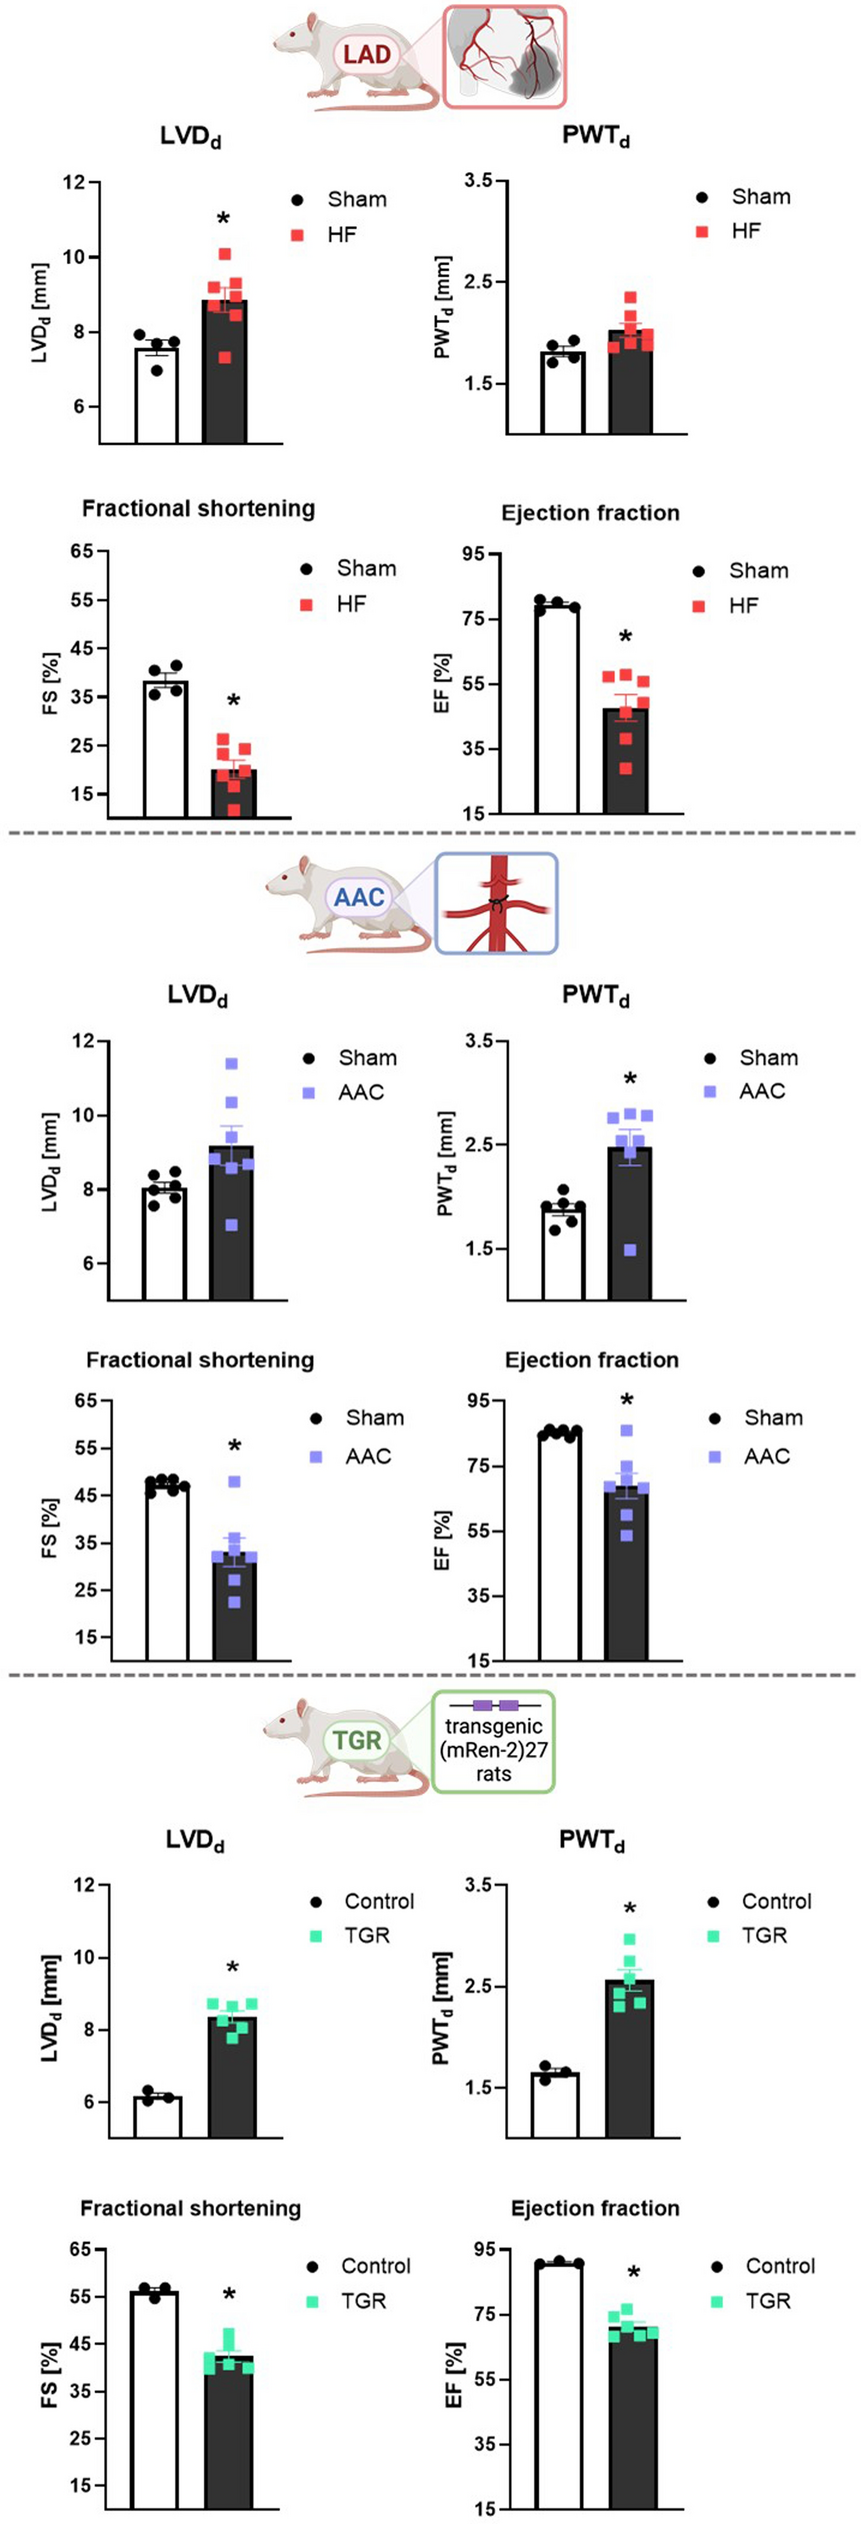
The geometry and function of the LV were assessed by echocardiography using GE Vivid 7 Dimension (GE Vingmed Ultrasound, Horten, Norway) with a 12 MHz linear matrix probe M12L. Animals were anaesthetized with 2% isoflurane (Forane, Abbott Laboratories, United Kingdom) mixed with room air, placed on a heating pad and their rectal temperature was maintained between 35.5 and 37.5 °C. Basic 2-D and M modes in both the long and short axes were recorded. The following parameters of LV geometry were assessed: end-diastolic and end-systolic LV cavity diameter (LVDd, LVDs), and posterior and anterior wall thickness in diastole (PWTd, AWTd). Fractional shortening (FS) and ejection fraction (EF) were derived as follows: FS = 100 × [(LVDd-LVDs)/LVDd]; EF = 100 × [(LVDd3 + LVDs3)/LVDd3].
In the post-MI HF model, echocardiography was performed 4 days prior to the surgery (due to the potential cardioprotective effects of isoflurane) and 7 days after the surgery. In the AAC and TGR models, echocardiography was performed at the end of the experiment.
Immunoblotting
As described previously, immunoblot analysis was performed on whole-cell lysates from the LVs [20]. Briefly, following a post-electrophoretic transfer of proteins (under reducing or non-reducing conditions [38, 39]), the membranes were incubated with the primary antibodies indicated in Table S1. Subsequently, the membranes were incubated with the following secondary HRP-conjugated antibodies: donkey anti‐rabbit IgG (711‐035‐152, Jackson Immunoresearch), donkey anti‐rat IgG (112‐035‐175, Jackson Immunoresearch, USA) and donkey anti‐mouse IgG (115‐035‐174, Jackson Immunoresearch, USA). Signals were detected using enhanced chemiluminescence (Crescendo Luminata, Merck Millipore, USA) and captured by a chemiluminescence imaging system (myECL imager, Thermo Scientific, USA). Total protein staining of membranes with Ponceau S assessed by scanning densitometry was used as the loading control in total tissue lysates [35]. Relative expression of protein bands of interest was calculated by normalising the intensity of a protein band with its whole lane protein staining intensity.
Immunohistochemistry
Tissues were snap-frozen immediately after resection from sacrificed animals. They were fixed overnight with 2% formaldehyde, washed extensively with PBS, incubated in DMSO (Sigma, USA) for 1 h at room temperature (RT) and subsequently in 30% sucrose (Sigma, USA) overnight at 4 °C. After fixation, tissues were incubated in increasing concentration of OCT mounting medium (20%, 50%, 70% diluted in 30% sucrose) and frozen in 100% OCT (Sigma, USA). Cryo-Sects. (5 µm) were permeabilized by combination of DMSO (15 min at RT) and 0.5% saponin (15 min at RT; Thermo Fisher, USA) in two consecutive steps. After washing with PBS, tissues were incubated in 10% FBS (diluted in PBS) for 30 min to block unspecific signals and with diluted primary antibody against F4/80 overnight at 4 °C (#70076; Cell Signaling Technology, USA, 1:100 in PBS). Samples were further washed with PBS and incubated for 1 h at RT with a secondary antibody—goat anti-rabbit Alexa Fluor 488 IgG (A11006, Thermo Fisher, USA). To counterstain nuclei, coverslips were mounted in Mowiol containing 4',6-diamidino-2-phenylindole (DAPI; Sigma, USA) and viewed in Olympus CX43 (Leica, Germany).
TUNEL
Tissues were mounted into cryo-blocks and sectioned as described above. Cryo-Sects. Five μm (prepared as described above) were permeabilized by combination of DMSO (15 min in RT; Sigma, USA) and 0.5% saponin (15 min in RT; Thermo Fisher, USA) in two consecutive steps. Cell death was detected using In Situ Cell Death Detection Kit, Fluorescein (11,684,795,910, Roche, Switzerland) according to the manufacturer’s instructions. DAPI (1 μg/mL) staining was used to visualise cell nuclei.
Histology
For paraffin embedding, tissue was fixed overnight in 2% PFA, placed in 70% EtOH, and processed using the Leica ASP6025 autoprocessor. The programme was set to 12-h standard dehydration and paraffin saturation protocol. After processing, tissue samples were embedded into formalin-fixed paraffin blocks upside down by cutting their surface and orienting the blocks transversally. Standard PicoSirius Red staining, dehydration, and placing the samples on coverslips were accomplished using the Leica ST5020 automated staining instrument in combination with the Leica CV5030 cover-slipper.
Human serum samples
The study using patients’ samples of the serum conforms to the Declaration of Helsinki and was approved by the ethics committee of the National Institute for Cardiovascular Diseases in Bratislava, Slovakia. The written informed consent was obtained from all participants of the study.
The patients’ serum samples were collected during hospitalisation for recently diagnosed HFrEF in the Department of Heart Failure and Heart Transplantation of the National Institute for Cardiovascular Diseases, Bratislava, Slovakia, as described previously [19].
ELISA
The circulating HMGB1 levels were measured by commercially available enzyme-linked immunosorbent assay (ELISA) with the specificity for rats and humans (LSBio, Washington, USA) following the manufacturer´s instructions.
Analysis of miRNA
The miRCURY LNA miRNA PCR Assay (QIAGEN, Hilden, Germany) was used for screening of any alterations in microRNAs (miRNAs) in the rat post-MI failing hearts according to the manufacturer´s instructions. At first, a total RNA was extracted from LVs by miRNeasy Tissue/Cells Advanced Mini Kit (QIAGEN, Hilden, Germany) according to the manufacturer´s protocol. Then both the concentration and purity of the total RNA were verified spectrophotometrically by Nanodrop ND-1000 (Agilent Technologies, USA) and reverse transcribed to cDNA by miRCURY LNA RT Kit (QIAGEN, Hilden, Germany). The qPCR reaction itself was performed by miRCURY LNA SYBR Green PCR Kit (QIAGEN, Hilden, Germany) on CFX96 Touch (BioRad, USA) on the thermal programme presented in Table S2. The final expression of miRNAs was calculated by the GenGlobe web tool (https://geneglobe.qiagen.com/, QIAGEN, Hilden, Germany). After that, quantitative real time polymerase chain reaction (RT-qPCR) was used to verify the data on the pre-selected miRNA profile and to find out the ability of the RIP3 inhibitor to reverse them. Total RNA was isolated by mirVana™ miRNA Isolation Kit (Thermo Fisher Scientific, Waltham, MA, USA) and then measured for purity with spectrophotometer Nanodrop ND-1000 (Agilent Technologies, USA) at 260 nm and 280 nm. Ten ng of the total RNA was reverse transcribed to cDNA with TaqMan™ Advanced miRNA cDNA Synthesis Kit (Thermo Fisher Scientific, Waltham, MA, USA), according to the manufacturer’s instructions. cDNA was amplified using the TaqMan™ Fast Advanced Master Mix for qPCR (Thermo Fisher Scientific, Waltham, MA, USA) with specific miRNA assays for miRNA-140-5p (Assay ID rno480932_mir) and miRNA-142-3p (Assay ID rno480934_mir) (Thermo Fisher Scientific, Waltham, MA, USA). All measured data were normalised to miRNA-103a-3p (Assay ID 478253_mir) (Thermo Fisher Scientific, Waltham, MA, USA). RT-qPCR analyses were performed on CFX96 Touch (BioRad, USA) on the thermal programme presented in Table S3. All obtained data from RT-qPCR were calculated by the 2–∆∆Ct method. The mature sequences of the measured miRNAs are presented in Table S4.
RT-qPCR
Small pieces of tissue (1–2 mm3) were placed into 500 µL of RNAzol (BioRad, Hercules, CA, USA), homogenised (2 × 30 s, 5 600 rpm) using the Precellys 24 homogenizer (Bertin Instruments, Montigny-le-Bretonneux, France) and cleared by centrifugation. Total RNA was isolated according to the manufacturer´s protocol. First strand cDNA was synthesised from 200 ng of total RNA with random hexamer primers using Revert Aid First strand cDNA Synthesis Kit (Thermo Fisher, USA). RT-qPCR was performed using the C1000™ Thermal Cycler (BioRad, USA) with 5 × HOT FIREPol® Evagreen® qPCR Supermix (Solis Biodyne, Tartu, Estonia). Relative quantity of cDNA was estimated by the ΔΔCT method, data were normalised to housekeeping gene β-actin. The primers (Table S5) were purchased from Sigma, USA.
LDH assay
The levels of lactate dehydrogenase (LDH) were measured in the rat plasma after the end of the experiment. A commercially available colorimetric LDH Assay Kit (Abcam, UK) following the manufacturer’s instructions was used.
Statistical analysis
The data are presented as mean ± standard error of mean (SEM). An unpaired t test or Mann–Whitney test (based on the normality of the data) was used to compare the two groups. For more than two groups, one-way analysis of variance (ANOVA) with Tukey’s post hoc test, two-way ANOVA with Tukey’s post hoc test or Kruskal–Wallis’s test with post hoc Dunn’s test was used to evaluate the differences, as appropriate. To determine the relationship between the circulating HMGB1 and selected parameters, Pearson correlation was applied. p < 0.05 was considered as significant. All statistical analyses were performed using GraphPad Prism, version 10.00 (GraphPad Software, USA).

Comments (0)