
Remember me

AOH and AME (Fig. 1) were purchased from Fermentek (Jerusalem, Israel). The internal standards (IS), alternariol-d4 [2H4] (AOH-d4) and alternariol monomethyl ether-d4 [2H4] (AME-d4) were a kind gift from Dr. Rychlik (Technical University of Munich, Germany; Asam et al. 2009). AOH, AME and IS were stored at ≤ − 15 °C.
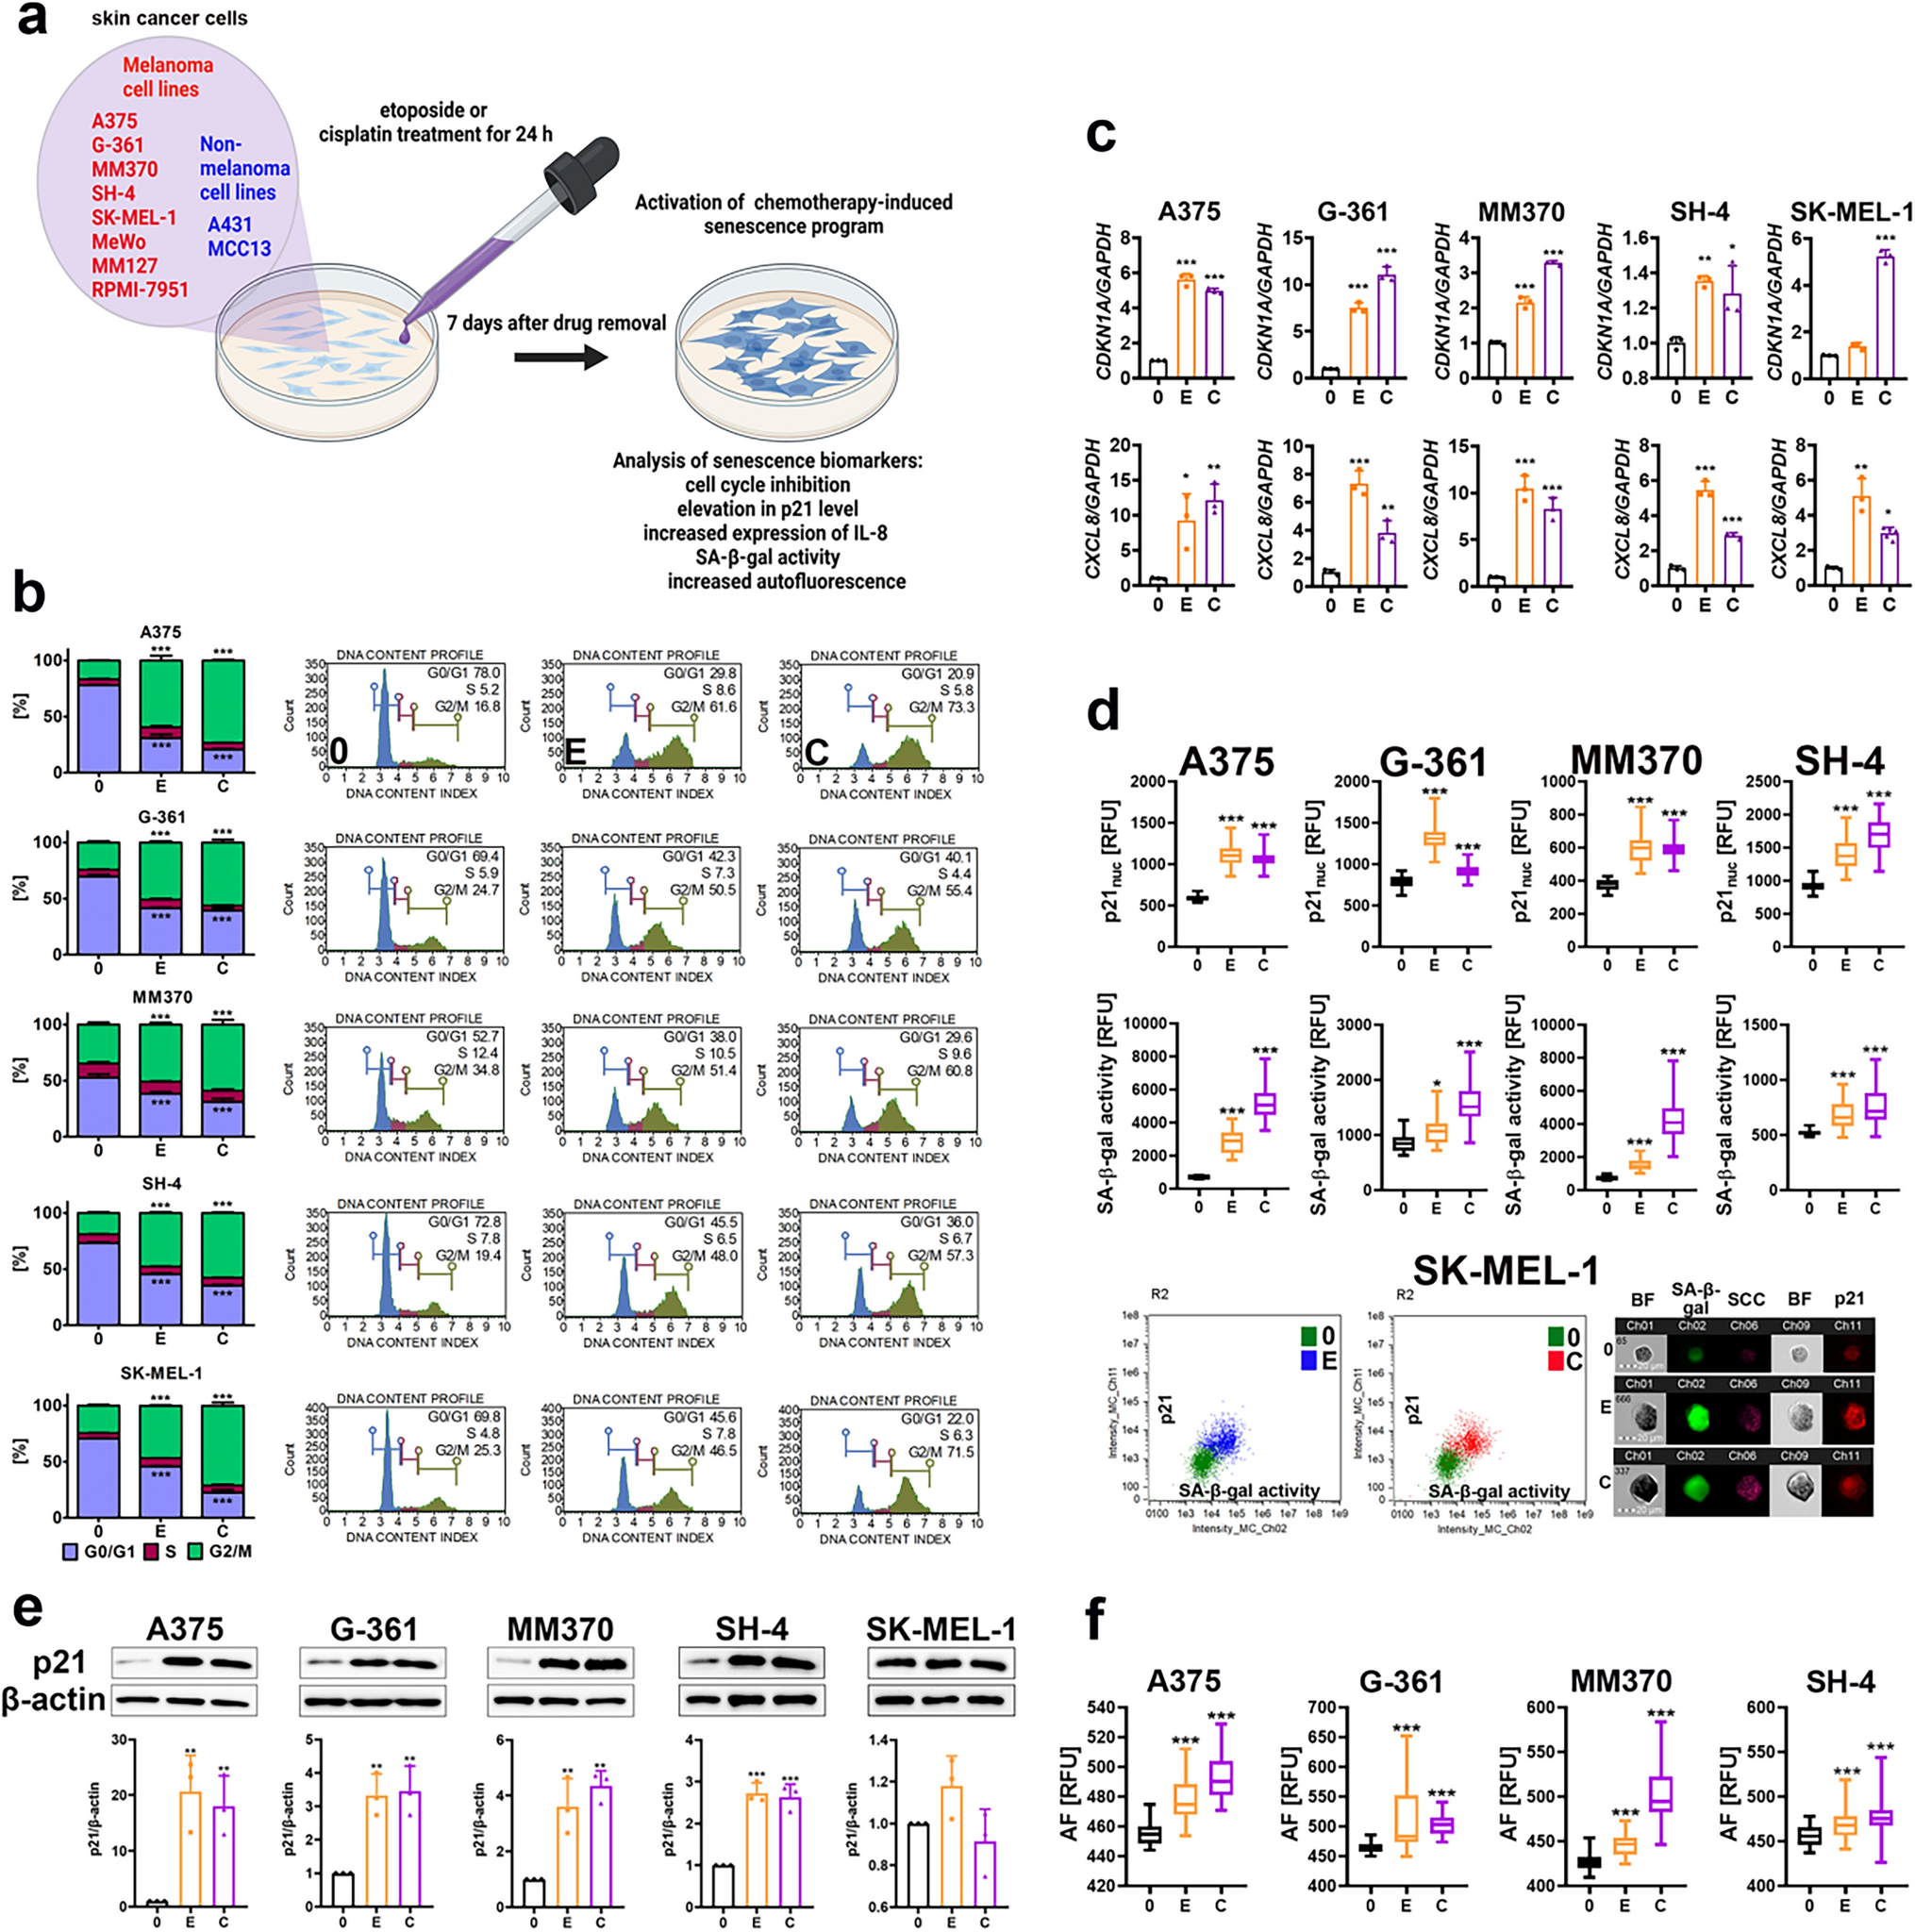
Fig. 1
a Graphical representation of the study design of the pilot trial. b shows a graphical representation of the design of the final trials and the chemical structure of alternariol (AOH, bottom) and alternariol monomethyl ether (AME, top)
Methanol (MeOH), acetonitrile (ACN), formic acid (FA), acetic acid (AA) and ammonium formate (NH4FA) were of LC–MS grade and obtained from Biosolve (Valkenswaard, The Netherlands). Dimethyl sulfoxide (DMSO), ethyl acetate (EtAc) and hydrochloric acid 37% (HCl) were of analytical grade and purchased from Sigma-Aldrich (Bornem, Belgium). Ultra-pure water was from a Milli-Q system (Merck-Millipore, Overijse, Belgium).
Preparation of stock- and working solutionsFor the administration of AOH and AME to pigs, stock solutions of AOH and AME (5 mg/mL) were prepared in DMSO. For the ultra-performance liquid chromatography − tandem mass spectrometry (UPLC-MS/MS) analysis of plasma and urine, stock solutions of AOH and AME (5 mg/mL) and their IS, AOH-d4 (50 μg/mL) and AME-d4 (25 μg/mL), were prepared in MeOH. Working solutions of 10, 1, 0.1, 0.01, and 0.001 μg/mL AOH or AME were prepared freshly for each experiment by appropriate dilution of the stock and working solutions with MeOH. A working solution (1 or 0.1 μg/mL) of IS was made by further dilution of the stock solution in MeOH. All stock- and working solutions were stored at ≤ −15 °C.
Animal experimentsThe animal trials were approved by the Ethical Committee of the Faculty of Veterinary Medicine and the Faculty of Bioscience Engineering of Ghent University (EC case number 2021/071). Care and use of the animals were in compliance with national legislation (Royal Decree 2013) and European Directive 2010/63/EU (European Union 2010). The whole study consisted of a pilot trial with 2 clinically healthy 4-week-old piglets to determine the mycotoxins dose, and two final animal trials for AME and AOH, each performed with 8 clinically healthy 4-week-old piglets of equally divided sexes (Seghers Hybrid®, RA-SE Genetics, Lokeren, Belgium). A graphical representation of the pilot trial and final trials is shown in Fig. 1a and b, respectively, including the number and sex of the piglets involved, the mycotoxins dose and routes of administration, and the types of samples collected. All piglets underwent an acclimatization period of 5 days in which they were housed together in a suitable pen, provided with straw, feed and water ad libitum. For all trials, commercial pig feed was analyzed for the presence of mycotoxins by a multi-mycotoxin LC–MS/MS method (Primoris, Zwijnaarde, Belgium). No AOH or AME were detected (limit of detection (LOD) of 2.0 µg/kg), but the feed for the AME trial contained 80.8 µg/kg deoxynivalenol (DON), whereas the feed for the AOH trial was contaminated with 139.0 µg/kg DON and 18.3 µg/kg zearalenone (ZEN). These levels were however below the maximum guidance levels of 900 µg/kg DON and 100 µg/kg ZEN (feed for piglets), as set by the EC (2006). Temperature of the enclosure was kept between 22 and 24 °C and natural light was present.
The pilot study for dose determination was performed with oral (PO) dosing of 2 piglets (Fig. 1a). One male piglet received a single AME dose of 1 mg/kg b.w. and 3 days later a single dose of AOH of 2 mg/kg b.w.; whereas another female piglet first received AOH at 1 mg/kg b.w. and 3 days later AME at 2 mg/kg b.w. A dose of 2 mg/kg b.w. was selected since this allowed constructing plasma concentration–time profiles with a sufficient high number of samples having levels of the parent mycotoxins above the limit of quantification (LOQ) after PO administration (unpublished data).
In both final trials, 6 out of 8 piglets were participating in the study, while the other 2 served as spare piglets. The mean (± standard deviation or SD) b.w. of all 16 piglets at arrival was 7.3 ± 1.4 kg. In all 6 piglets of each trial, a double-lumen central venous catheter was surgically introduced in the vena jugularis to facilitate repetitive blood sampling to construct rich-data plasma concentration–time profiles, as described by Gasthuys et al. (2009). Simultaneously, 3 (females) of the 6 piglets were provided with a single lumen vena portae catheter to study possible presystemic biotransformation of the mycotoxins. This portal vein surgery was performed by splenic catheterization via celiotomy, also as described by Gasthuys et al. (2009). The jugular vein plasma represents systemic plasma concentrations, i.e. after PO dosing taking into account a possible first-pass effect in both gut and liver. Whereas portal vein plasma results give information about a possible first-pass effect taking place in the gut only. The surgical procedures took place 2 days before mycotoxin administration, and all piglets received during these 2 days a daily dose of ceftiofur as preventive antibiotic therapy (Excenel flow®, Zoetis, Belgium) and meloxicam as anti-inflammatory drug (Metacam®, Boehringer-Ingelheim, Germany). After surgery, all piglets were housed individually for the prevention of reciprocal mutilation and removal of the catheters.
In the first trial, all 6 piglets (3 females, 3 males) were administered a single dose of AME at 2 mg/kg b.w. via PO and IV route, in a two-way crossover design. In the second trial, AOH was administered to 6 other piglets (3 females, 3 males) as a single dose of 2 mg/kg b.w. PO and IV, also in a two-way crossover design (Fig. 1b). For each trial, the 3 female piglets first received the IV dose via the smallest lumen of the double-lumen central vein catheter, while the 3 male piglets received the PO dose by gastric gavage using a stomach tube. After a wash-out period of 72 h, identical crossover administration was set up in the same animals, with the females and males then receiving the single PO and IV dose, respectively. The animals were weighed the day before administration, and were deprived from feed 12 h prior to administration until 4 h post administration (p.a.). The calculated volume of stock solution (5 mg/mL) for each animal was slowly injected in the central venous catheter for IV administration (followed by flushing with saline) and was diluted with saline for PO gastric gavage. After PO dosing, the gavage tube was flushed with 50 mL of tap water to ensure the full dose was administered. Jugular blood (using the largest lumen of the catheter) from all 6 piglets and portal blood samples from the 3 female piglets (1–2 mL/sample) were taken in EDTA tubes at following time points after IV and PO dosing: 0, 5, 15, 30, 60, 90, 120 min, 3, 4, 6, 8, 12, 24, 36, and 48 h p.a. Blood samples were kept refrigerated and were centrifuged (3000 rpm, 10 min, 4 °C) within 2 h after sampling. Plasma was then stored at −80 °C until further analysis.
For both trials, besides plasma also total volume urine samples were taken from the male piglets (n = 3) at the following collection intervals: 0–4, 4–8, 8–12, 12–24, 24–36 and 36–48 h p.a. after both IV and PO administration. A non-invasive urine sampling technique was used, based on the application of urine pouches (Gasthuys et al. 2017b). Urinary volumes at each collection interval were determined to construct the cumulative urinary excretion profiles, and samples were stored at −20 °C until further analysis.
Quantitative UPLC-MS/MS analysis of AOH and AME in plasma and urineSample extractionTo 250 μL of pig plasma, 20 μL of a mix of IS working solution was added (WSIS_mix 100 ng/mL), followed by vortex mixing and equilibrating for 5 min at room temperature. A volume of 750 μL of 0.1% FA in ACN was added, followed by vortex mixing (1 min) and centrifugation (10 min, 13,000 rpm). The supernatant was transferred to a 96-well sample collection plate (2-mL square well, Waters) and evaporated under a gentle nitrogen stream (~ 45 °C). The dry residue was reconstituted in 250 μL of water/MeOH (15/85, v/v), followed by vortex mixing for 15 s (2500 rpm). After covering the 96-well collector plate with a mat cap, a 1.0-μL aliquot was injected into the UPLC-MS/MS instrument.
To 500 μL of pig urine, 25 μL of a mix of IS working solution was added (WSIS_mix 1 μg/mL), followed by vortex mixing and equilibrating for 5 min at room temperature. The urinary pH was checked using a pH paper (pH 0–14, Merck, Novolab, Geraardsbergen, Belgium) and adjusted to pH 2 using a 1 M HCl solution. Three mL of EtAc were added to the sample, followed by vortex mixing (1 min) and extraction for 15 min by rolling on a horizontal rotary apparatus. The sample was centrifuged (10 min, 4000 rpm) and the supernatant was transferred to another tube and evaporated under a gentle nitrogen stream (~ 45 °C). The dry residue was reconstituted in 250 μL of water/MeOH (15/85, v/v), followed by vortex mixing for 15 s (2500 rpm). After transferring the reconstituted extract to an autosampler vial, a 5.0-μL aliquot was injected into the UPLC-MS/MS instrument.
UPLC-MS/MS analysisTwo different UPLC-MS/MS instruments were used for the quantitative analysis of AOH and AME in plasma and urine samples, a Xevo TQ-XS® MS/MS and Quattro Ultima® MS/MS system, respectively. This was based on the higher detection sensitivity needed for plasma, considering lower levels in plasma compared to urine.
The UPLC system for plasma analysis consisted of an Acquity UPLC H-Class + Quaternary Solvent Manager and Flow-Through-Needle Sample Manager with temperature controlled tray and column oven from Waters (Antwerp, Belgium). Chromatographic separation was achieved on an Acquity UPLC Phenyl-Hexyl column (150 mm × 2.1 mm i.d., dp: 1.8 μm) in combination with an Acquity Phenyl-Hexyl 1.8 μm Vanguard pre-column, both from Waters. The mobile phase A consisted of 0.1% AA in water, while mobile phase B was MeOH. A gradient elution was performed: 0–0.25 min (60% A, 40% B), 11.0 min (linear gradient to 90% B), 11.0–14.5 min (10% A, 90% B), 14.8 min (linear gradient to 60% A), 14.8–18.0 min (60% A, 40% B). The flow rate was 0.3 mL/min. It should be mentioned that the composition of the reconstitution solvent (water/MeOH (15/85, v/v)) not fully matched with the starting conditions of the chromatographic method (40% MeOH). Ideally, more similar conditions are used. Our sample preparation methodology was based on the protocol of a multi-mycotoxins LC–MS/MS method as described by Lauwers et al. (2019). According to this protocol, a reconstitution solvent of water/methanol (15/85, v/v) was the best compromise for the analysis of multiple mycotoxins with different physico-chemical properties. Nevertheless, as can be seen from the chromatograms in Fig. 5, this discrepancy between reconstitution solvent composition and initial chromatographic conditions did not result in peak distortion during chromatography. The temperatures of the column oven and autosampler tray were set at 40 °C and 8 °C, respectively. The UPLC column effluent was interfaced to a Xevo TQ-XS® MS/MS system, equipped with an electrospray ionization (ESI) probe operating in the negative ion mode (all from Waters). A divert valve was used and the UPLC effluent was directed to the mass spectrometer from 3.5 to 14.5 min. Instrument parameters were optimised by direct infusion of working solutions of 100 ng/mL of all analytes and the IS at a flow rate of 10 μL/min and in combination with the mobile phase (50% A, 50% B, flow rate: 200 μL/min). The following parameters were used: capillary voltage: 2.7 kV, source offset: 30 V, source temperature: 130 °C, desolvation temperature: 550 °C, desolvation gas: 800 L/h, cone gas: 150 L/h, nebuliser pressure: 7.0 bar, LM resolution 1 and 2: 2.8 and 2.7 respectively, HM resolution 1 and 2: 14, ion energy 1 and 2: 0.4 and 0.8 respectively, collision gas flow: 0.15 mL/min. MS/MS acquisition was performed in the multiple reaction monitoring (MRM) mode. The MRM transitions for AOH, AME and their IS, as well as cone voltage, collision energy and retention times are shown in Table 1.
Table 1 MRM transitions and MS/MS parameters for alternariol (AOH), alternariol monomethyl ether (AME) and the internal standards (AOH-d4 and AME-d4)The UPLC system for urine analysis consisted of an Acquity Classic Binary Solvent Manager and Sample Manager with temperature controlled tray and column oven from Waters. Chromatographic conditions were the same as for UPLC-MS/MS analysis of plasma. The UPLC column effluent was interfaced to a Quattro Ultima® MS/MS system, equipped with an ESI probe operating in the negative ion mode (all from Waters). A divert valve was used and the UPLC effluent was directed to the mass spectrometer from 3.5 to 14.5 min. The following parameters were used: capillary voltage: 2.7 kV, source offset: 30 V, source temperature: 130 °C, desolvation temperature: 400 °C, desolvation gas: 800 L/h, cone gas: 58 L/h, nebuliser pressure: 7.0 bar, LM resolution 1 and 2: 2.8 and 2.7 respectively, HM resolution 1 and 2: 15, ion energy 1: 1.0 and ion energy 2: 3.0, collision gas flow: 0.15 mL/min. MS/MS acquisition was performed in the MRM mode using the transitions as shown in Table 1.
Method validationMatrix-matched calibration curves and validation samples were prepared using an in-house stock of pooled plasma and urine samples from at least two control pigs receiving no AOH or AME. These control pigs were pigs from the same breed and of both sexes (Seghers Hybrid® from RA-SE Genetics (Lokeren, Belgium)). The age and size (b.w.) of the control pigs ranged from just weaned piglets (about 4 weeks of age, about 6 kg b.w.) up to about 8 weeks of age (about 20 kg b.w.). Plasma of both sexes was pooled to provide a stock of plasma. For urine, only urine from male pigs was pooled since urine was collected using non-invasive pouches which can technically only be placed on male pigs (Gasthuys et al. 2017b). Before using this pooled plasma and urine to prepare matrix-matched calibration curves and validation samples, a sample was tested to check the absence of the analytes studied.
The validation protocol and acceptance criteria were based on guidelines issued by the International Council for Harmonisation of Technical Requirements for Pharmaceuticals for Human Use (ICH 2022) and the International Cooperation on Harmonisation of Technical Requirements for Registration of Veterinary Medicinal Products (VICH 2015). Following validation parameters were evaluated: linearity, within- and between-run accuracy and precision, LOQ and LOD. The experiments for linearity and between-run accuracy and precision were performed over 3 days. The LOQ was determined using spiked samples, whereas the LOD was calculated using the results of the LOQ samples as the concentration that corresponds to a signal-to-noise ratio (S/N) of 3.
The results of the linearity (concentration range, correlation coefficient r and goodness-of-fit coefficient gof), within- and between-run accuracy and precision (the latter expressed as relative standard deviation or RSD), LOQ, and LOD for AOH and AME in plasma and urine can be found in Supplementary Table S1 and Table S2. The tables also show the acceptance criteria handled.
Qualitative LC-HRMS analysis for metabolite profilingMetabolite profiling was performed using multiple-stage and high-resolution mass spectrometry (HRMS). First, exact mass measurements of putative phase I and II metabolites in urine samples were carried out using LC-HRMS analysis. The urine extracts as prepared for the targeted UPLC-MS/MS analysis mentioned above, were injected on an Acquity I-Class UPLC instrument coupled to a Synapt® G2-Si HDMS mass spectrometer (all from Waters). The chromatographic conditions were the same as described for the UPLC-MS/MS analysis. HR-MS instrument parameters were optimized by syringe infusion of a standard mixture solution of AOH and AME. The following HR-MS parameters were used: capillary voltage, 2.50 kV; sampling cone voltage, 40.00 V; source offset, 80.00 V; source temperature, 150 °C; desolvation temperature, 550 °C; cone gas flow, 150 L/h; desolvation gas flow, 800 L/h; nebuliser gas flow, 6.50 bar; lock spray capillary voltage, 2.50 kV. HR-MS acquisition was performed from 1.5 to 15.0 min in the negative ESI resolution mode using the MS continuum scan function. Time-of-flight (TOF) MS settings were as follows: low mass, 50 Da; high mass, 600 Da; scan time, 0.1 s; data format, continuum. The lock mass solution consisted of leucine encephalin (200 pg/μL). The lock spray was acquired during HR-MS acquisition, but no correction was applied. The lock spray settings were as follows: scan time, 0.215 s; interval, 30 s; scans to average, 3; mass window, 0.5 Da. Data processing and lock mass correction (m/z 554.262022) was performed using the Unify software (Waters). Identification of analytes was based on retention time (target TR tolerance: 0.1 min) and mass (target mass tolerance: 10 ppm). The search for phase I and II metabolites of AOH and AME was performed using the ‘Accurate Mass Screening on MSe Data’ approach. The following transformations were added to the method (Supplementary Table S3), based on Burkhardt et al.. (2011, 2012) and Pfeiffer et al. (2007): phase I transformations: reduction (+ H2), oxidation (+ OH), desaturation (-H2); phase II transformations: sulfation (+ SO3), glucuronidation (+ C6H8O6), methylation (+ CH2). Due to the lack of commercially available analytical standards for phase I and II metabolites, a qualitative approach was followed by presenting chromatographic peak areas only. Furthermore, Supplementary Table S3 shows acceptable mass error values of these compounds (both in mDa and ppm), calculated based on the theoretical and observed neutral mass.
For plasma metabolite profiling, the major metabolites found in urine were included in an additional qualitative analysis on the Xevo TQ-XS® MS/MS instrument. Therefore, the monoisotopic mass of the precursor ion ([M-H]−) was calculated using the molecular weight calculator of the MassLynx software. Product ions were selected based on literature data (Appel et al. 2021; Burkhardt et al. 2011; Puntscher et al. 2019) and are shown in Table 1.
Toxicokinetic modelingThe jugular plasma concentration–time data after IV administration were fitted to a one-compartmental (AME) or two-compartmental (AOH) toxicokinetic model with first-order elimination. Model fit was based on visual inspection of the goodness of fit plots, −2 log likelihood (−2LL) and precision of the parameter estimates. A model was only retained if it consistently demonstrated a robust fit across the different individual piglets. A multi-compartment model is generally more appropriate when the data suggest distinct distribution phases, whereas a one-compartment model suffices when the compound exhibits relatively uniform distribution and elimination behavior. It should be noted however that the number of compartments in a toxicokinetic model does not necessarily correspond to the compound’s actual physiological behavior, it is merely about fitting the available data. Hence, for a more mechanistic understanding, physiologically based pharmacokinetic (PBPK) modeling would be more appropriate, but this was outside the scope of the current study. The following toxicokinetic parameters were calculated based on IV administration: total body clearance (CL), volume of distribution at steady state (Vd), plasma concentration at time 0 h (C0), elimination rate constant (ke) and elimination half-life (t1/2el). No model fitting was possible on the data derived from PO administration.
The absolute oral bioavailability (F, expressed as percentage) is defined as the percentage of the dose that is absorbed intact into the systemic circulation, and was calculated using the following equation:
$$F\left( \% \right) = \frac }} }} * 100$$
The areas under the plasma concentration–time curves from time 0 to infinity (AUC0-∞) were computed using the linear up-log-down trapezoidal method via non-compartmental analysis. Additionally, for PO data the descriptive toxicokinetic parameters maximal plasma concentration (Cmax) and time to Cmax (tmax) were given. For PO administration, data may deviate from the expected textbook profile due to substantial inter-individual variability in the absorption process. Given this variability, a non-compartmental analysis approach was chosen, as it allows direct analysis of the data without imposing structural model assumptions. This approach is not only equivalent but can be the preferred method in certain contexts, such as bioequivalence studies or studies comparing the toxicokinetic behavior of structurally related compounds. All data were processed using Phoenix 8.1 (Certara, Princeton, NJ, USA). Results are presented as mean values ± SD.
The urinary fraction excreted unchanged (fe) was calculated for each animal by dividing the cumulative amount of AOH or AME excreted in urine (Ar,∞) by the dose of AME or AOH administered via IV route (2 mg/kg b.w.). The cumulative amount excreted (Ar,∞) was calculated by summing the amounts excreted during each individual collection interval (urinary conc * urinary volume).
Comments (0)