
Remember me
The generation of functional devices containing 2- or 3-electrode systems is feasible when a non-conductive porous substrate, e.g., filter paper, for nanofiber collection as shown in our previous studies [15, 22]. However, the fabrication and manufacturing process are typically more complex and take longer to complete; we therefore fabricated Pt/Ni-LCNFs on ITO/PET and used them as a WE. Furthermore, the use of standard platinum wire and Ag/AgCl as a CE and RE, respectively, in our electrochemical cell could ensure the actual effects that come from the WE material under test, which is our primary focus. Nevertheless, once the Pt/Ni-LCNFs have been well investigated for serving as a WE further manufacturing of device with 2- or 3-electrode system solely from Pt/Ni-LCNFs would be possible.
The electrical resistance of Pt/Ni- LCNF electrodes was 290 ± 5 Ω·cm (n > 5) which indicated favorable reproducibility of the production process. In this work, even the mechanical stability of Pt/Ni-LCNF electrodes has not been tested, our previous study has proven that the microstructure of Ni-LCNF on ITO/PET that was used under stirred condition remained unchanged [17]. Furthermore, we aim to use the electrodes under stagnant condition in point-of-care testing and thus believe the mechanical stability should be sufficient.
We investigated LCNF without metal (Fig. 1Ai), 100Pt-LCNF (Fig. 1Aii), 50Pt/50 Ni-LCNF (Fig. 1Aiii), and 100 Ni-LCNF (Fig. 1Aiv) using transmission electron microscopy (TEM). The average radii of the nanoparticles investigated are as follows: 1.4 ± 0.6 nm for 100Pt, 1.1 ± 0.7 nm for 50Pt/50 Ni, and 2 ± 1 nm for 100 Ni. Figure 1A also provides a detailed size distribution of the radii for each metal composition.
Fig. 1
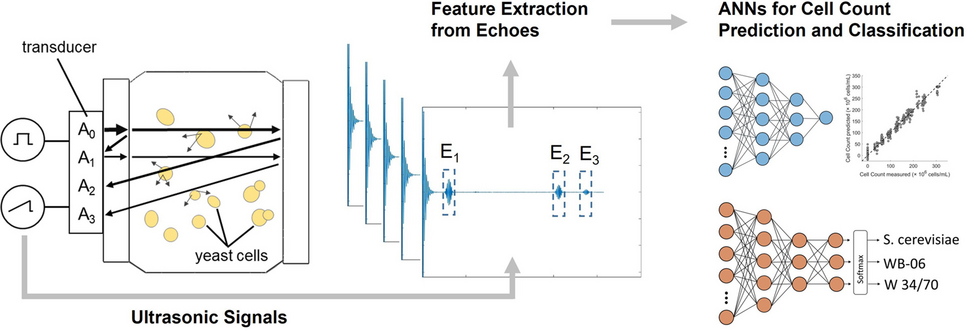
Structural and composition analysis of the laser-generated LCNFs with various Pt and Ni content. A An overview of TEM images and the respective size distribution (radius of nanoparticles) of (i) LCNFs, (ii) 100Pt-LCNFs, (iii) 50Pt/50 Ni-LCNFs, and (iv) 100 Ni-LCNFs. B The crystalline structure of (i) LCNFs, (ii) 100Pt-LCNFs, (iii) 50Pt/50 Ni-LCNFs, and (iv) 100 Ni-LCNFs revealed by HRTEM. C STEM-EDS image showing (i) the mapping area of 50Pt/50 Ni alloy core–shell nanoparticle focused on (ii) Pt, (iii) Ni, and (iv) Pt-Ni overlay. D STEM-EDS image showing (i) the mapping area of 50Pt/50 Ni alloy non-core–shell nanoparticle focused on (ii) Pt, (iii) Ni, and (iv) Pt-Ni overlay
Furthermore, high-resolution TEM (HRTEM) was employed to investigate the crystal structure. Specifically, we examined (i) the graphite-like structure of LCNF and (ii) the metal nanoparticles (Fig. 1B). In Fig. 1Bi, we observed various (001)-d-spacings of the graphite-like carbon matrix, ranging from 0.71 to 0.75 nm. For comparison, pure graphite would exhibit a (001)-d-spacing of 0.672 nm [23]. This result suggests that LCNFs contain several functional oxygen groups, which increase the distance between stacked graphene sheets. An irregular occurrence of these functional groups likely contributes to the varying distances between the sheets. Consequently, we can infer that the carbon matrix is similar to graphene oxide (GO) or reduced graphene oxide (rGO).
Regarding the nanoparticles in 100Pt-LCNF and 50Pt/50 Ni-LCNF (Fig. 1Bii + iii), both exhibit similar (111)- and (100)-d-spacings. These values align with literature data: (111)-d-spacing of 0.226 nm/0.236 nm vs. 0.227 nm for pure Pt [24] and 0.225 nm for PtNi alloy [25]; (100)-d-spacing of 0.398 nm/0.396 nm vs. 0.392 nm for pure Pt [24] and 0.389 nm for PtNi alloy [25]. The measured angle between the (111) and (100) planes of 55° matches perfectly with the theoretical value of 54.7° for a cubic system.
Figure 1Biv shows that 100 Ni particles have a (111)-d-spacing of 0.246 nm and a (100)-d-spacing of 0.429 nm. Comparing these values to XRD measurements in literature [26], we find that they are closer to a NiO lattice rather than a Ni lattice (2θ of (111) equals 37.26° for NiO and 44.50° for pure Ni, resulting in a (111)-d-spacing of 0.24 nm and 0.20 nm, respectively. Furthermore, 2θ of (200) equals 43.29° for NiO and 51.86° for Ni, giving a (100)-d-spacing of 0.42 nm and 0.36 nm, respectively).
Finally, STEM-EDX analysis of different 50Pt/50 Ni particles revealed that out of 10 investigated particles, 70% of them are nanoparticles with a Ni-rich core and a Pt-rich shell as shown in Fig. 1 Ci-iv, and 30% of the investigated nanoparticles have an equal distribution of both elements (Fig. 1 Di-iv). The results suggested that synthesis of nanoparticles during laser scribing tends to be rather random, with a general preference of Ni-atoms to be located inside the particles. However, when the nanoparticles contain higher amounts of Ni, there is a greater likelihood that Ni will be also present on the surface.
The correlation between morphological structures and the metal compositions of Pt/Ni-LCNFs was thoroughly characterized using scanning electron microscopy (SEM) in a previous work [18]. Thus, we only provided the exemplary SEM images of 50Pt/50 Ni-LCNFs in the current study (Figure S1C). The distorted fibrous structure can be expected due to harsh conditions of the single laser exposure process. However, the resulting edges and defects are likely to be beneficial as they may serve as active sites and enhance the accessibility of analytes to the embedded nanocatalysts. For further detail on the microstructures of LCNFs with other metal combinations, the authors guided readers to our previous study [18].
In the previous study, we also performed SEM–EDX analysis to reveal global information on the distribution of nanoparticles over the chosen electrode area and the percentage of Pt, Ni, O, and C found within the Pt and/or Ni-LCNFs. However, as the surface chemistry of Pt and/or Ni-LCNFs play a pivotal role in electrocatalytic reactions of enzyme-free sensors, the SEM–EDX data in the previous study are insufficient. Therefore, we want to further explore these aspects in more detail using X-ray photoelectron spectroscopy (XPS). An in-depth interpretation of XPS data was given in Figures S2 and S3 and revealed that the kind of metal salt added to the spinning solution, e.g., Pt(II)- or Ni(II)-acetylacetonate, has a great impact on the amount of oxygenated functional groups of the LCNFs. Furthermore, XPS data confirmed the formation of a Pt-Ni-alloy when both metal salts were mixed (Figure S4).
Small-angle X-ray scattering (SAXS) is a useful technique for assessing structural information of carbon nanomaterials [27]. To our knowledge, SAXS has never been used for characterization of laser-induced carbon nanomaterials and their hybrids. SAXS revealed that increasing metal content (more pronounced for Ni than for Pt) leads to a greater degree of uniform stacking of rGO sheets in which the detailed discussion is given in Figures S5-S7. The observations were explained by the respective heat conduction capability of both metals.
Pt/Ni-LCNFs for glucose detection—single measurement per electrodeOriginally, we aimed to introduce Pt and Ni into LCNFs to enable the detection of glucose under physiological pH as previously reported by other studies [6, 28]. However, the laser-generated Pt/Ni embedded LCNFs did not provide the result as expected. None of the metal combinations yielded any useful signal for glucose detection at pH 7.7 (Figure S8). This is likely due to the difference in preparation method of Pt/Ni alloy and how Pt/Ni are organized within the carbon nanomaterial matrix, which critically affects the electrocatalytic ability. As shown by Mei et al. [6], PtNi nanoparticles were able to oxidize glucose at physiological pH when attached to multi-walled carbon nanotubes (MWCNTs). However, no catalytic activity was observed when pristine carbon black was used as the matrix.
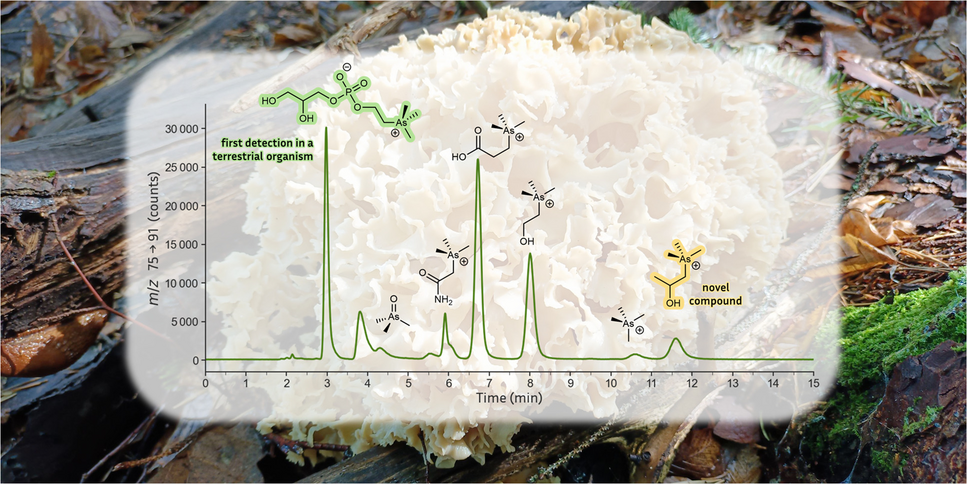
The electrocatalytic reaction of our LCNF electrodes can be seen only when Ni is present in high contents, and the measurement is performed at basic pHs. This might be explained by the formation of core–shell structure rather than random distribution of Pt and Ni atoms on the nanocatalyst’s surface (see also Fig. 1C) which may hinder the mutual benefit of Pt and Ni in enabling electrocatalytic reaction of glucose at neutral pHs. Figure 2A depicts the linear correlation between detection sensitivity of glucose per pH and Ni content (from 25 to100%) evaluated from Figure S8, suggesting the important role of Ni and OH− for glucose oxidation, as generally known in the following reactions:
Fig. 2
Electrochemical characterizations of electrodes for glucose detection. A Impact of Ni content on the sensitivity of glucose considering the anodic currents at + 0.7 V and a pH above 11.5 (Figure S8). B Optimization of electrochemical pretreatment conditions for increasing pH locally (n = 3)
$$}^+ 2\text^-\to (\text)}_$$
(1)
$$\text)}_2+\text^-\leftrightarrow\text(\text)+\text^-+}_2\text$$
(2)
$$\text(\text)+\text\rightarrow\text)}_2+\text$$
(3)
As it is important to provide OH− to allow the electrocatalytic reaction of glucose to be possible under physiological pH, in situ electrochemically generation of OH− at the Pt vicinity through the water splitting reaction (4 H2O + 4e−\(\to\) 2 H2 + 4 OH−) prior to glucose measurement by CV was thus studied. Hereby, the LCNF electrodes containing either Pt or Ni alone did not result in any promising anodic peak from glucose oxidation under the investigated pretreatment conditions (Figure S9). In contrast, the electrodes with Pt/Ni alloy exhibited the expected outcome. Nevertheless, it is necessary to modulate Pt and Ni composition as well as the pretreatment conditions, i.e., voltage and time, to enable efficient in situ generation of OH− and electrocatalytic oxidation of glucose (Fig. 2B). The ratio of Pt and Ni can greatly affect the electrocatalytic oxidation. As the core (Ni)-shell (Pt) structure is formed (Fig. 1C-iv) in this case, a small amount of Ni is unfavorable. This can be clearly supported by the inability of 75Pt/25 Ni-LCNFs to promote electrocatalytic oxidation of glucose even when the electrodes were pretreated prior to glucose measurement (Figure S9). The pretreatment at greater negative voltages and longer times generates higher glucose responses as expected. Here, the 25Pt/75 Ni-LCNFs pretreated at − 0.9 V for 20 s were selected due to their greatest sensitivity, favorable reproducibility, short pretreatment time, and lower cost (less use of Pt). It should be noted that increasing the voltage of pretreatment, e.g., up to − 1 V, adversely resulted in poorer signal reproducibility. Some other previous studies have employed much higher voltages: − 1.5 V for OH− generation and + 1.0 V for 2 s for electrode cleaning [20], and multiple potential steps including − 2.0 V for 20 s to provide the alkaline condition, 0.2 V for 5 s to oxidize glucose, and 1.0 V for 2 s to clean the electrode surface [19]. The lower potential used in our study underscores the efficiency of the bimetallic catalysts and allows the use of more affordable potentiostats that are not capable of applying high potentials, further reducing the overall cost of the setup.
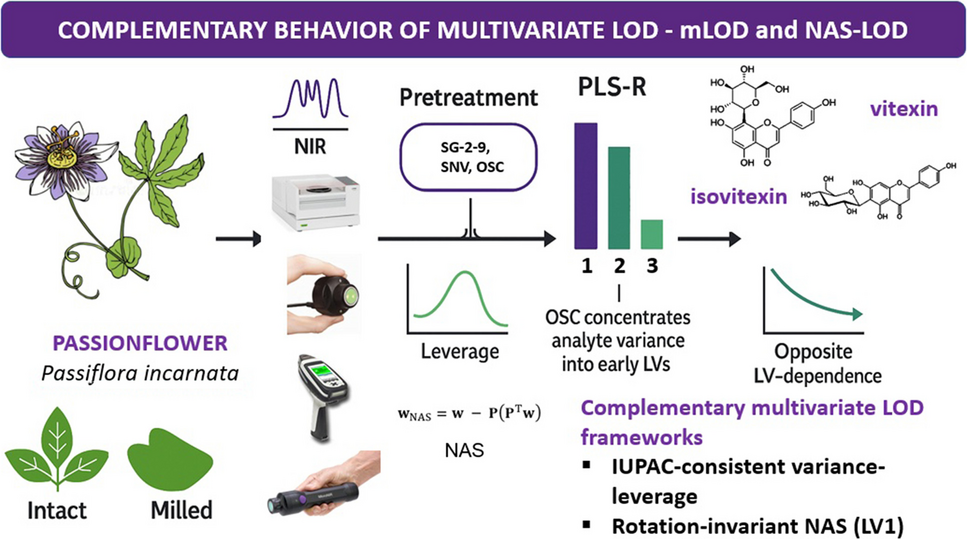
In order to prove whether the glucose properly undergoes electrocatalytic reaction as commonly achieved from basic solution, we performed CVs that compared the signals of the glucose measurements in PBS buffer with adjusted pH of 11.8 and with electrochemically generated OH− prior to the CV measurements (Fig. 3A). The region from + 0.6 V to + 0.9 V, where electrocatalytic reaction of glucose occurs, is still similar to the case of PBS buffer at pH 11.8 (absence of glucose), indicating the formation of Ni(OH)2 species which gets oxidized to NiO(OH) (see Figure S8 and reaction 2) [17]. Additionally, the proper increase of anodic current at around + 0.7 V when glucose is present thus confirmed that in situ generation of OH− assisted by Pt allows glucose measurement even if it is originally present at physiological pH. Furthermore, the intensity of anodic current at around + 0.7 V is proportional to glucose concentration (Fig. 3B-ii) but suffers from undesirable reproducibility (5–16% RSD). However, for freshly used electrodes, the pretreatment produces a non-negligible peak at around + 0.15 V, which is absent when performing CV in PBS buffer pH 11.8. Although we are not clear yet about the source of the peak, the intensity of the peak at + 0.15 V correlates with the peak intensity at + 0.7 V and provides additional information on the activity of the individual electrode. With this, normalization of the signals at + 0.7 V with the maximum peaks at around + 0.15 V enabled the generation of greater reproducible signals with variations at only 2–8% RSD when using a new electrode for each measurement (Fig. 3B-iii).
Fig. 3
Electrochemical detection of glucose using in situ generation of OH− strategy prior to CV measurement. A Proof-of-principle of electrocatalytic reaction (i) without and (ii) with glucose characterized by CV. B (i) Exemplary CVs at various concentrations of glucose using pretreatment strategy (− 0.9 V for 20 s), and (ii and iii) improving reliability of data acquisition (n = 6). The CV measurement was conducted using a 50 mVs−1 scan rate
After the in situ electrochemical pretreatment at − 0.9 V, a strong charging current was observed during the anodic scan (Figure A and B-i) which cannot be seen from the CVs obtained from the basic buffer. The species generated from pretreatment were initially present at high concentration and contributed to the high anodic current. Nevertheless, during the cathodic scan, the current tended to reduce and appeared at similar level as observed from that of the basic solution, suggesting the decrease in the amount of the as-generated electrochemical active species over time. Additionally, the accumulation of in situ generated OH− at the Ni surface immediately after treatment probably results in a strong charging current, which does not occur at the end of the measurement. Accordingly, the starting and end points of CV are not merged when using the in situ electrochemical pretreated electrodes.
Furthermore, the effect of electrode aging was investigated and showed the best performance after 2 days (Figure S10-S11). Further aging drastically worsened LOD due to an increasing hydrophobic character of the electrode. However, a short incubation of the electrodes in a 0.05 w% Tween- 20 solution before measurement solved this issue and enhanced the performance even after 20 days. Additionally, disinfection (incubation in 70% ethanol for 10 min) and sterilization (autoclaved at 121 °C for 15 min) of the electrodes did not harm the electrodes (Figure S12).
Pt/Ni-LCNFs for glucose detection—multiple measurements per electrodeEven though the single measurement approach shown in section “Results and discussion” offers acceptable detection sensitivity, we still aim to further enhance the analytical performance. The poor wettability and microstructures with rough surface topography of pristine Pt/Ni LCNF electrodes could be a limiting factor for detection ability in the single measurement approach described in section “Pt/Ni-LCNFs for glucose detection—single measurement per electrode” (Figure S1C). In this case, the glucose solution may primarily react with the surface, rather than penetrating deeper into the porous structure. As a result, we attempted to measure the glucose solution using the same electrodes over multiple runs, which could improve surface wettability. However, it is crucial to ensure that the signal from each subsequent measurement remains unaffected by the previous one. Initially, we performed multiple measurements of 10 mM glucose on the same electrode, applying a pretreatment at − 0.9 V for 20 s prior to each CV scan. However, the oxidation current significantly decreased over successive scans (Figure S13 A), likely due to electrode fouling from adsorbed reaction products. To address this, we tested an electrochemical cleaning procedure by applying potentials of − 0.2 V, 0.0 V, or + 0.2 V for 60 s after each CV scan, prior to replacing the old drop with a new drop of glucose solution (Figure S13B). We found that a slightly negative potential (− 0.2 V) was optimal, while potentials of 0.0 V and + 0.2 V worsened the reusability of the electrode. Since the reaction product of glucose oxidation is gluconolactone, which further reacts with water in a hydrolysis reaction to gluconic acid [29], we assume that deprotonated gluconic acid interacts with Ni sites in higher oxidation states (Figure S4). Gluconic acid can be removed from the catalyst surface through a slightly negative electrochemical cleaning step. Without such a cleaning step, the harsh pretreatment at − 0.9 V for 20 s might induce further reactions with gluconic acid, rather than simply removing it from the catalyst surface.
In addition, we hypothesized that the detection sensitivity is mainly hindered by the large capacitive background current after OH− generation (Fig. 3). To address this issue, we implemented an electrochemical stabilization procedure to achieve lower background CV signal. Specifically, five CV scans were performed repeatedly in PBS, with a fresh drop introduced for each measurement scan on the same electrode (see section “Electrochemical measurements” for details). Clearly, the stabilization step reduced the capacitive current over the course of the five CV scans. The unknown anodic peaks at around + 0.15 V disappeared, while the peak couples at ca. + 0.7 V and + 0.5 V (corresponding to reaction 2) became more prominent in the later scans (Fig. 4A). We assumed that the repeated CV scans in PBS helped remove edges/defects of LCNFs, thereby exposing more catalytic sites through electrochemical etching.
Fig. 4
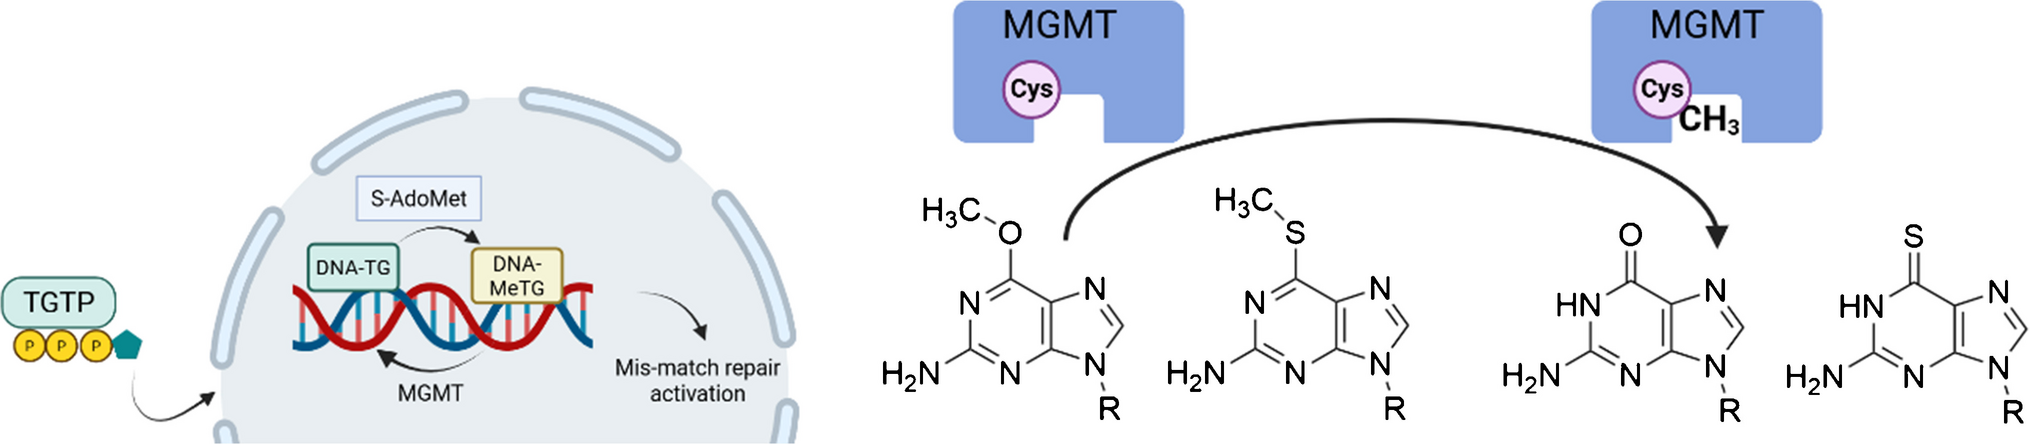
Continuous measurements of glucose on one electrode. A pretreatment of − 0.9 V before each CV measurement was conducted for 20 s. A Stabilization of signal and diminishing of background current after 5 CV measurements in PBS. B CVs of various glucose concentrations measured consecutively. The CV of PBS is the same CV as the 5 th measurement in (A). C Dose–response curve considering the anodic current at + 0.7 V. D Dose response curve considering the ratio between the current at + 0.7 V and the reduction peak at + 0.5 V. Since the ratio is a negative value, the absolute value was plotted
As expected, the consecutive CV signals show a strong proportional relationship with the introduced glucose concentrations (Fig. 4B). The anodic current at + 0.7 V was taken as the signal response (Fig. 4C), exhibiting Michaelis–Menten behavior with Km = 1.3 mM and Vmax = 112 µA. These values were calculated using the equation I = \(\frac}_} \bullet \text(\text)}}_}+\text(\text)}\) + I(c(Glu) = 0 mM. The Km value suggests that at a glucose concentration of 1.3 mM, half of the available catalyst actively undergoes reactions with glucose at a potential of + 0.7 V. The linearity of the curve was observed in the range of 0.1 mM–0.5 mM (R2 = 0.999; considering the data points at 0 mM, 0.1 mM, and 0.5 mM), resulting in the LOD of 0.06 \(\pm\) 0.04 mM (S/N = 3) and a sensitivity of 50 µA/mM.
As an alternative to direct data readout of the anodic peak at + 0.7 V (Fig. 4C), we found that taking the ratio between the anodic current (around + 0.7 V) and the cathodic current (around + 0.5 V) extended the linear range (Fig. 4D). This approach revealed two distinct linear correlations: one between 0.1 and 4 mM (R2 = 0.994) and another between 5 and 8 mM (R2 = 0.992), with a LOD of 0.3 ± 0.1 mM (S/N = 3). Compared to Fig. 4C, this data acquisition strategy expanded the linear range by a factor of 8. We hypothesize this following discussion to support why taking the ratio can expand the linear range.
Compared to using the oxidation peak at + 0.7 V for ratiometric data analysis, we understand the meaning of the reduction peak (at around + 0.5 V), which corresponds to the reduction of the catalyst that did not react with glucose:
$$\text(\text)+}_2\text+\text^-\rightarrow\text)}_2+\text^-$$
At concentrations of 0.5 mM and above, sufficient glucose is present to significantly reduce the catalyst during the entire scan. Consequently, even though the catalyst is saturated during the anodic scan, a lower cathodic current corresponding to the reduction peak of the catalyst is additionally observed, further increasing the ratio at higher glucose concentrations. This straightforward approach extends the linear range from 0.1–0.5 mM (Fig. 4C) to 0.1–4 mM (Fig. 4D), as we are no longer only dependent on the maximal reaction rate at + 0.7 V in the anodic scan.
Selectivity studyLike other enzyme-free electrodes, electroactive interfering species can be problematic, requiring careful investigation. To address this, we examine the effect of interfering species commonly found in blood by adding them to the 1 mM glucose in PBS solution at their relevant clinical concentrations [29], i.e., 0.4 mM uric acid (UA), 125 mM NaCl (nearly double the NaCl concentration in PBS), 0.1 mM ascorbic acid (AA), 0.02 mM cysteine, and a mixture of all of these species.
Initially, we assessed the selectivity of these interfering species for the single measurement per electrode approach (see also section “Pt/Ni-LCNFs for glucose detection—single measurement per electrode”). Unfortunately, species such as UA, NaCl, and AA interfered with the glucose measurements (Fig. 5A). This could be due to the high number of edges/defects the pristine Pt/Ni-LCNFs, which may provide favorable site for electroactive interfering species [30]. Additionally, in comparison to our previous study where glucose was measured on Ni-LCNF electrodes in alkaline medium, NaCl at 250 mM showed negligible interference [17]. This suggests that the high background current in the single measurement approach, used to calculate the ratiometric signal, can be easily influenced by interfering species. However, in practical applications involving complex samples like blood, food, and beverage, dilution is commonly performed, which could help mitigate interference effects.
Fig. 5
Selectivity study. (A) single measurement per electrode approach: (i) the exemplary CVs randomly chosen from all measurements, and (ii) the corresponding self-calibrated signals (n ≥ 3). (B) multiple measurements per electrode approach: (i) CVs and (ii) the corresponding self-calibrated signals (n = 1) where the dash line indicated the mean value of PBS + 1 Glu mM and the highlight indicated its error range
Alternatively, when we conducted the selectivity study using the multiple measurements per electrode approach (see section “Pt/Ni-LCNFs for glucose detection—multiple measurements per electrode”), we observed that this strategy showed high selectivity for glucose, as indicated by the slight deviations in the signal when comparing glucose in PBS with and without interfering species (Fig. 5B). This favorable selectivity could be attributed to the electrochemical etching that occurs during stabilization process (five consecutive CV scans in PBS). This procedure not only eliminates edges and defects where electroactive species such as AA and UA prefer to react, but also exposes more active catalytic sites for glucose, allowing for a more selective reaction. Furthermore, because CV is used, fast reacting species react at lower potentials, reducing their concentrations during the glucose oxidation. The most prominent interfering signal arose from UA, as evidenced by the oxidation peak at around + 0.3 V (Fig. 5Bi). Additionally, consecutive measurements on the same electrode with and without glucose exhibited the high reliability of this approach (Fig. 5B ii). Finally, apart from the superior selectivity, the multiple measurement per electrode approach obviously enables a large discrimination between glucose and background signal (see also Fig. 5 A-ii and B-ii).
Recovery studyFinally, we assessed the performance of the sensor in human serum using the multiple measurements per electrode approach. The human serum contained 4.8 mM ± 0.1 mM (n = 3) glucose, according to measurements made with the commercially available Roche Accu-Chek®. However, we still faced challenges due to the matrix effect when measuring glucose in the human serum without dilution. Specifically, the pure human serum caused a significant reduction in the peaks associated with Ni(OH)2 (Figure S14 A), resulting in a self-calibrated signal of 5.4, which corresponds to approximately 1 mM glucose (compared to Fig. 4D). From the shift of the Ni peaks to higher potentials, we concluded that it was not possible to achieve the same local pH increase in undiluted human serum as was achieved with PBS solution. Attempts to increase the pretreatment time (up to 40 s) and apply a more negative potential (up to − 1.8 V) (Figure S14B) did not yield favorable results. We hypothesize that the proteins in human serum predominantly blocked the catalyst on the electrode, thereby hindering the performance of the sensor.
Alternatively, we conducted measurements in diluted serum (20% human serum, 80% PBS; resulting glucose concentration, 0.96 mM). We initially recorded a calibration curve (0 mM, 0.1 mM, 0.5 mM, 0.8 mM, 1.0 mM, 1.2 mM glucose in PBS) and then measured either the diluted human serum (20% human serum in PBS; 0.96 mM glucose) or the same solution spiked with 0.25 mM glucose (20% human serum in PBS; 1.21 mM glucose) (Fig. 6). Since good linearity was achieved within the calibration curve (Fig. 6B), we reduced the number of calibration points to a single glucose concentration (Figure S15, electrodes 5, 6) after the stabilization in PBS (5 measurements). Despite the catalyst being blocked by proteins, the ratiometric approach enabled to achieve a good recovery for diluted serum (99 ± 10%), and spiked diluted serum (91 ± 12%) (Table 1). This could be attributed to the self-correction of the CV signal, where both oxidation and reduction currents decreased concomitantly with catalyst blocking. Overall, the recovery for both the spiked and non-spiked measurements was 95 ± 10% (n = 6).
Fig. 6
Measurement in 20% human serum. (A) CVs of calibration in PBS solution and consecutive measurement in diluted human serum. (B) Respective ratios of (A)
Table 1 Measurement in undiluted and diluted (20%) human serum. Concentrations are calculated from data shown in Figure S15 (n = 3)Lastly, compared to some other reports that performed glucose measurement under physiological pH (Table S1), the Pt/Ni-LCNF electrodes feature low fabrication complexity (as well as cost of material) while their sensing capabilities under stagnant condition are favorable. Especially, in comparison to Au-deposited laser-scribed graphene electrodes reported by Berni et al., even a slightly better detection limit was reported, the detection system required stirring for enhancing mass transport, thus highlighting the advantage of the porous structure offered by Pt/Ni-LCNFs [31]. Nevertheless, as shown in our previous studies, a detection limit can be possibly improved by making an enclosed device where the solution within the microfluidic system can facilitate greater interaction between analyte and electrode surface [15, 22]. Finally, the proximity of Pt and Ni in the form of alloy could promote the use of lower cathodic potential OH− generation when compared to other studies [19, 20, 32].
Comments (0)