
Remember me

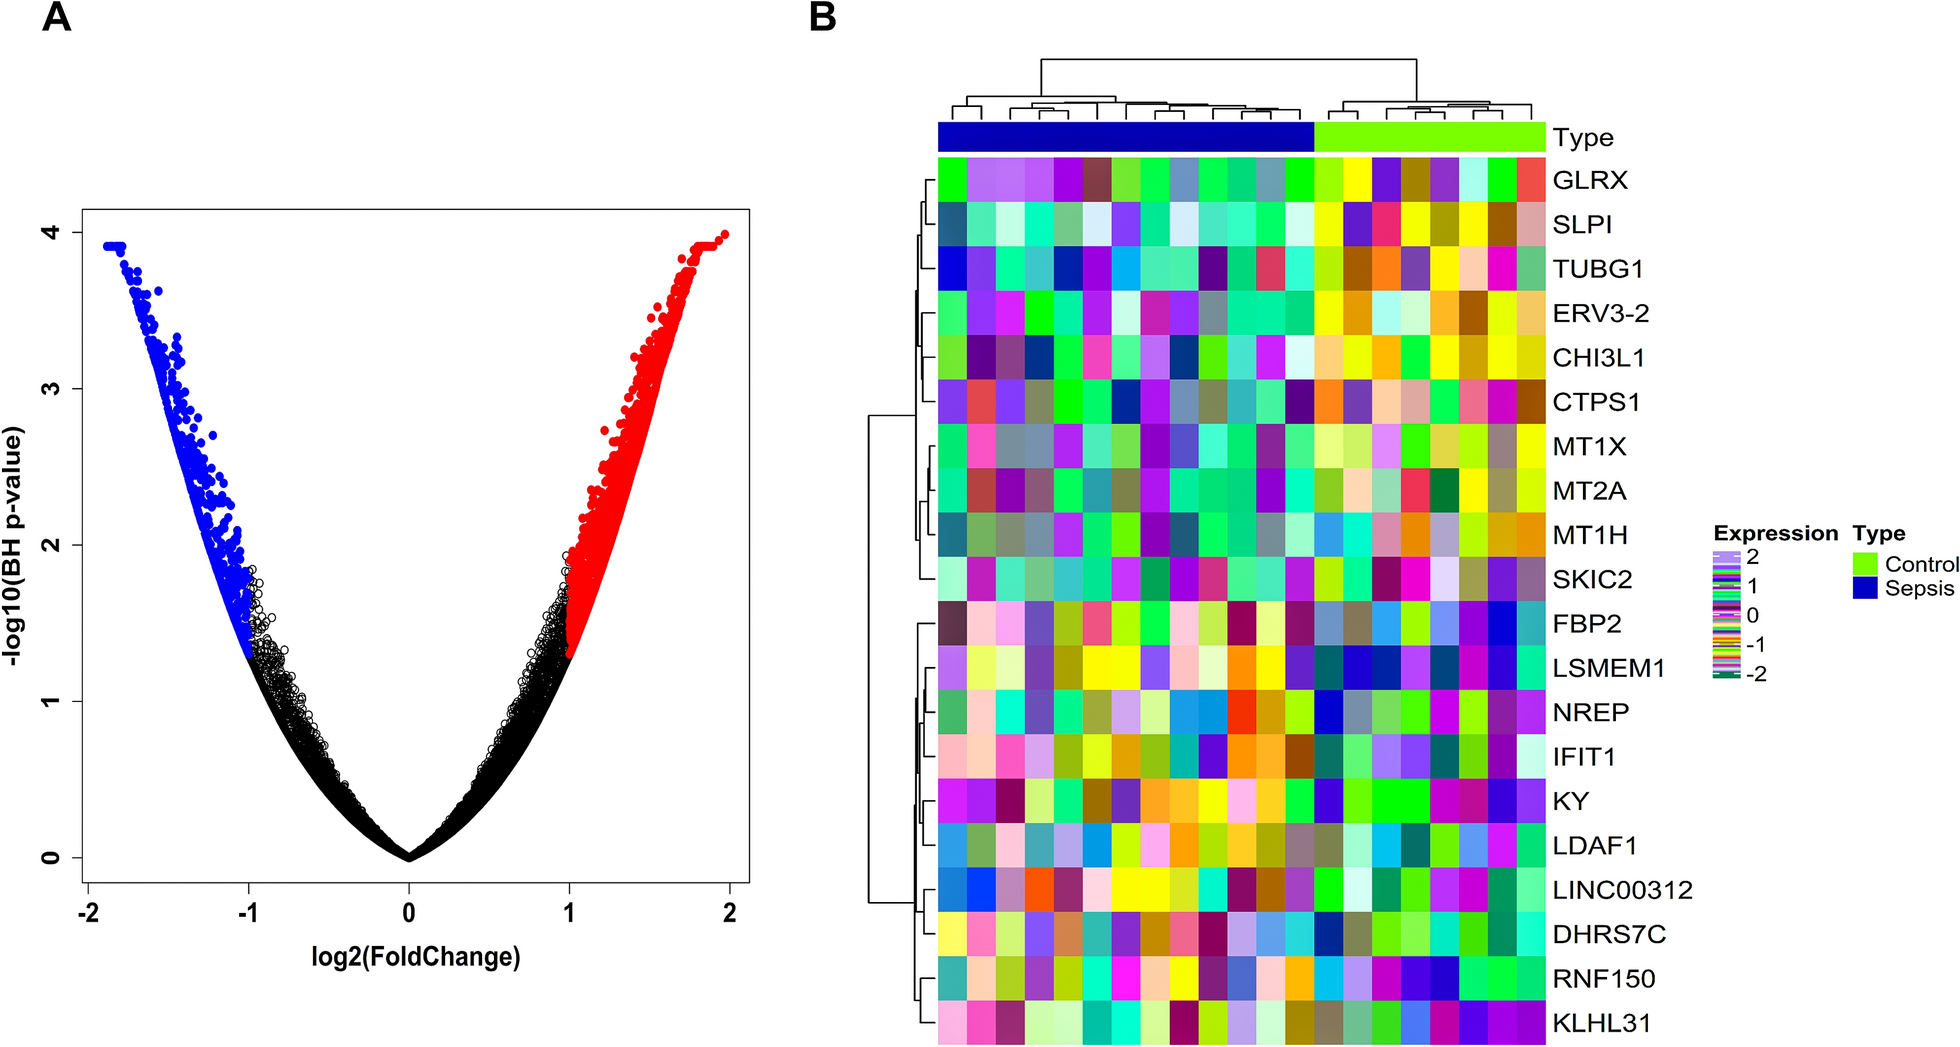


Using the established inclusion criteria, we selected the MODS expression dataset with accession ID GSE13205, which includes \(13\) septic patient samples and \(8\) control samples. Probe IDs were converted to their corresponding HGNC symbols with the “[HG-U133_Plus_2] Affymetrix Human Genome U133 Plus 2.0 Array” platform package. After averaging expression values for genes with multiple probe mappings, we obtained a set of \(\text\) unique genes. DEA identified \(2365\) genes with significant changes, meeting the threshold of \(\text- p-\text< 0.05\) and \(\left|}_(\text)\right|\) > 1. This set included \(703\) downregulated and \(1662\) upregulated genes, visualized in the volcano plot (Fig. 1A). Among these, LGI1 [\(\left|}_(\text)\right| = -5.34\)] showed the greatest downregulation, while SLPI [\(\left|}_(\text)\right| = 5.81\)] had the highest level of upregulation. Figure 1B displays a heatmap for the top \(10\) upregulated and top \(10\) downregulated DEGs. The heatmap clearly distinguishes the \(8\) control samples from the \(13\) sepsis samples.
Fig. 1
A Volcano plot showing the distribution of DEGs in sepsis-specific MODS vs controls. A total of \(2365\) DEGs are represented, with \(1662\) upregulated genes (\(}_\text> 1\)) highlighted in red and \(703\) downregulated genes (\(}_\text<- 1\)) highlighted in blue. The x-axis represents \(}_\)(fold change), while the y-axis represents the \(}_\) (adjusted p-value), emphasizing genes with high statistical significance and substantial fold change. B Heatmap illustrating the expression profiles of the top 10 upregulated and top 10 downregulated MODS-specific DEGs. Rows represent normalized expression values of selected DEGs, while columns correspond to individual samples. Sample groups are annotated by colored bars: light green for control samples and blue for sepsis samples
Non-trait based WGCN hub module/ gene selectionIn this study, we performed a non-trait-based WGCN analysis focusing on \(2365\) DEGs associated with MODS from the dataset, filtering out noise and ensuring that no outliers were present. After careful validation, we constructed the WGCN with the selected DEGs, resulting in a total of \(2175\) non-noisy DEGs. The optimal soft-thresholding power for network construction was determined to be \(\beta = 14\), corresponding to a \(^=0.8\). Figure S1 shows plots for \(\beta\) as per the scale-free topology (SFT) criteria. Utilizing hierarchical clustering and the dynamic tree cut (DTC) algorithm, we identified thirteen distinct color-coded modules: black, blue, brown, green, green-yellow, magenta, pink, purple, red, salmon, tan, turquoise, and yellow, which encapsulated the co-expression patterns in MODS cohorts (Fig. 2A). We calculated MEs to summarize expression profiles, revealing various module sizes, with the greenyellow module containing \(1650\) genes and the salmon module containing \(525\) genes after merging similar modules based on dissimilarity thresholds (Fig. 2B). Figure 2C–D shows scatterplots illustrating the correlations between MM and k.in for salmon and greenyellow modules. Among these, the greenyellow module was designated as the hub module based on its MM and k.in correlation data. Ultimately, we identified a total of \(179\) hub DEGs from the hub modules, defined by MM values exceeding \(0.9\), underscoring their potential significance in the biological mechanisms underlying MODS.
Fig. 2
A Hierarchical clustering dendrogram of \(2175\) DEGs associated with MODS. The dendrogram illustrates the clustering of these genes based on the dissTOM, revealing thirteen distinct color-coded modules: black, blue, brown, green, greenyellow, magenta, pink, purple, red, salmon, tan, turquoise, and yellow. These modules were identified using the DTC algorithm, highlighting the co-expression patterns among the genes linked to MODS. B Hierarchical clustering dendrogram post merging where similar modules were combined based on a predefined dissimilarity threshold. This consolidation led to the identification of two merged module colors: greenyellow module, which encompasses \(1650\) genes, and the salmon module consisting of \(525\) genes. C Scatterplots illustrates the relationship between k.in and MM for C salmon and D greenyellow modules
PPIN construction and modular analysisA total count of \(179\) hub genes identified within the hub module were analyzed using the STRING database, resulting in the successful mapping of \(176\) genes to the proteins they correspond to. Figure 3A illustrates the resulting PPIN, which consists of \(70\) nodes and \(157\) edges, based on an interaction score greater than \(0.9\). Modular analysis using molecular complex detection (MCODE) identified six distinct modules within the network. Among these, the first module, with the highest MCODE score of \(10.5\), was identified as the PPIN hub module. Second module comprised \(5\) nodes linked with \(10\) edges (\(\text=5\)) followed by third module comprising \(5\) nodes linked with \(9\) edges (\(\text=4.5\)), fourth, fifth, and sixth modules all comprising \(3\) nodes linked with \(3\) edges (\(\text=3\)). Figure 3B depicts the PPIN hub module, comprising 17 nodes and \(84\) edges.
Fig. 3
A Undirected and unweighted PPIN consists of \(70\) nodes and \(157\) edges, constructed using the STRING database with an interaction score threshold of \(>0.9\), indicating the highest confidence in interactions. Nodes represented in red signify upregulated proteins within the network. B Top-scoring PPIN module consists of \(17\) nodes and \(84\) edges, highlighting the most significant interactions within the network
GO term and pathway enrichment analysisIn our PPIN analysis, \(17\) DEGs were linked to the top five most significant pathways (Table 1). These DEGs were further enriched in the top five significant ontology terms, with the most significant terms identified across multiple categories (Tables 2, 3 and 4): GO-BP[(Ribonucleoprotein Complex Biogenesis (GO:0022613) with adjusted p-value \(= 4.71 \times 10^\)], GO-MF[(RNA Binding (GO:0003723) with adjusted p-value \(= 9.39 \times 10^\)], and GO-CC[(Nucleolus (GO:0005730) with adjusted p-value \(= 2.83 \times 10^\)]. Figure 4 shows overlapping hub DEGs among the top five significant pathways and associated GO terms included FBL, NOP14, UTP6, UTP4, UTP3, BMS1, NOP2, WDR43, and EBNA1BP2, suggesting their critical role in both functional pathways and molecular mechanisms.
Table 1 Top 5 significant pathways collected from Enrichr librariesTable 2 Top 5 significant GO-BP collected from Enrichr librariesTable 3 Top 5 significant GO-MF collected from Enrichr librariesTable 4 Top 5 significant GO-CC collected from Enrichr librariesFig. 4
Venn plot showing hub DEGs (FBL, NOP14, UTP6, UTP4, UTP3, BMS1, NOP2, WDR43, and EBNA1BP2) identified from the intersection between top 5 significant pathways, top 5 significant GO-BP term, top 5 significant GO-CC term, and top 5 significant GO-MF term genesets
MODS -specific three-node FFL construction and analysisThe MODS-specific miRNA-mediated FFL network, depicted in Fig. 5A, consists of \(325\) nodes and \(784\) edges, encompassing TF-mRNA, miRNA-mRNA, and miRNA-TF interaction pairs. These pairs account for \(17\), \(421\), and \(346\) edges, respectively. Within the FFL, \(317\) nodes are classified as mRNAs, \(322\) as miRNAs, and \(11\) as TFs. The node degree range of TFs, miRNAs, and mRNAs varied from \(19\) to \(202\), \(2\) to \(5\), \(3\) to \(166\). Average degrees of miRNAs, TFs, and mRNAs were \(2.44\), \(121\), \(54.75\). Table 5 highlights the top three miRNAs, mRNAs, and TFs within the network, ranked by their degree, betweenness, and closeness centrality. Notably, the highest-order subnetwork motif, as shown in Fig. 5B, includes one TF (ZNF749), one miRNA (miR-6726-5p), and one mRNA (BMS1), signifying their central regulatory roles.
Fig. 5
A Undirected and unweighted MODS-specific 3-node miRNA-FFL, consisting of 325 nodes and 784 edges. B Highest-order subnetwork motif, featuring one TF (ZNF749), one miRNA (miR-6726-5p), and one mRNA (BMS1). Circular red nodes represent hub mRNAs, rectangular green nodes denote miRNAs, and triangular blue nodes indicate TFs
Table 5 Top 3 elements ranked based on centrality measures such as degree, betweenness, and closeness
Comments (0)