
Remember me
Lung cancer remains a major global health issue and is a leading cause of cancer-related deaths worldwide.[1] Non-small cell lung cancer (NSCLC) accounts for a considerable proportion of these cases. The identification of mutations in epidermal growth factor receptor (EGFR) has revolutionized targeted treatment strategies for NSCLC.[2,3] Nevertheless, certain patients with rare EGFR mutations face distinct challenges in regard to clinical management and treatment strategies.[4,5]
Recent advancements in immunotherapy and the comprehension of immune checkpoint pathways have substantially improved the treatment of NSCLC, including cases with rare EGFR mutations.[6,7] The programmed cell death protein 1 (PD-1) and programmed death-ligand 1 (PD-L1) axis, which is a crucial component of tumor immune evasion, has become a major focus as a therapeutic target for various cancers, including NSCLC.[8,9] This interaction enables tumors to avoid immune detection and affects disease prognosis and treatment outcomes.[10] The roles of PD-1 and PD-L1 expressions in NSCLC with rare EGFR mutations are increasingly recognized and under active research.[11,12]
The research on the expressions of PD-1 and PD-L1 in NSCLC patients with infrequent EGFR mutations is scarce. This study sought to elucidate the prognostic and predictive roles of PD-1 and PD-L1 in this patient group and fill an important gap in the current knowledge. This research offers the clinical relevance of PD-1/PD-L1 in NSCLC cases with rare EGFR mutations. Through the correlation of PD-1 and PD-L1 expressions with survival outcomes in this unique molecular group, the study aimed to enhance the understanding of immunotherapy and immune checkpoint mechanisms, which will potentially lead to targeted and effective treatment strategies. Providing information on the rarity of EGFR mutations will increase the study’s significance by highlighting the unique challenges in the management of NSCLC patients. This context underscores the importance of the evaluation of PD-1 and PD-L1 as actionable biomarkers, which ultimately contribute to the targeted treatment strategies and improved patient outcomes. This research adds to the advancements in precision medicine through the evaluation of PD-1 and PD-L1 as actionable biomarkers for guided treatment and improved prognostic assessments and highlights their potential influence on clinical practice and patient care.
MATERIAL AND METHODS Study populationThis study received approval from the Institutional Review Board and Ethics Committee. Informed consent has been obtained from all participants involved in the study. We conducted a retrospective cohort research, including NSCLC patients treated at our hospital from January 2018 to December 2018. The patients were divided into two groups based on PD-L1 expression: PD-L1 negative (PLN, n = 95) and PD-L1 positive (PLP, n = 26). In addition, they were categorized based on the PD-1 expression into PD-1-negative (PN, n = 93) and PD-1-positive (PP, n = 25) groups.
Inclusion and exclusion criteria Inclusion criteriaPatients must meet the following diagnostic criteria for NSCLC:[13-15] Confirmed rare EGFR mutations through genetic sequencing, a pathological grade negative (PN, l from January 2018 to December 2018. The patients were divided into two groups based on PD-L1 expression: PD-L1 negative and PD-L1 positive.
Exclusion criteriaPatients were excluded if they had lung malignancies other than NSCLC, such as small-cell lung cancer or lung sarcoma, EGFR-sensitive mutations, lacked complete tumor tissue preservation, had multiple systemic diseases, or suffered from severe impairments in cardiovascular, hepatic, renal, coagulation, immune systems, or other major systems.
Detection methodsAll specimens were fixed with 10% neutral formalin (Shanghai Yi En Chemical Technology Co., LTD), routinely embedded in paraffin, and serially sliced to a thickness of 4 mm per slice and then affixed to polylysine-coated slides. Tissue sections were deparaffinized and rehydrated in accordance with standard immunohistochemistry procedures. Hematoxylin and eosin (H&E) staining and immunohistochemical (IHC) staining were performed using a triocular biological microscope (Model: DM2500, Manufacturer: Leica Microsystems [Shanghai] Co., LTD., Shanghai, China) evaluation. The PD-1 (Clone number 2E5, specification 2 mL, item number GT228102) antibody (dilution 1:50) was obtained from SIGMA, and PD-L1 (clone SP263) (M3653, DAKO, Singapore) was detected using the Roche OptiView method, with positive and negative controls included in each experiment. The remaining IHC reagents were purchased from Maixin, and EnVision two-step staining was utilized. In-situ hybridization for Epstein–Barr (EBER) (Guangzhou Ambiping, Guangzhou, China) was attained utilizing a kit from Zhongshan Jinqiao, with the use of the streptavidinperoxidase system and 3,3ʹ-diaminobenzidine chromogen. In addition, 4 mm-thick paraffin-embedded tissue sections (5– 10 slices) underwent DNA/RNA (230911C03X, Xiamen Aide Biology, Xiamen, China) co-extraction using a kit, followed by amplification refractory mutation system polymerase chain reaction (PCR) to detect gene mutations. The PCR protocols and result interpretations were determined in accordance with the manufacturer’s instructions using the kit obtained from Adicon Biotechnologies.
Positive assessment of PD-L1: The percentages of tumor cells with cytoplasmic or membranous staining of any intensity were calculated, with 0–1% considered negative and ≥1% considered positive; 1–49% were categorized as low expression and ≥50% as high expression. The selection of the 1% cut-off for PD-L1 positivity was based on its biological role in tumor immune evasion through the interaction with PD-1 and supported by the results of clinical trials demonstrating improved responses to PD-1/PD-L1 inhibitors in tumors with at least 1% PD-L1 expression. This threshold provides a standardized measure across laboratories, which ensures consistent patient selection for immunotherapy while balancing sensitivity and specificity. Regulatory bodies, such as the Food and Drug Administration, endorse this criterion, which underscores its predictive value in guiding treatment decisions and optimizing patient outcomes in cancer therapy.
Positive assessment of PD-1: Evaluation through the cell counting method involved the random selection of five high-power fields (×400) on each stained slide, with 100 cells counted in each field to determine the average count of PP cells. The threshold for PD-1 positivity was set as the mean count of positive cells in all cases, with values above and below this threshold considered positive and negative, respectively.
Detection indicatorsPatient general information, such as age, sex, body mass index (BMI), pathological type, pathological grading, and stage, were systematically retrieved for the cases. Follow-up was conducted to record the 5-year progression-free survival (PFS) and overall survival (OS) of all patients. Follow-up activities comprised telephone interviews, outpatient examinations, and written correspondence, with a focus on treatment efficacy, adverse reactions, and survival status. The follow-up period was extended until December 2023.
Statistical methodsIn G✶Power 3.1.9.7 (Heinrich-Heine-University, Düsseldorf, Germany), we conducted a power analysis for a two-independent-sample mean difference test (i.e., independent t-test). We set the effect size (Cohen’s d) to 0.6, which represents a medium effect, and the significance level (a) to 0.05, commonly used in hypothesis testing. The desired power was set to 0.853, indicating an 85.3% probability of detecting a true effect if it exists. After inputting these parameters, G✶Power calculated the required sample size to achieve this level of power. The results suggested that our study design has sufficient power to detect a mean difference, assuming the effect size and significance level we specified. This indicates that our sample size is adequate to avoid Type II errors and should reliably detect the expected difference between groups. Data analysis was conducted using the Statistical Package for the Social Sciences (SPSS) version 29.0 (SPSS Inc., Chicago, IL, USA). Categorical variables were summarized as counts and percentages (n[%]) and examined using Chi-square test. The normality of continuous variables was assessed through the Shapiro-Wilk test. Normally distributed data were reported as mean ± standard deviation and analyzed using t-test, and non-normally distributed data were expressed as median (25th percentile, 75th percentile) and analyzed through the Wilcoxon rank-sum test. A two-sided P < 0.05 was considered statistically significant. Pearson correlation was applied to continuous variables.
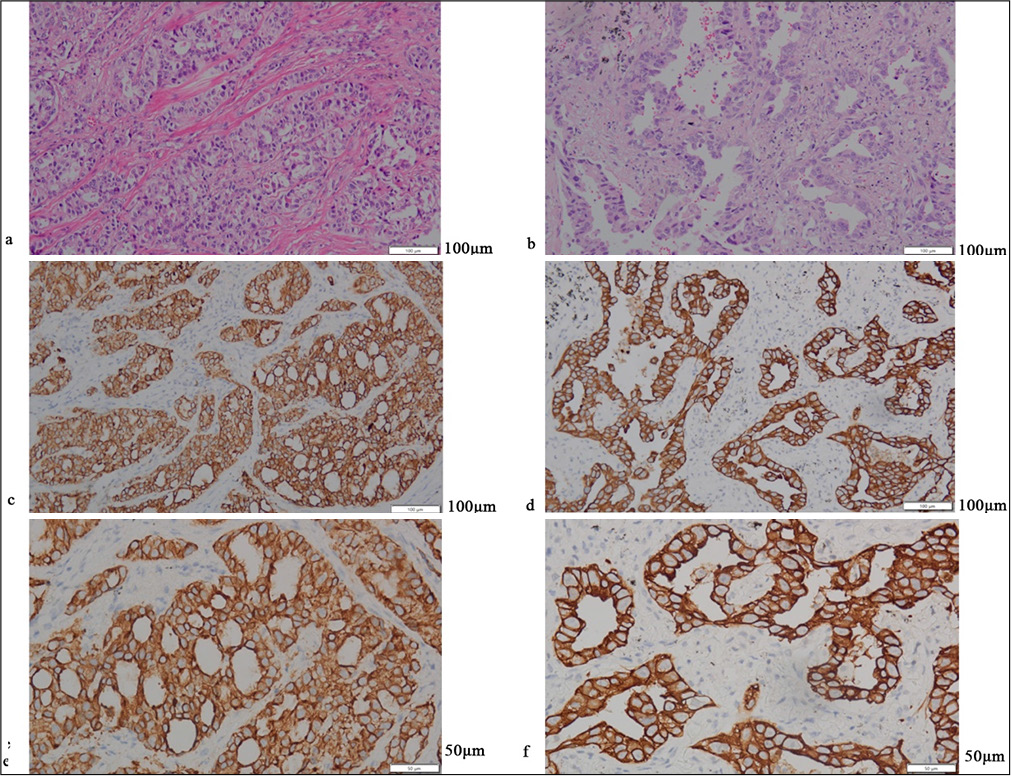
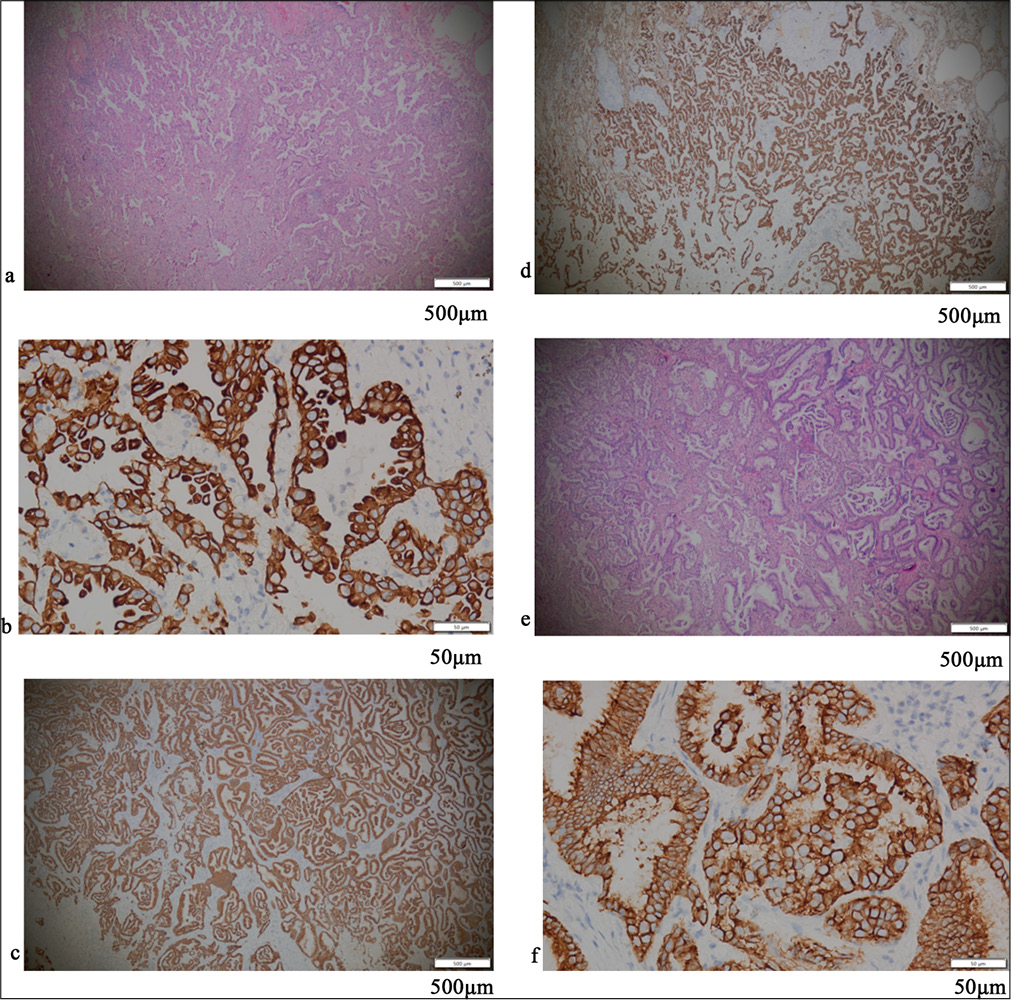
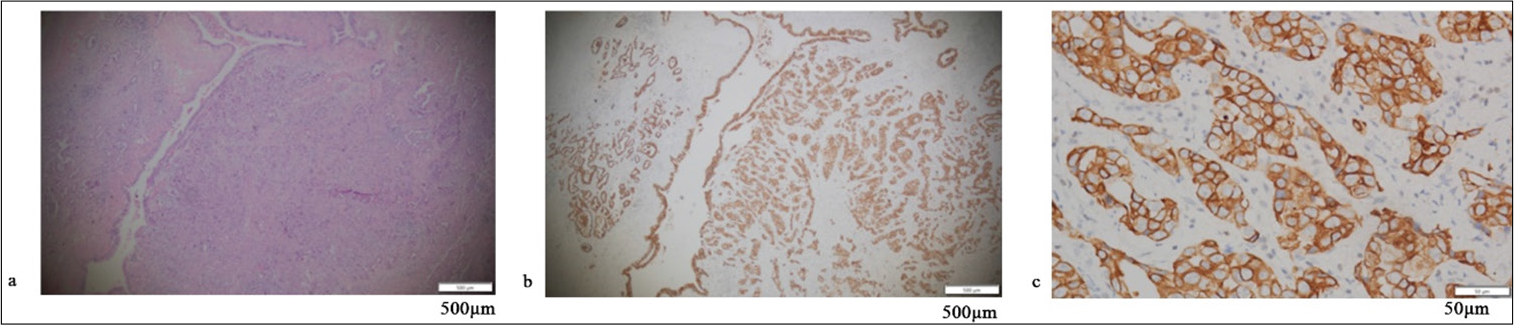
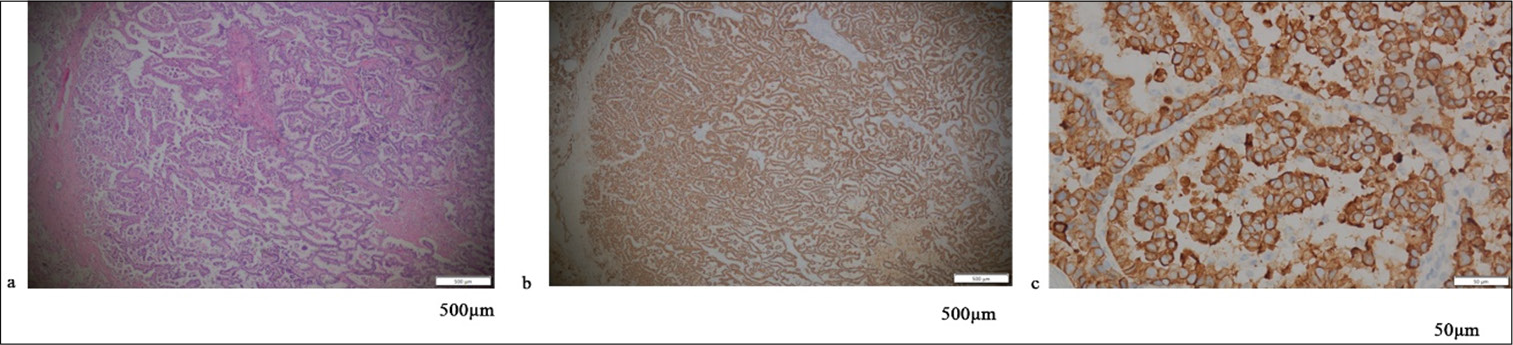
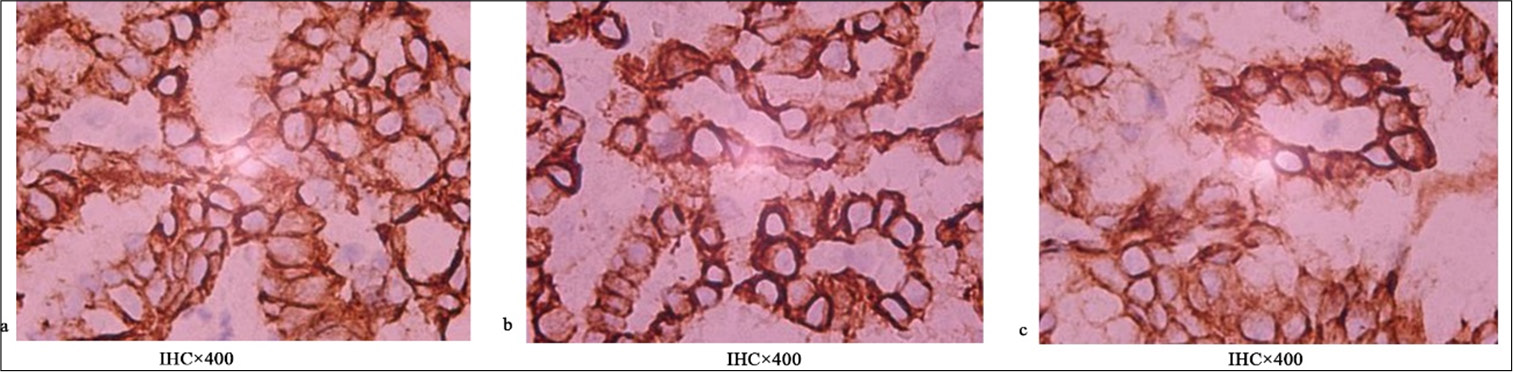
RESULTS Positive assessment of PD-L1 and PD-1Figures 1-5 display the results of evaluations for PD-L1 and PD-1 positivity in lung cancer cases with rare EGFR mutations, with each figure corresponding to a specific patient case. These figures collectively offer a comprehensive overview of the IHC analysis conducted on the tissue samples. The IHC assays revealed varying expressions of PD-L1 and PD-1 in the examined lung tissues. The figures illustrate the application of different staining techniques, with Figure 1 through 5 featuring H&E staining at ×5 magnification to provide an overview of tissue structure. In addition, IHC staining was used to highlight the expression of PD-L1 and PD-1, with images shown at both ×5 and ×10 magnifications for a more detailed view of protein distribution within the cells. Upon closer inspection, distinct patterns of PD-L1 and PD-1 expression were observed. In some instances, PD-L1 expression was negative, indicating the absence of this protein, while PD-1 expression was positive, suggesting its active role within the tumor microenvironment. In other cases, positive PDL1 expression was seen, potentially correlating with a more aggressive tumor phenotype. These variations in biomarker expression provide valuable insights into the tumors’ biological characteristics and their potential for responding to immunotherapy. Moreover, the high-magnification IHC images revealed intricate distribution patterns of PD-L1 and PD-1 within the cellular structures, suggesting potential alterations in signaling pathways or immune evasion mechanisms. These findings may provide further understanding of the functional changes occurring in the tumor cells.
Export to PPT
Export to PPT
Export to PPT
Export to PPT
Export to PPT
General characteristics and demographic features of the PLN and PLP groupsThe retrospective cohort study involved the analysis of the demographic and clinical characteristics of patients with rare mutations of the EGFR gene in relation to PD-L1 expression [Table 1]. The analysis included 121 patients, with 95 (78.51%) classified as PLN and 26 (21.49%) as PLP. The distribution of age groups (<65 and ≥65 years) showed no statistically significant differences between the PLN and PLP groups (x2 = 0.744; P = 0.785). Similarly, gender distribution (male/female) did not demonstrate a significant association with PD-L1 expression (x2 = 0.588; P = 0.443). No significant difference was observed in the BMI between the PLN (22.38 ± 2.14 kg/m2) and PLP (22.86 ± 1.92 kg/m2) groups (t = 1.035; P = 0.303). In terms of comorbidities, such as hypertension and diabetes, the two groups showed no significant differences (P > 0.05). Furthermore, the distribution of pathological type (adenocarcinoma and squamous carcinoma), pathological grading (1/2 and 3), and cancer stage (I/II and III/IV) showed statistically significant association with PD-L1 expression. In addition, no significant association was found between PD-1 positivity and PD-L1 expression (x2 = 0.184; P = 0.668).
Table 1: General characteristics and demographic features of the PLN and PLP group.
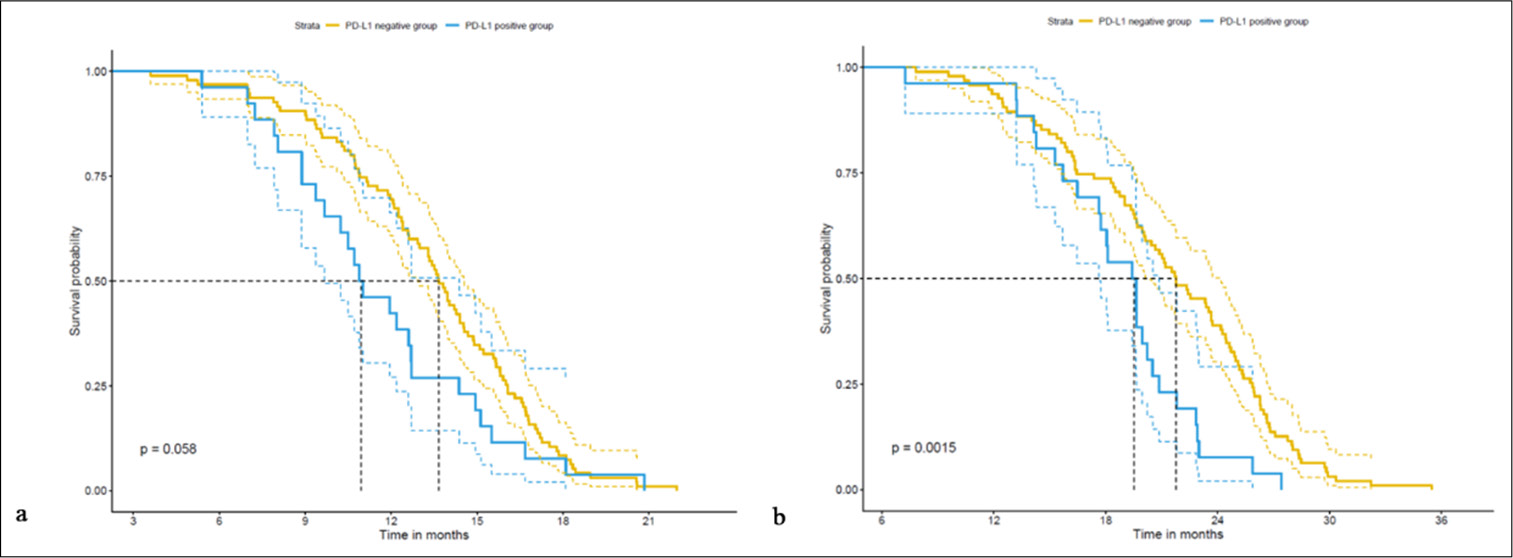
Parameter PLN group (n=95) (%) PLP group (n=26) (%) t/x2 P-value Age (years) 0.744 0.785 <65 54 (56.84) 14 (53.85) ≥4 41 (43.16) 12 (46.15) Gender (M/F) 0.588 0.443 Male 66 (69.47) 16 (61.54) Female 29 (30.53) 10 (38.46) BMI (kg/m2) 22.38±2.14 22.86±1.92 1.035 0.303 Smoking history 27 (28.42) 6 (23.08) 0.294 0.588 Drinking history 14 (14.74) 5 (19.23) 0.311 0.577 Comorbidities (%) Hypertension 8 (8.42) 3 (11.54) 0.240 0.624 Diabetes 17 (17.89) 4 (15.38) 0.090 0.765 Pathological type 0.184 0.668 Adenocarcinoma 85 (89.47) 24 (92.31) Squamous carcinoma 10 (10.53) 2 (7.69) Pathological grading 0.319 0.572 1/2 57 (60.00) 14 (53.85) 3 38 (40.00) 12 (46.15) Stage 0.3318 0.572 I.5 24 (25.26) 8 (30.77) III( 71 (74.74) 18 (69.23) PD1 positive 52 (54.74) 13 (50.00) 0.184 0.668 Five-year survival analysis of the PLN and PLP groupsThe PFS was significantly longer in the PLN group (13.47 ± 3.58 months) compared with the PLP group (11.67 ± 3.67 months) (t = 2.222, P = 0.032) [Table 2]. Similarly, the PLN group achieved a notably prolonged OS (21.39 ± 5.69 months) compared with the PLP group (18.65 ± 4.32 months) (t = 2.664, P = 0.010), which demonstrates a statistically significant difference between the two groups. These findings are indicative of the potential clinical importance of PD-L1 expression in patients with rare mutations of the EGFR gene, which suggests its association with survival outcomes.
Table 2: Five-year survival analysis of EGFR rare-mutation patients with PD-L1 expression.
Parameter PLN group (n=95) PLP group (n=26) T P-value PFS 13.47±3.58 11.67±3.67 2.222 0.032 OS 21.39±5.69 18.65±4.32 2.664 0.010 Correlation analysis of PD-L1 expression and 5-year survival period of patients with EGFR rare mutationsThe retrospective cohort study of patients with rare mutations of the EGFR gene involved a correlation analysis to assess the relationship between PD-L1 expression and the 5-year survival period [Table 3]. The results reveal a significant negative correlation between PD-L1 expression and PFS (r = −0.202, R2 = 0.041, P = 0.026) and OS (r = −0.204, R2 = 0.042, P = 0.024). These findings suggest a potential association between PD-L1 expression and a short 5-year survival period in patients with rare mutations of the EGFR gene, which highlights the potential clinical significance of PD-L1 as a prognostic factor in this patient population.
Table 3: Correlation analysis of PD-L1 expression and 5-year survival period of patients with EGFR rare mutations.
Parameter r R2 P-value PFS −0.202 0.041 0.026 OS −0.204 0.042 0.024 General characteristics and demographic features of the PN and PP groupsThe retrospective cohort study of patients with rare mutations of the EGFR gene included a comparison of the general characteristics and demographic features of individuals in PN and PP groups [Table 4]. The analysis revealed no statistically significant differences in the age distribution (<65 and ≥65 years) between the PN and PP groups (t = 1.239, P = 0.266). Gender distribution (male/female) also demonstrated no significant association with PD-1 expression (c2 = 0.031, P = 0.861). Similarly, no significant differences were observed in the BMI, smoking history, drinking history, and the presence of comorbidities, such as hypertension and diabetes, of the two groups (P > 0.05). However, the distribution of pathological type (adenocarcinoma and squamous carcinoma) displayed borderline significance (c2 = 3.230, P = 0.072), which suggests a potential trend warranting further investigation. In addition, no significant association was found between PD-1 expression and pathological grading (1/2 and 3) or cancer stage (I/II and III/IV).
Table 4: General characteristics and demographic features of the PN and PP groups.
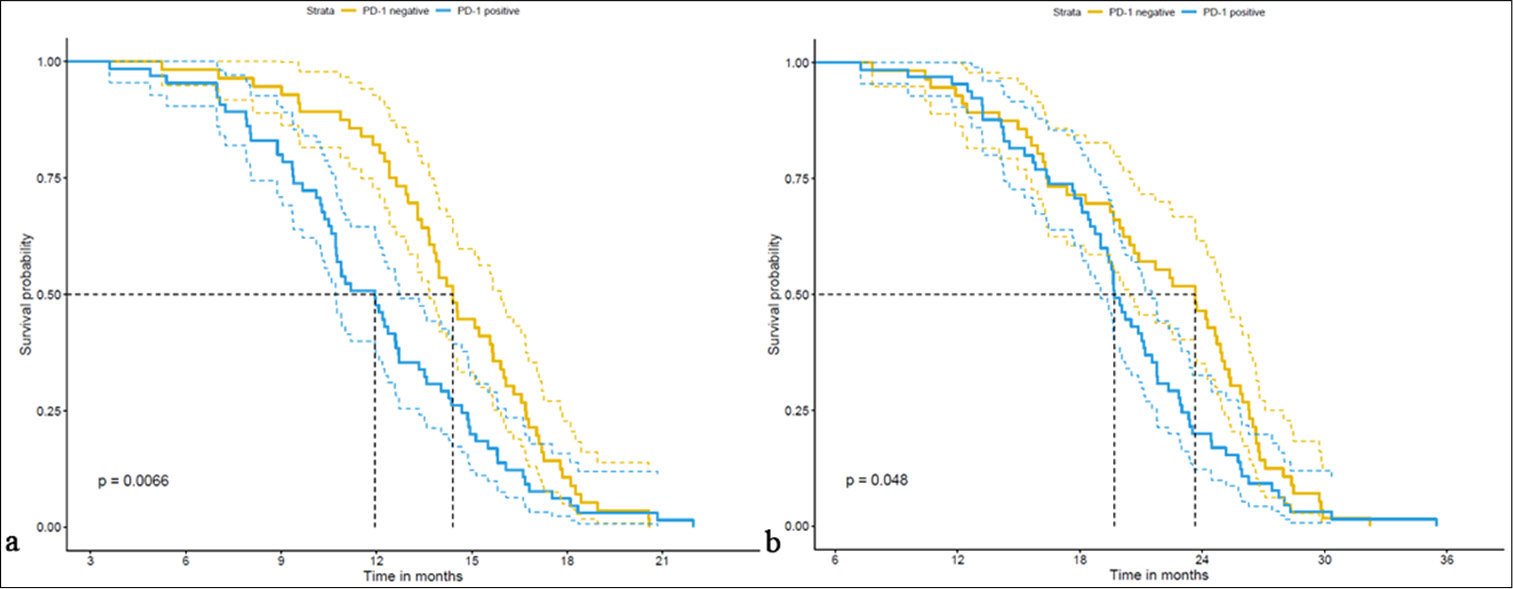
Parameter PN group (n=56) (%) PP group (n=65) (%) t/w/x2 P-value Age (years) 1.239 0.266 <65 35 (62.5) 33 (50.77) ≥65 21 (37.5) 32 (49.23) Gender (M/F) 0.031 0.861 Male 37 (66.07) 45 (69.23) Female 19 (33.93) 20 (30.77) BMI (kg/m2) 1.599 0.252 Smoking history 14 (25.00) 19 (29.23) 0.100 0.752 Drinking history 6 (10.71) 13 (20.00) 1.321 0.250 Comorbidities (%) Hypertension 5 (8.93) 6 (9.23) 0.000 1.000 Diabetes 11 (19.64) 10 (15.38) 0.141 0.707 Pathological type 3.230 0.072 Adenocarcinoma 47 (83.93) 62 (95.38) Squamous carcinoma 9 (16.07) 3 (4.62) Pathological grading 0.000 1.000 ½ 33 (58.93) 38 (58.46) 3 23 (41.07) 27 (41.54) Stage 0.912 0.340 I.3 12 (21.43) 20 (30.77) III.30 44 (78.57) 45 (69.23) Five-year survival analysis of the PN and PP groupsThe PFS was notably longer in the PN group (14.36 ± 3.18 months) compared with the PP group (11.98 ± 3.72 months), with a statistically significant difference (t = 3.796, P < 0.001) [Table 5 and Figure 6]. Moreover, the OS was longer in the PN group (21.71 ± 5.82 months) than in the PP group (20.01 ± 5.18 months), although the difference was marginally significant (t = 2213.5, P = 0.041). These findings underscore the potential clinical significance of PD-1 expression in patients with rare mutations of the EGFR gene, emphasize its association with survival outcomes, and thus warrant further investigation on its prognostic implications [Figure 7].
Export to PPT
Export to PPT
Table 5: Five-year survival analysis of the PN and PP groups.
Parameter PN group (n=56) PP group (n=65) t/w P-value PFS 14.36±3.18 11.98±3.72 3.796 <0.001 OS 21.71±5.82 20.01±5.18 2213.5 0.041The retrospective cohort study of patients with rare mutations of the EGFR gene revealed significant correlations, which were obtained through the correlation analysis of PD-1 expression with the 5-year survival period. The retrospective cohort study of patients examined the correlation between PD-1 expression and PFS and OS [Table 6]. The results reveal a significant negative correlation between PD-1 expression and PFS (r = −0.325, R2 = 0.106, P < 0.001). Similarly, a negative correlation was observed between PD-1 expression and OS, though it did not reach statistical significance (r = −0.154, R2= 0.024, P = 0.091). These findings suggest a potential association between PD-1 expression and shorter PFS, with a weaker, non-significant trend toward a shorter OS. These findings underscore the potential clinical relevance of PD-1 expression in patients with rare mutations of the EGFR gene, which suggests its association with poor PFS outcomes.
Table 6: Correlation analysis of PD-1 expression and 5-year survival period of patients with EGFR rare mutations.
Parameter r R2 P-value PFS −0.325 0.106 <0.001 OS −0.154 0.024 0.091 DISCUSSIONThis study revealed significant correlations between PD-1 and PD-L1 expressions and survival outcomes in patients with rare EGFR gene mutations, which offer important insights into the clinical relevance of immune checkpoint pathways for this specific group. The negative correlation observed between PD-L1 expression and PFS and OS is consistent with the findings of previous research on NSCLC,[16-18] which implies that PD-L1 can serve as a useful prognostic marker in patients with rare EGFR mutations. These results highlight PD-L1’s potential as a biomarker for guided treatment decisions and improved prognostic assessments of this population. In addition, the significant negative correlation between PD-1 expression and shorter PFS indicates PD-1’s potential influence on clinical outcomes in the context of rare EGFR mutations. This finding supports the growing recognition of PD-1’s role in NSCLC and other cancers,[19,20] which underlines its influence on survival outcomes. Further research on the mechanistic role of PD-1 and PD-L1 expressions in tumors with rare EGFR mutations is needed to further comprehend their influence on the tumor immune microenvironment, tumor behavior, and treatment responses.
Moreover, this work explored the link between PD-1 expression and survival outcomes in patients with rare EGFR gene mutations. Several biological mechanisms explaining the correlation between PD-1 and PD-L1 expression and survival in patients with rare EGFR mutations were considered. Tumor cells may evade immune detection by upregulating PD-L1, which allows them to survive longer. Furthermore, a high PD-1/PD-L1 expression may alter the tumor microenvironment, which reduces lymphocyte infiltration, increases immune suppression, and results in enhanced treatment resistance. In addition, the activation of the PD-1/PD-L1 pathway may influence crucial growth signaling pathways, and rare EGFR mutations can lead to genomic instability, which results in varied PD-1 and PD-L1 expression patterns that affect treatment response. The results reveal a significant association between PD-1 expression and short PFS, which suggests that PD-1 may also have a prognostic value for this group. This finding aligns with that of existing research highlighting PD-1’s role in NSCLC and other cancers,[16-18] which underscores its potential effect on clinical outcomes. The connection between PD-1 and survival outcomes further highlights the importance of immune checkpoint inhibitors targeting the PD-1/PD-L1 pathway in the management of patients with rare EGFR mutations. Various underlying factors and biological processes explain the relationship between PD-1 and PD-L1 expression and survival outcomes in NSCLC with rare EGFR mutations. The tumor immune microenvironment considerably influences tumor behavior and treatment response.[19,20] A high PD-L1 expression may enable tumors to evade immune surveillance through the PD-1/PD-L1 pathway, which facilitates immune escape and tumor progression.[21] This interaction affects tumor behavior and therapy response,[22] with increased PD-1 and PD-L1 levels potentially leading to immune escape through the inhibition of T-cell activation and promotion of tumor evasion, which affects survival outcomes.[23] PD-1 and PD-L1 expressions can influence responses to immunotherapy, particularly the inhibitors targeting the PD-1/PD-L1 axis.[21] The elevated expression of PD-L1 is linked to the reduced efficacy of EGFR-targeted therapies and poor survival outcomes,[24] and PD-1 expression may influence immunotherapy effectiveness, which results in shorter PFS and OS of patients with rare EGFR mutations.[25] Moreover, the expressions of PD-1 and PD-L1 in NSCLC with rare EGFR mutations may be related to specific tumor molecular and genetic features.[26] The complex interaction between EGFR mutations and immune checkpoint regulation can affect tumor behavior and treatment response, which influence survival outcomes.[27]
The clinical relevance of PD-1 and PD-L1 expression reflects the principles of precision medicine, where treatments are customized based on individual patient factors, such as molecular and immune profiles.[27] The utilization of PD-1 and PD-L1 expressions as actionable biomarkers supports the application of precision medicine in NSCLC with rare EGFR mutations and promotes a targeted and effective patient care strategy.[26]
However, several limitations of the study have been observed. The retrospective nature of the cohort introduced potential biases and confounding variables that may affect the results. Specifically, these biases can skew the findings by influencing data collection and interpretation. The sample size, particularly of the PLP group, possibly limited the statistical robustness of the conclusions. Furthermore, the emphasis on a specific group with rare EGFR mutations restricts the applicability of results to other NSCLC subtypes. The reliance on retrospective data also raises concerns regarding data completeness and undetected confounding factors. Future research involving larger samples and multicenter approaches should be performed to confirm these findings and better address these limitations. Nonetheless, this study continues to shed light on the development and application of new technologies in the future. The findings of this work suggest that optimization of treatment choices based on PD-L1 and PD-1 expression can aid physicians in assessing patients’ potential responses better to immunotherapy, which leads to personalized treatment plans. In addition, our results provide a foundation for the exploration of new immunotherapeutic strategies targeting specific EGFR mutation types, particularly in PLP patients, where combination therapies may be considered. Moreover, these findings may influence the design of future clinical trials, which will enable a more effective evaluation of treatment outcomes across varying PD-1/PD-L1 expression statuses. Overall, we aim to investigate further the potential influence of our findings on clinical practice and the development of new therapies.
SUMMARYOur retrospective cohort study highlights the potential clinical relevance of PD-1 and PD-L1 expressions in NSCLC patients with rare EGFR mutations. The observed link between PD-1 and PD-L1 expression and survival outcomes emphasizes their prognostic and predictive utility in the development of treatment decisions and enhancement of prognostic evaluation for this patient group. These results contribute to the advancement of personalized medicine in oncology by illustrating how PD-1 and PD-L1 expression can serve as actionable biomarkers to refine treatment strategies and improve patient outcomes.
Comments (0)