Cell lines
HEK293T (ATCC CRL-11268)84 and HEK293F (Thermo Fisher Scientific) and are human embryonic kidney cell lines. HEK293F cells are adapted to grow in suspension. HEK293F cells were cultured at 37 °C with 8% CO2 and shaking at 125 rpm in 293FreeStyle expression medium (Life Technologies). HEK293T cells were cultured at 37 °C with 5% CO2 in flasks with DMEM supplemented with 10% fetal bovine serum (FBS), streptomycin (100 μg/mL) and penicillin (100 U/mL). HEK293T/ACE2 cells85 are a human embryonic kidney cell line expressing human angiotensin-converting enzyme 2. HEK293T/ACE2 cells were cultured at 37 °C with 5% CO2 in flasks with DMEM supplemented with 10% FBS, streptomycin (100 μg/mL) and penicillin (100 U/mL). VeroE6 cells (ATCC CRL-1586) are kidney epithelial cells from African green monkeys. VeroE6 cells were cultured at 37 °C with 5% CO2 in DMEM supplemented with or without streptomycin (100 μg/mL) and penicillin (100 U/mL) and with or without 5 or 10% FBS, and with or without TPCK-trypsin. PBMC were isolated from macaque sera and cultured in RPMI1640 Glutamax+ medium (Gibco) supplemented with 10% FBS.
Viruses
SARS-CoV-2 virus (XBB.3, a BA2.75 subvariant) was isolated by the National Reference Center for Respiratory Viruses (Institut Pasteur, Paris, France) as previously described86 and produced by two passages on Vero E6 cells in DMEM (Dulbecco’s Modified Eagles Medium) without FBS, supplemented with 1% P/S (penicillin at 10,000 U mL-1 and streptomycin at 10,000 μg mL-1) and 1 μg mL-1 TPCK-trypsin at 37 °C in a humidified CO2 incubator and titrated on Vero E6 cells. Whole genome sequencing was performed as described86 with no modifications observed compared with the initial specimen and sequences were deposited after assembly on the GISAID EpiCoV platform under accession number ID EPI_ISL_410720. The SARS-CoV-2 hCoV-19/France/HDF-IPP53307/2022, Omicron, lineage XBB.3 is now available at https://www.european-virus-archive.com under Ref-SKU: 017V-04974.
Ethics and biosafety statement
Cynomolgus macaques (Macaca fascicularis) originating from Mauritian AAALAC-certified breeding centers were used in this study (Supplementary Table 2). All animals were housed in IDMIT infrastructure facilities (CEA, Fontenay-aux-roses), under BSL-2 and BSL-3 containment when necessary (Animal facility authorization #D92-032-02, Préfecture des Hauts de Seine, France) and in compliance with European Directive 2010/63/EU, the French regulations and the Standards for Human Care and Use of Laboratory Animals, of the Office for Laboratory Animal Welfare (OLAW, assurance number #A5826-01, US). The protocols were approved by the institutional ethical committee “Comité d’Ethique en Expérimentation Animale du Commissariat à l’Energie Atomique et aux Energies Alternatives” (CEtEA #44) under statement number A20_061. The study was authorized by the “Research, Innovation, and Education Ministry” under registration number APAFIS#28946-2021011312169043 v2.
Animals and study design
Cynomolgus macaques were randomly assigned to three experimental groups. One Comirnaty vaccinated group (n = 3) received three doses of the Pfizer/BioNTech Comirnaty (30 µg, Comirnaty group) and the second group (n = 3) received two doses of Comirnaty and a third dose of 50 µg of SΔRBD-LVs adjuvanted with 250 µg of MPLA liposomes (Polymun Scientific, Klosterneuburg, Austria) diluted in PBS at weeks 0, 4 and 11, while control animals (n = 4) two received only PBS and two nothing. Vaccinated animals were sampled in blood at weeks -2,0, 2, 4, 6, 11, 13, 15, 19, 21 and 23. At week 24, all animals were exposed to a total dose of 105 pfu of SARS-CoV-2 virus (XBB.3 strain) via the combination of intranasal and intra-tracheal routes (0,25 mL in each nostril and 4,5 mL in the trachea, i.e., a total of 5 mL; day 0), using atropine (0.04 mg/kg) for pre-medication and ketamine (5 mg/kg) with medetomidine (0.042 mg/kg) for anesthesia. Nasopharyngeal and tracheal swabs were collected at days 1, 2, 3, 4, 7, 10, 14, and 29 days past exposure (dpe) while blood was taken at days 2, 4, 7, 10, 14, and 29 dpe. Bronchoalveolar lavages (BAL) were performed using 50 mL sterile saline on 3 dpe. Blood cell counts, hemoglobin, and hematocrit, were determined from EDTA blood using a DHX800 analyzer (Beckman Coulter).
For all handling procedures, animals were anesthetized using ketamine hydrochloride (Imalgen® 1000 5 mg/kg) associated with medetomidine hydrochloride (Domitor® 0.05 mg/kg) by intra-muscular route. Just after the end of the manipulations, atipamezole hydrochloride (Antisedan® 0.05 mg/kg) was administered to induce recovery from anesthesia. Animals were euthanized at day 28 post SARS-CoV-2 exposure by an intravenous overdose of pentobarbital (Dolethal® 180 mg/kg) into the saphenous vein.
Protein expression and purification
The SARS-CoV-2 S gene (Wuhan-Hu-1 Spike) encoding residues 1-331-GSGSGS-530-1208 (RBD residues 332-529 deleted) with proline substitutions at residues K986 P, V987P, F817P, A892P, A899P, A942P (“6P”), a “GSAS” substitution at the furin cleavage site (residues 682-685) a C-terminal T4 fibritin trimerization motif and a linker GSGHHHHHHHHGSGC containing 8xHis-tag4,46 was transiently expressed in FreeStyle293F cells (Thermo Fisher Scientific) using polyethylenimine (PEI) 1 μg/μL for transfection. Supernatants were harvested five days post-transfection, centrifuged for 30 min at 5000 g, and filtered using 0.45 μm filters (ClearLine®). SARS-CoV-2 S protein was purified from the supernatant by Ni2+-Sepharose chromatography (Excel purification resin, Cytiva) in buffer A (50 mM HEPES pH 7.4, 200 mM NaCl) and eluted in buffer B (50 mM HEPES pH 7.4, 200 mM NaCl, 500 mM imidazole). Eluted SARS-CoV-2 S containing fractions were concentrated using Amicon Ultra (cut-off: 30 KDa) (Millipore) and further purified by size-exclusion chromatography (SEC) on a Superose 6 column (GE Healthcare) in buffer A or in PBS. The SARS-CoV-2 S RBD domain (residues 319 to 541) was expressed in EXPI293 cells by transient transfection according to the manufacturer’s protocol (Thermo Fisher Scientific) and as described56. Briefly, supernatants were harvested five days after transfection and cleared by centrifugation. The supernatant was passed through a 0.45 μm filter, and RBD was purified using Ni2+-chromatography (HisTrap HP column, GE Healthcare) in buffer C (20 mM Tris pH 7.5 and 150 mM NaCl buffer) followed by a washing step with buffer D (20 mM Tris pH 7.5 and 150 mM NaCl buffer, 75 mM imidazole) and elution with buffer E (20 mM Tris pH 7.5 and 150 mM NaCl buffer, 500 mM imidazole). Eluted RBD was further purified by SEC on a Superdex 75 column (GE Healthcare) in buffer C. Protein concentrations were determined using an absorption coefficient (A1%,1 cm) at 280 nm of 10.4 and 13.06 for S protein and RBD, respectively, using ProtParam (https://web.expasy.org/).
SARS-CoV-2 SΔRBD crosslinking
SΔRBD protein at 1 mg/mL in PBS was cross-linked with 4% formaldehyde (FA) (Sigma) overnight at room temperature. The reaction was stopped with 1 M Tris HCl pH 7.4 adjusting the sample buffer to 7.5 mM Tris/HCl pH 7.4. FA was removed by PBS buffer exchange using 30 KDa cut-off concentrators (Amicon). FA crosslinking was confirmed by separating SARS-CoV-2 FA- SΔRBD on a 10% SDS-PAGE under reducing conditions.
SΔRBD protein coupling to liposomes
Liposomes for conjugating S protein were prepared as described previously56. Briefly, liposomes were composed of 60% of L-α-phosphatidylcholine, 4% His tag-conjugated lipid, DGS-NTA-(Ni2+), and 36% cholesterol (Avanti Polar Lipids). Lipid components were dissolved in chloroform, mixed, and placed for 2 h in a desiccator under vacuum at room temperature to obtain a lipid film. The film was hydrated in filtered (0.22 µm) PBS, and liposomes were prepared by extrusion using membrane filters with a pore size of 0.1 μm (Whatman Nuclepore Track-Etch membranes). The integrity and size of the liposomes were analyzed by negative staining-EM. For protein coupling, the liposomes were incubated overnight with FA-S or S protein in a 3:1 ratio (w/w). Free FA-S protein was separated from the FA-S-proteoliposomes (SΔRBD-LVs) by sucrose gradient (5-40%) centrifugation with a SW55 rotor at 40,000 rpm for 2 h. The amount of protein conjugated to the liposomes was determined by Bradford assay and SDS-PAGE densitometry analysis comparing SΔRBD-LV bands with standard S protein concentrations.
S protein thermostability
Thermal denaturation of SARS-CoV-2 S ‘6 P’, SΔRBD, and FA-SΔRBD was analyzed by differential scanning fluorimetry (DSF) coupled to back scattering using a Prometheus NT48 instrument (Nanotemper Technologies, Munich, DE). Protein samples were first extensively dialyzed against PBS pH 7.4, and the protein concentration was adjusted to 0.3 mg/mL. 10 μL of the sample were loaded into the capillary, and intrinsic fluorescence was measured at a ramp rate of 1 °C/min with an excitation power of 30%. Protein unfolding was monitored by the changes in fluorescence emission at 350 and 330 nm. The thermal unfolding midpoint (Tm) of the proteins was determined using the Prometheus NT software.
Negative stain electron microscopy
Protein samples were visualized by negative-stain electron microscopy (EM) using 3–4 µL aliquots containing 0.1–0.2 mg/mL of protein. Samples were applied for 10 s onto a mica carbon film and transferred to 400-mesh Cu grids that had been glow discharged at 20 mA for 30 s and then negatively stained with 2% (wt/vol) Uranyl Acetate (UAc) for 30 s. Data were collected on a FEI Tecnai T12 LaB6-EM operating at 120 kV accelerating voltage at 23k magnification (pixel size of 2.8 Å) using a Gatan Orius 1000 CCD Camera. Preliminary 2-D class averaging was performed with Relion87 using 9800 particles, a pixel size of 3.9 Å/pixel, and a box size of 200 pixels.
Cryo-electron microscopyData collection
3.5 µL of SΔRBD sample were applied to 1.2/1.3 C-Flat (Protochips Inc) holey carbon grids or 1.2/1.3 Ultrafoil grids (Quantifoil MicroTools GmbH, Germany) and plunged frozen in liquid ethane with a Vitrobot Mark IV (Thermo Fisher Scientific) (6 s blot time, blot force 0). The sample was observed at the beamline CM01 of the ESRF (Grenoble, France)88 with a Titan Krios G3 (Thermo Fischer Scientific) at 300 kV equipped with an energy filter (Bioquantum LS/967, Gatan Inc, USA) (slit width of 20 eV). Movies were recorded automatically on two different grids with a K3 direct detector (Gatan Inc., USA) with EPU (Thermo Fischer Scientific). A total of 11051 movies were recorded for a total exposure time of 1.6 s with 40 frames per movie and a total dose of ~40 e − /Å2. The magnification was 105,000x (0.84 Å/pixel at the camera level). The defocus of the images varied between −1.0 and −2.5 μm.
3D reconstruction
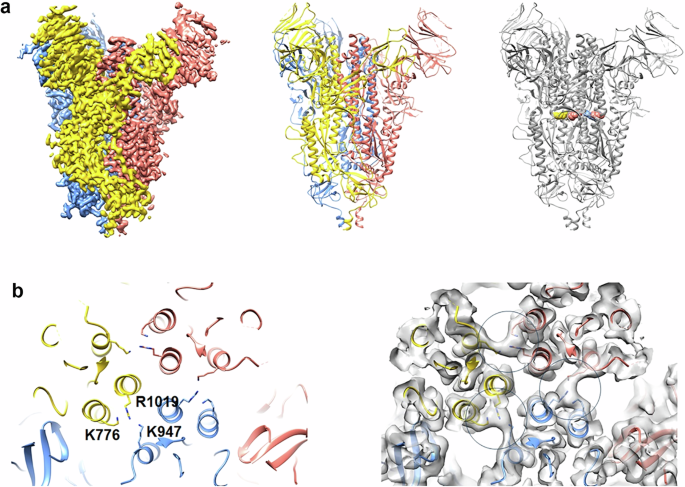
The movies were first drift-corrected with motioncor289. CTF estimation was done with GCTF90. The remaining image processing was performed with RELION 491. An initial set of particles (box size of 86 pixels, sampling of 3 Å/pixel) was obtained by auto-picking. After two rounds of 2D classification, the particles from the best-looking 2D class averages were used to generate an ab-initio 3D map (with C1 symmetry), which was then refined to 6.2 Å imposing C3 symmetry. The 3D map displays the features expected for SΔRBD, and an atomic model of S could un-ambiguously be docked in the map. The particles used to generate that first 3D map were then used to train a picking model and pick all the micrographs with Topaz92. Approximately 1.1 M of particles were extracted, and a first 3D classification (C1 symmetry, 5 classes, and a circular mask diameter of 210 Å) allowed the identification of a subset of 200,114 particles, which were then re-extracted (box size of 400 pixels, sampling of 0.84 Å/pixel). A 3D refinement (C3 symmetry) gave a 3D reconstruction at 4 Å resolution. Refinement of CTF parameters, particle polishing, and a second round of CTF parameter’s refinement further improved the resolution to 3.1 Å. A final 3D classification (C1 symmetry, 3 classes, and a circular mask diameter of 210 Å) allowed the identification of a subset of 87,324 particles which then yielded the final 3D reconstruction at 3.0 Å resolution. The resolution was determined by Fourier Shell Correlation (FSC) at 0.143 between two independent 3D maps. The local resolution was calculated with blocres93 and found to be between 2.8 and 4.4 Å. The final 3D map was sharpened with DeepEMhancer for display purpose94.
Model refinement
The atomic model of the S protein, paraformaldehyde fixed, in the closed conformation (PDB 7Q1Z)56 was rigid-body fitted inside the cryo-EM density map in CHIMERA95. The residues corresponding to the RBD domains were deleted. The atomic coordinates were then refined with Rosetta96 and PHENIX97. The refined atomic models were visually checked and adjusted (if necessary) in COOT98. The final model was validated with MOLPROBITY99. The data collection and atomic model statistics are summarized in Supplementary Table 1.
Virus quantification in NHP samples
Upper respiratory (nasopharyngeal and tracheal) specimens were collected with swabs (Viral Transport Medium, CDC, DSR-052-01). Tracheal swabs were performed by insertion of the swab above the tip of the epiglottis into the upper trachea at approximately 1.5 cm of the epiglottis. All specimens were stored at −80 °C until extraction and analysis. Extraction was done using the NucleoSpin™ Virus Core Kit (Macherey-Nagel, Dueren, Germany) according to the manufacturer’s instructions. Samples were then analyzed by RT-qPCR with a virus standard concentration range containing an RdRp gene fragment, including the RdRp-IP4 RT-PCR target sequence IP4-SARS-CoV-2-R CTG GTC AAG GTT AAT ATA GG, IP4-SARS-CoV-2--F: GGT AAC TGG TAT GAT TTC G and SARS6CoV-2 IP4 probe: FAM-TCA TAC AAA CCA CGC CAG G-BHQ1. SARS-CoV-2 E gene subgenomic mRNA (sgRNA) levels were assessed by RT-qPCR using primers and probes previously described100,101: leader-specific primer sgLeadSARSCoV2-F CGATCTCTTGTAGATCTGTTCTC, E-Sarbeco-R primer ATATTGCA GCAGTACGCACACA and E-Sarbeco probe HEX-ACACTAGCCATCCTTACTGCGCTTCG-BHQ1. The protocol describing this procedure for the detection of SARS-CoV-2 is available on the WHO website (https://www.who.int/docs/default-source/coronaviruse/whoinhouseassays.pdf). RT-qPCR was performed using the SuperScript® III Platinium® One-step Quantitative RT-qPCR System kit (Life Technologies, CA, USA) and C1000 Thermal Cylcer with CF96 optic module (Bio-Rad Laboratores, Diamed GmbH, Switzerland) according to the manufacturer’s instruction. Data were then analyzed using CFX Maestro (v2.2, Bio-Rad).
ELISA
Serum antibody titers specific for soluble WT S glycoprotein, SΔRBD, and for RBD were determined using an enzyme-linked immunosorbent assay (ELISA). Briefly, 96-well microtiter plates (F96 Maxisorp NUNC Immunoplate #442404) were coated with 50 µL at 1 µg/mL of WT S, SΔRBD or RBD proteins at 4 °C overnight in PBS and blocked with 3% BSA for 1 h at room temperature after 3 washes with PBS Tween-20 0.05%. Serum dilutions were added to each well, and plates were washed 5 times with PBS Tween. An alkaline phosphatase-conjugated anti-monkey IgG (Sigma Aldrich, # A1929) was then diluted 1/10,000 and incubated for 1 h, before excess Ab was washed out and PNPP substrate was added (Interchim, # UP 664791). Absorbance was read at 1 h15, at 405 nm. Antibody titers were expressed as ED50 (Effective Dilution 50-values) and were determined as the serum dilution at which IgG binding was reduced by 50%. ED50 was calculated from crude data (O.D) after normalization using GraphPad Prism (version 9) “log(inhibitor) vs normalized response” function.
Pseudovirus neutralization assay
Neutralization activity was tested using a pseudovirus neutralization assay, as previously described84. Shortly, pseudoviruses were produced by co-transfecting the pCR3 SARS-CoV-2-SΔ19 (Wuhan-Hu-1, GenBank MN908947.3 with amino acid substitution D614G) expression plasmid with the pHIV-1NL43 ΔEnv-NanoLuc reporter virus plasmid in HEK293T cells (ATCC, CRL-11268), as previously described85. Cell supernatant containing the pseudovirus was harvested 48 h post transfection and stored at −80 °C until further use. For the neutralization assay itself, HEK293T/ACE2 cells85 were seeded at a density of 20,000 cells/well in a 96-well plate coated with 50 μg/mL poly-L-lysine one day prior to the start of the neutralization assay. Serum was serially diluted in cell culture medium (DMEM (Gibco), supplemented with 10% FBS, penicillin (100 U/mL), streptomycin (100 μg/mL), and GlutaMax (Gibco)), subsequently mixed in a 1:1 ratio with pseudovirus and incubated for 1 h at 37 °C. Next, these mixtures were added to the cells in a 1:1 ratio and incubated for 48 h at 37 °C, followed by cell lysis to measure the luciferase activity in cell lysates using the Nano-Glo Luciferase Assay System (Promega) and GloMax system (Turner BioSystems). Relative luminescence units (RLU) were normalized to the positive control wells where cells were infected with pseudovirus in the absence of serum. The neutralization titers (IC50) were determined as the antibody concentration at which infectivity was inhibited by 50%, respectively, using a non-linear regression curve fit (GraphPad Prism software version 8.3).
RBD-specific antibody serum depletion
3 mg of RBD was coupled to cyanogen-bromide-activated Sepharose TM 4 Fast Flow (Sigma-Aldrich) following the manufacturers’ protocol in order to generate RBD-sepharose affinity columns. 200 µL of serum was successively three times passed over 100 µL RBD-sepharose, washed with 100 µL PBS. The flow through was collected and concentrated after the third passage to 200 µL. Complete RBD depletion was confirmed by ELISA using RBD-coated plates as described above.
Electrochemiluminescence-based neutralization assay
Neutralizing antibody titers were measured using the Meso Scale Discovery MSD V-PLEX SARS-CoV-2 Key Variant Spike Panel 1 ACE2 competition assay kit according to the manufacturer’s instructions. This technique permits to measure the activity of antibodies capable of blocking the binding of ACE2 to its cognate receptor from the Wuhan virus and from (B.1.1.7), (B.1.1.529; BA.1), (B.1.351), (B.1.617.2; AY.4) Alt Seq 2, (BA.2), (BA.2.12.1), (BA.2.75), and (BA.5) variants. Plates were blocked with MSD Blocker A and washed. The assay calibrator (COVID-19 neutralizing antibody; monoclonal antibody against S protein), control sera, and test sera samples diluted 1 in 10 or 1 in 100 in assay diluent were added to the plates. Following a 2 h incubation period, the plates were washed, and MSD SULFO-TAG™ conjugated ACE-2 protein was added. The plates were then read using a MESO® QuickPlex SQ 120MM Reader. The calibration curve was used to calculate neutralizing antibody concentrations in samples by backfitting the measured electrochemiluminescence (ECL) signals to the calibration curve. Data analysis was conducted using the Discovery Workbench software (v4.0 MSD, Rockville, USA), and the results were expressed as units (U)/mL.
Antigen-specific IFNγ producing T cell assays using ELISpot
Monkey IFN-γ ELISpot PRO kit (Mabtech Monkey IFN-γ ELISpot pro, #3421M-2APT) was used following the manufacturer’s instructions. 2 ×10⁵ freshly isolated PBMCs were added to each well. Cells were stimulated using SARS-CoV-2 peptide pools in the culture medium at a final dilution of 2 μg/mL. Before the challenge, 2 pools of 158 and 157 peptides derived from a peptide scan through the Spike glycoprotein of SARS-CoV-2 were used. After the challenge, an additional pool of 102 peptides derived from a peptide scan through Nucleoprotein was used. PMA/ionomycine (62,5 ng/mL and 714,29 ng/mL respectively) was used as positive control and complete RPMI medium (RPMI1640 Glutamax+, Gibco; supplemented with 10% FBS) alone as a negative control. Plates were incubated for 18 h at 37 °C in an atmosphere containing 5% CO2 and then washed 5 times with PBS. Alkaline phosphatase linked anti-IFN-γ antibody was added and the plates were incubated 2 h at 37 °C. Plates were washed 5 times with PBS, and spots were developed by adding 0.45 μm-filtered ready-to-use BCIP/NBT-plus substrate solution. The spots were counted with an Automated IRIS™ FluoroSpot/ELISpot Reader (Mabtech AB, Stockholm, Sweden) at CEA.
Antigen-specific T-cell assays using flow cytometry
To analyze the SARS-CoV-2 protein-specific T cell, 15-mer peptides (n = 157 and n = 158) overlapping by 11 amino acids (aa) and covering the SARS-CoV-2 Spike sequence (aa 1 to 1273) were synthesized by JPT Peptide Technologies (Berlin, Germany) and used at a final concentration of 2 µg/mL.
T-cell responses were characterized by measurement the frequency of CD4 + T cells expressing IL-2 (PerCP5.5, MQ1-17H12, BD), IL-17a (Alexa700, N49-653, BD), IFN-γ (V450, B27, BD), TNF-α (BV605, Mab11, BioLegend), IL-13 (BV711, JES10-5A2, BD), CD137 (APC, 4B4, BD), CD69 (PE-, FN-50, BioLegend) and CD154 (FITC, TRAP1, BD) upon stimulation with the two peptide pools. CD3 (APC-Cy7, SP34-2, BD), CD4 (BV510, L200, BD), and CD8 (PE-Vio770, BW135/80, Miltenyi Biotec) antibodies were used as lineage markers. One million PBMC were cultured in a complete RPMI medium, supplemented with co-stimulatory antibodies (FastImmune CD28/CD49d, Becton Dickinson). The cells were stimulated with S sequence overlapping peptide pools at a final concentration of 2 μg/mL. Brefeldin A was added to each well at a final concentration of 10 µg/mL, and the plate was incubated at 37 °C, 5% CO2 for 18 h. Next, cells were washed, stained with a viability dye (LIVE/DEAD fixable Blue dead cell stain kit, ThermoFisher), and then fixed and permeabilized with the BD Cytofix/Cytoperm reagent. Permeabilized cell samples were stored at −80 °C before the staining procedure. Antibody staining was performed in a single step following permeabilization. After 30 min of incubation at 4 °C, in the dark, cells were washed in BD Perm/Wash buffer and then acquired on the LSRII cytometer (Beckton Dickinson). Analyses were performed with the FlowJo v.10 software. Data are presented a minus background where non-stimulated cells signals was subtracted to each specific signal. No responses were detected with antibodies specific for IL17a, IL13, CD137, and CD154, and hence no data was included in the analyses.
Statistical analysis and figure preparation
Statistical significance between groups was performed using Graphpad Prism (v9.2.0). Statistical analysis of NHP gRNA, sgRNA and Ab production was carried out using Kruskal–Wallis and Mann–Whitney unpaired t-test in GraphPad Prism software (v9.2.0).
Figure 1 and Supplementary Fig. 2 were prepared with CHIMERA and CHIMERAX95,102. Figure 2a was generated with BioRender.

Comments (0)