
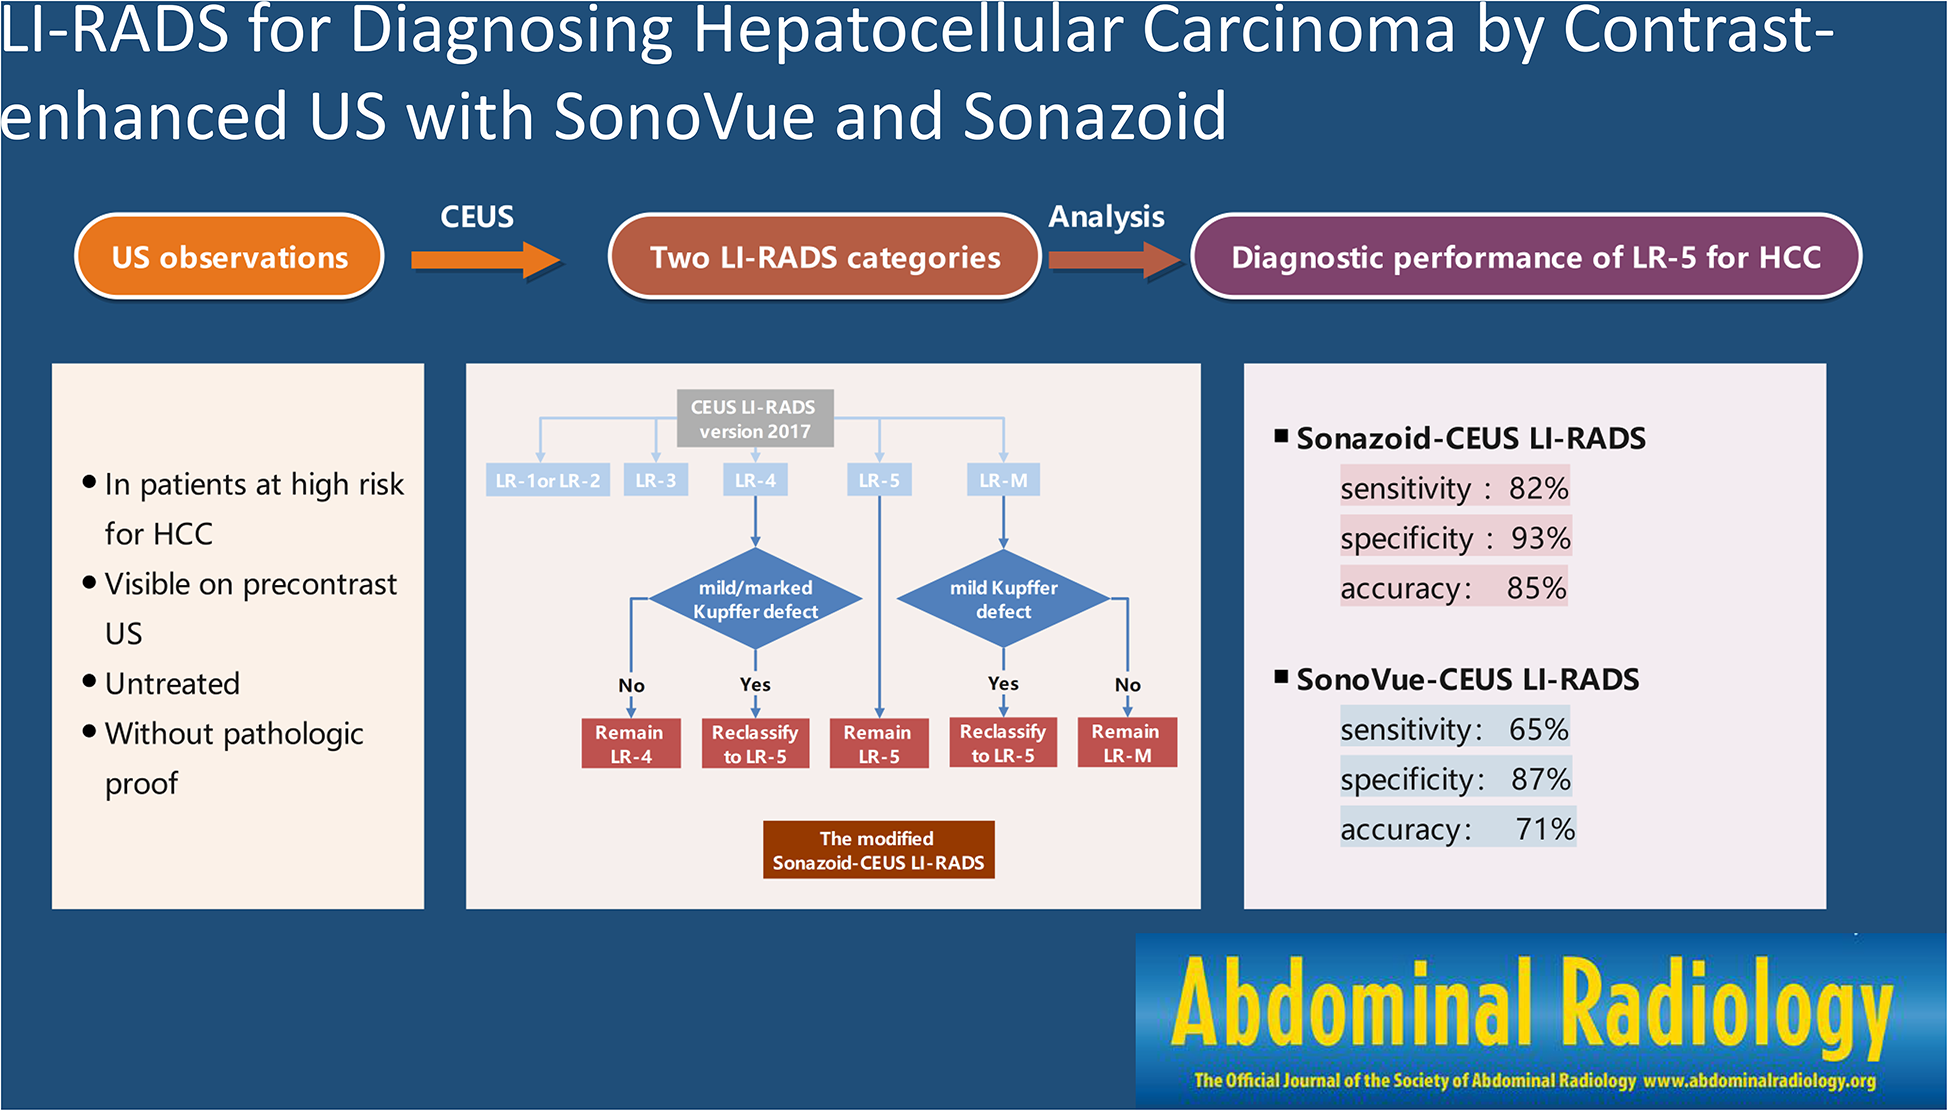
Remember me


Ethical approval was not required from our institution for this in vitro or ex vivo study. In vivo experiments using mice were conducted according to a protocol reviewed and approved by the Institutional Animal Care and Use Committee of our institution (04-107-004).
Modified technique for 1 cm core needle biopsyIn this study, a coaxial system comprising the SuperCore™ semi-automatic biopsy needle (18G, Argon Medical Devices, TX, USA) and an introducer needle was used for all experiments. We selected this biopsy needle because it is the most commonly available at our institution, ensuring feasibility and consistency across experiments. We adjusted the notch length protruding from the tip of the coaxial introducer needle to be consistent (1 cm) by using an adapter and a spacer. The spacer was created by cutting a plastic tube originally provided as a protective cover for the biopsy needle, ensuring that the notch length was identical and stable for both the conventional and modified methods. This setup prevented any unintended shift in the relative position of the introducer and biopsy needles during insertion and firing, maintaining a consistent protrusion length (Fig. 1). The stroke length was set to 2 cm or 1 cm, with the biopsy using a 2 cm stroke length designated as the modified method, and the biopsy using a 1 cm stroke length designated as the conventional method.
Fig. 1
Schematic and photographic representation of the biopsy system used in this study. (a) Illustration of the semi-automatic biopsy needle (18G, SuperCore™) commonly used in percutaneous image-guided procedures. (b) Conventional biopsy method using a 1 cm stroke length, shown with both schematic illustration and actual photograph. (c) Modified biopsy method using a 2 cm stroke length with a coaxial introducer needle, shown with both schematic illustration and actual photograph. The modified method includes the use of an adapter and spacer to maintain a consistent notch length protruding from the coaxial introducer needle
In vitro experimentsAn agarose gel, whose hardness could be adjusted by changing its concentration, was used. Based on reports that the hardness of the liver and brain corresponds to 1% agarose gel, and that of the heart and kidneys to 2% agarose gel, agarose gels with concentrations ranging from 0.5 to 3% were employed [20]. Agarose LE (FUJIFILM Wako Pure Chemical Corporation, Osaka, Japan) was added to 50 mL of Dulbecco's Modified Eagle Medium (DMEM) (FUJIFILM Wako Pure Chemical Corporation, Osaka, Japan) at concentrations of 0.5, 1, 1.5, 2, 2.5, and 3% and mixed thoroughly. The hardness of the agarose gel at each concentration was measured using TexoGraph (JAPAN FOOD R&D INSTITUTE, Osaka, Japan). A load-deformation curve was generated, and the initial slope was analyzed to compare the rigidity. The prepared 0.5–3% agarose gels were subjected to a total of 120 biopsies, with 60 performed using the modified method and 60 using the conventional method. The weight of the tissue obtained per biopsy was measured using an electronic balance (IUW-200D; AS ONE CORPORATION, Osaka, Japan).
Ex vivo experimentsChicken liver, gizzard, breast, and pork loin were utilized as ex vivo models in this study. These tissues were sourced fresh from a local grocery store and used immediately for experimentation. As the organs were derived from commercially available food products rather than live animals, no additional ethical approval was necessary. These tissues were manually stabilized by gently holding them to prevent movement during biopsy, ensuring that excessive pressure was avoided to prevent tissue compression. Each tissue type was subjected to a total of 40 biopsies, with 20 performed using the modified method and 20 using the conventional method. The weight of the tissue obtained per biopsy was measured using an electronic balance.
In vivo experimentsThe murine colorectal carcinoma cell line (CT26) was used in this study. The cells were cultured in Dulbecco’s modified Eagle medium (DMEM, Fujifilm-Wako Pure Chemicals, Osaka, Japan), supplemented with 10% fetal bovine serum (FBS, Nichirei Bioscience Inc., Tokyo, Japan) and antibiotics (Antibiotic–Antimycotic; Cytiva, Tokyo, Japan), at 37 °C and 5% CO2. Eight-week-old female BALB/cCrSIc mice (Japan SLC, Inc., Shizuoka, Japan) were subcutaneously injected with CT26 cells (1 × 10⁶ cells/0.1 mL) on both sides of the lower back. The mice were then kept for a few weeks to allow the tumors to grow to a minimum length of approximately 8 mm. Overall, 18 tumors from nine mice were analyzed. Biopsies were performed without image guidance; the subcutaneous tumors were visually identified and directly punctured. To ensure consistency, the tumors were gently stabilized by hand to prevent movement during the procedure, while avoiding excessive pressure that could potentially affect the sample yield. For each of the 18 tumors, both the modified and conventional methods were alternately used three times each, ensuring direct comparison within the same tumor group. The total weights of the samples collected from the three biopsies were measured using an electronic balance. DNA was extracted and purified from each sample using the standard protocol of the ISOSPIN Tissue DNA kit (NIPPON GENE Co., Ltd., Tokyo, Japan). The extracted DNA was quantified using Thermo Scientific™ NanoDrop™ One C (Thermo Fisher Scientific K.K., Tokyo, Japan), and the average value was calculated after three measurements for each sample.
Measurement of the firing speed of the biopsy needleThe firing of the biopsy needle was recorded using a high-speed camera (VW-9000TM; KEYENCE, Osaka, Japan). The shutter speed was set to 1/16,000 s, and the frame rate was 5996.4 frames per second (fps). Recordings were made for the 1 cm and 2 cm stroke lengths, and the actual firing speeds of the cannulas were compared. Three semi-automatic biopsy needles were used in this experiment: SuperCore ™ (Argon Medical Devices, TX, USA), Mission ™ (BARD, AZ, USA), and AprioCore® plus (AprioMed, Uppsala, Sweden).
Statistical analysisFor each experiment, the mean and standard deviation (SD) of the sample weight and DNA quantity were calculated. The differences in sample weight and DNA quantity and their 95% confidence intervals (CIs) were compared using the Student's t-test. Comparisons of the weights in the in vitro and ex vivo experiments were conducted using an unpaired one-sided t-test. A paired one-sided t-test was performed for the in vivo experiments. Statistical analyses were conducted using R software (version 4.2.0), and statistical significance was set at P < 0.05.
We considered measuring the actual length of the core samples; however, transferring the specimens from the biopsy needle notch led to deformation, making precise length measurement difficult. Therefore, we used sample weight as a more reliable parameter for comparing specimen volume. In in vivo experiments, DNA yield was also assessed, as it is clinically more relevant than sample weight and enhances the accuracy of comparisons.
Comments (0)