
Remember me

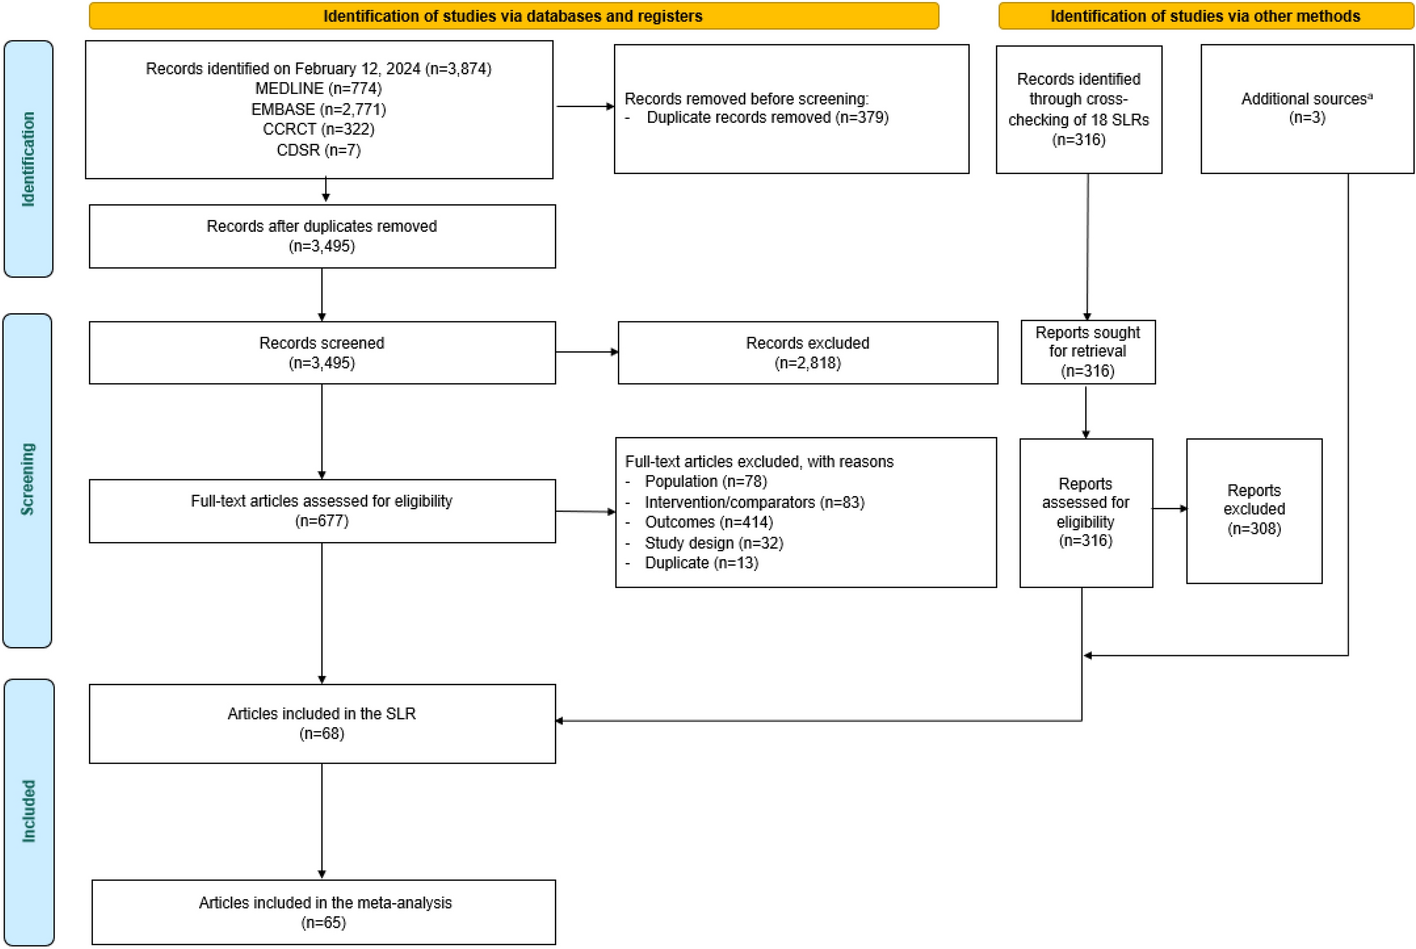


Of 5395 patients identified with NETs who had ≥ 1 claim for SSAs or telotristat, 3740 had GEP-NETs (Fig. 2a) and 546 had lung-NETs (Fig. 2b).
Among the individuals with GEP-NETs, 664 were eligible for study inclusion (Fig. 2a). The final GEP-NETs cohort comprised 662 individuals for whom reference individuals could be matched, 279 had CS, 370 had no CS, and 13 had unconfirmed CS status (Table 1).
Table 1 Demographic data for patients with GEP-NETs and the reference groupsAmong individuals with lung-NETs, 84 were eligible for study inclusion (Fig. 2b), all of whom were matched to 4 reference patients and included in the lung-NETs cohort. Of these patients, 30 had CS, 53 had no CS, and one had unconfirmed CS status (Table 2).
Table 2 Demographic data for patients with lung-NETs and the reference groupsPatients with unconfirmed CS were excluded from the CS subgroup analyses of both NETs cohorts owing to the small number of patients.
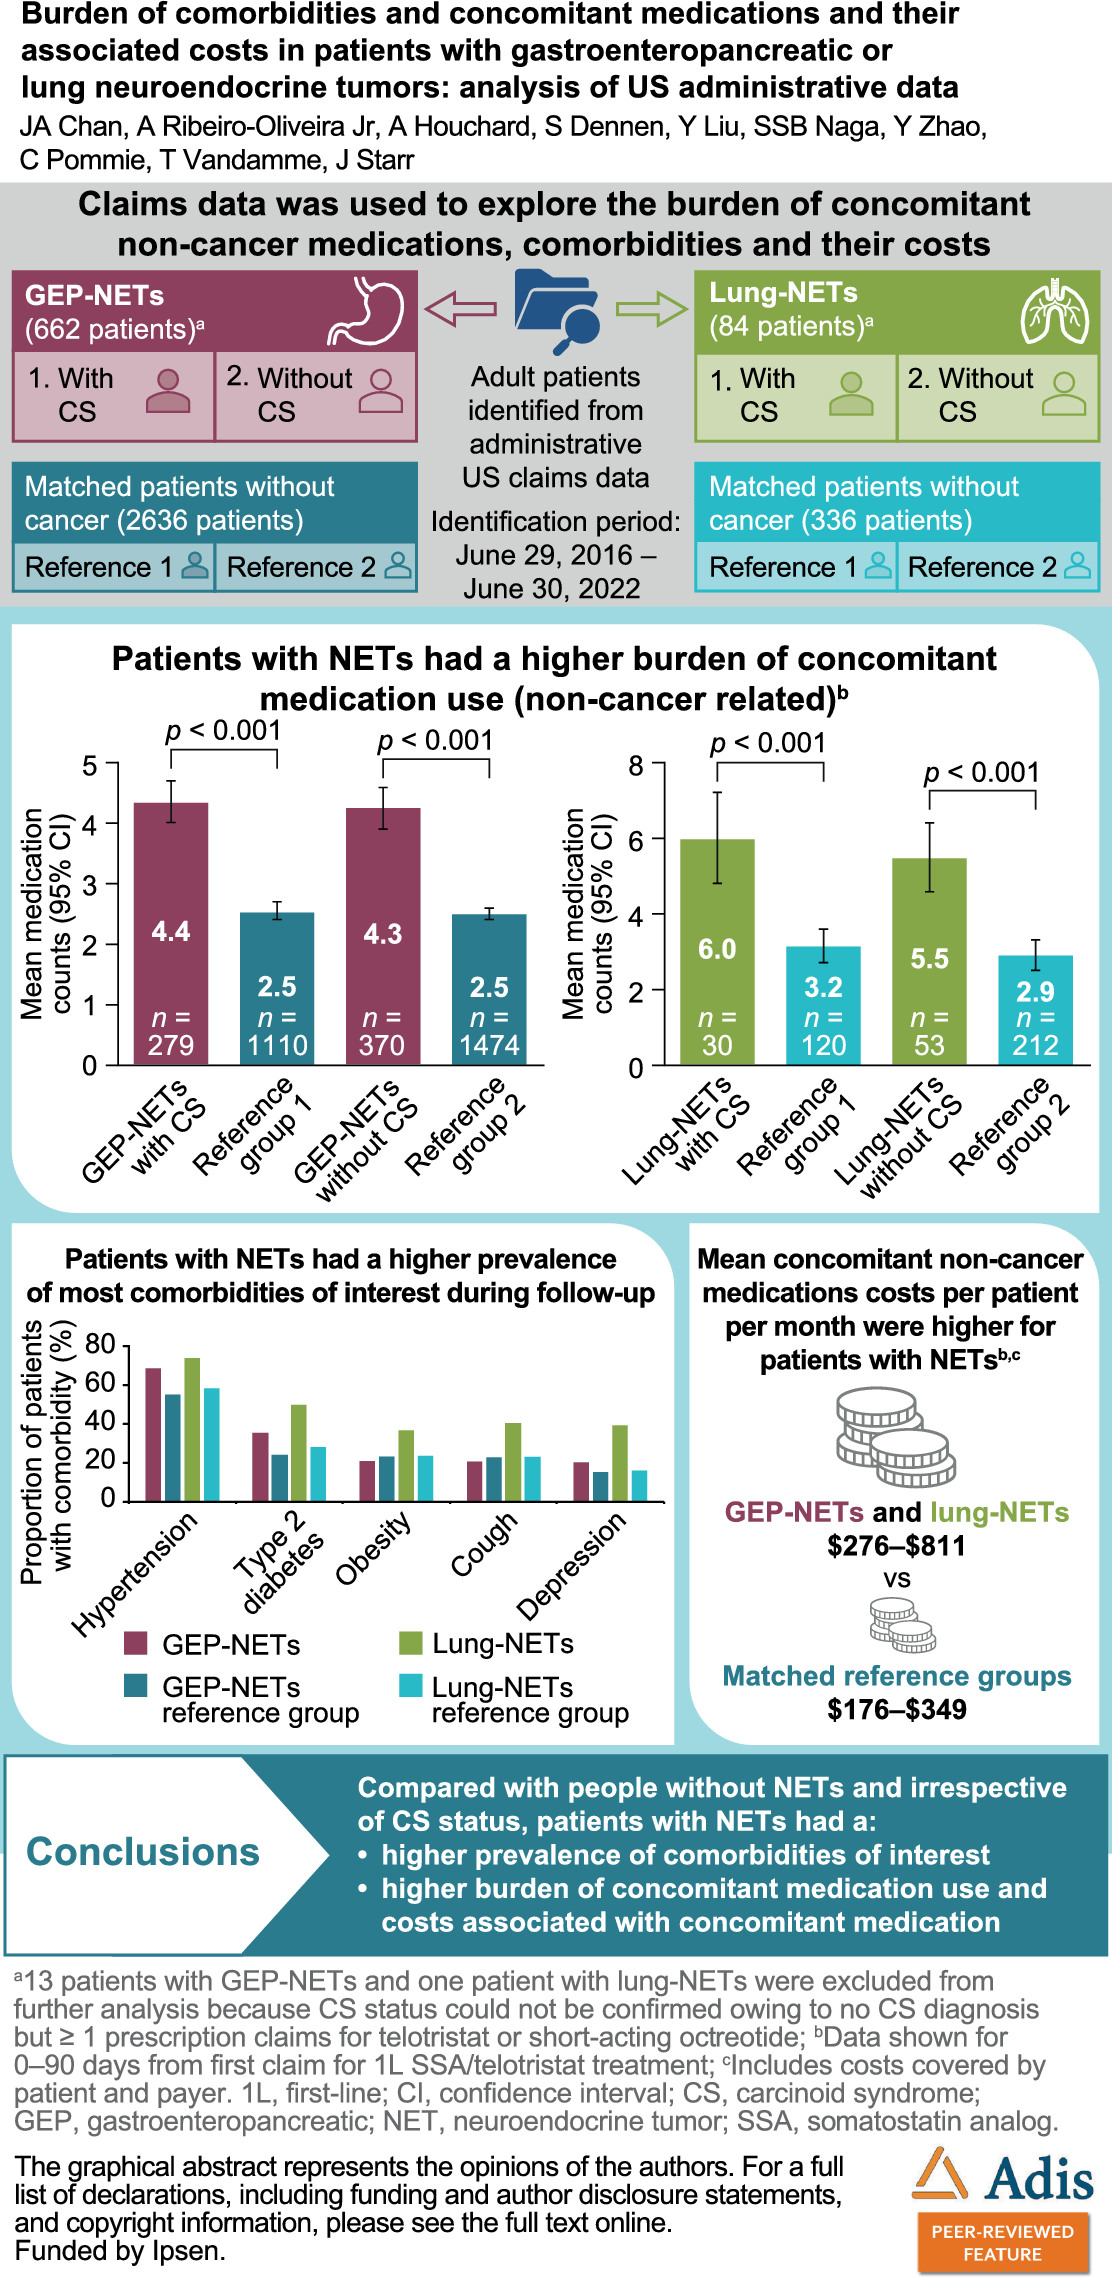
Patient Demographics and CharacteristicsPatients with GEP-NETsMean (standard deviation [SD]) patients age was 59 (12) years; 54.7% were male (Table 1). Most patients were from the Southern US region (48.8%); 75.1% had commercial insurance. The mean (SD) adapted Charlson Comorbidity Index for patients was 2.5 times higher than for the GEP-NETs reference cohort (1.27 [1.30] vs 0.50 [0.98]). Common comorbidities of interest among patients with GEP-NETs (vs reference group) were hypertension (53.3% vs 35.8%), type 2 diabetes (24.3% vs 16.0%), obesity (14.8% vs 7.8%), weight loss (10.3% vs 0.4%), and cough (7.1% vs 6.1%) (Table 1).
Patients with Lung-NETsMean (SD) age was 61 (12) years; 28.6% were male (Table 2). Most patients with lung-NETs were from the Southern US region (40.5%); 65.5% had commercial insurance. The mean (SD) adapted Charlson Comorbidity Index was 2.4 times higher than for the lung-NETs reference group (1.69 [1.39] vs 0.71 [1.28]). Common comorbidities of interest among patients with lung-NETs (vs reference group) were hypertension (61.9% vs 38.4%), type 2 diabetes (42.9% vs 22.6%), obesity (29.8% vs 7.4%), cough (25.0% vs 6.0%), and depression (22.6% vs 7.4%) (Table 2).
Total Counts of Prescribed Concomitant Medications in the 0–90 and 91–180 Days Post Index DatePatients with GEP-NETsIrrespective of CS status, mean total medication counts by therapeutic group were significantly higher (p < 0.001) for patients with GEP-NETs versus reference groups over the periods 0–90 days and 91–180 days post index date (Fig. 3). In the 0–90 days post index date, mean (SD) counts for patients with CS were 4.4 (3.1) versus 2.5 (2.4) for the reference group (rate ratio [RR] [95% confidence interval (CI)], 1.72 [1.54–1.93]). Mean (SD) counts for patients without CS were 4.3 (3.5) versus 2.5 (2.4) for the reference group (RR [95% CI], 1.71 [1.56–1.89]). Results were similar for the 91–180 days post index date (Fig. 3).
Fig. 3
Mean total concomitant medication counts by therapeutic group for patients with GEP-NETs versus reference groups. Reference group 1: matched with patients with GEP-NETs and CS. Reference group 2: matched with patients with GEP-NETs without CS. Analyzed using GLM with log link function and negative binomial distribution (or generalized Poisson regression for patients with GEP-NETs without CS in the 91–180 days post index date). Exact 95% CI used. CI confidence interval, CS carcinoid syndrome, GEP-NET gastroenteropancreatic neuroendocrine tumor, GLM generalized linear model, SSA somatostatin analog
When stratified by administration route, mean (SD) counts of oral, injectable, and “other” medications were 1.4–1.6 times higher, 2.3–3.5 times higher, and 1.8–2.0 times higher, respectively, for patients with GEP-NETs than for the reference group (Fig. 4).
Fig. 4
Mean total concomitant medication counts by therapeutic group for patients with GEP-NETs. Counts for oral medications (a) injectable medications (b) and “other” medications (C). Reference group 1: matched with patients with GEP-NETs and CS. Reference group 2: matched with patients with GEP-NETs without CS. Exact 95% CI used. Oral medications were identified by NDC codes associated with “oral” routes and by oral HCPCS codes. Injectable medications were identified by NDC codes associated with “intravenous”, “injection”, subcutaneous”, “intrathecal”, “intracavernosal”, “intramuscular”, or “intradermal”, and by non-oral HCPCS codes. Other medications were identified by NDC and HCPCS codes related to routes that were neither oral nor injectable. CI confidence interval, CS carcinoid syndrome, GEP-NET gastroenteropancreatic neuroendocrine tumor, HCPCS Healthcare Common Procedure Coding System, NDC National Drug Code, SSA somatostatin analog
Patients with Lung-NETsIrrespective of CS status, mean total medication counts by therapeutic group were also significantly higher (p < 0.005) in the 0–90 and 91–180 days post index date for patients with lung-NETs versus reference groups (Fig. 5). In the 0–90 days post index date, mean (SD) counts for patients with CS versus the reference group were 6.0 (3.2) versus 3.2 (2.6) (RR [95% CI] 1.91 [1.47–2.50]). Mean counts for patients without CS versus the reference group were 5.5 (3.3) versus 2.9 (2.7) (RR [95% CI] 1.9 [1.50–2.42]). Similar results were obtained in the 91–180 days post index date for patients without CS; mean (SD) counts were slightly lower than the first 3-month period for those with CS (4.8 [3.7]).
Fig. 5
Mean total concomitant medication counts by therapeutic group for patients with lung-NETs versus reference groups. Reference group 1: matched with patients with lung-NETs and CS. Reference group 2: matched with patients with lung-NETs without CS. Analyzed using GLM with log link function and negative binomial distribution. Exact 95% CI used. CI confidence interval, CS carcinoid syndrome, GLM generalized linear model, NET neuroendocrine tumor, SSA somatostatin analog
When stratified by administration route, mean (SD) counts of oral, injectable, and “other” medications were 1.5–1.7 times higher, 3.0–4.2 times higher, and 1.7–3.0 times higher, respectively, for patients with lung-NETs than reference groups (Fig. 6).
Fig. 6
Mean total concomitant medication count by therapeutic group for patients with lung-NETs. Counts for oral medications (a) injectable medications (b) and “other” medications (c). Reference group 1: matched with patients with lung-NETs and CS. Reference group 2: matched with patients with lung-NETs without CS. Exact 95% CI used. Oral medications were identified by NDC codes associated with “oral” routes and by oral HCPCS codes. Injectable medications were identified by NDC codes associated with “intravenous”, “injection”, subcutaneous”, “intrathecal”, “intracavernosal”, “intramuscular”, or “intradermal”, and by non-oral HCPCS codes. Other medications were identified by NDC and HCPCS codes related to routes that were neither oral nor injectable. CI confidence interval, CS carcinoid syndrome, HCPCS Healthcare Common Procedure Coding System, NDC National Drug Code, NET neuroendocrine tumor, SSA somatostatin analog
Frequency Distributions of Prescribed Concomitant Medications in the 0–90 and 91–180 Days Post Index DatePatients with GEP-NETsThe three medication therapeutic groups most frequently prescribed in patients with GEP-NETs (vs reference groups) in the 0–90 days post index date were central nervous system agents, such as antidepressants, benzodiazepines, and opioids (with CS: 62.0% vs 37.0%, p < 0.001; without CS: 57.0% vs 35.0%, p < 0.001); cardiovascular agents, such as angiotensin-converting enzyme inhibitors and beta blockers (with CS: 60.0% vs 51.0%, p = 0.007; without CS: 56.0% vs 50.0%, p = 0.022), and gastrointestinal drugs, such as antidiarrheal agents, laxatives, and antacids (with CS: 54.0% vs 18.0%, p < 0.001; without CS: 51.0% vs 16.0%, p < 0.001). In the 91–180 days post index date, findings were similar, with the three groups most frequently prescribed (vs reference groups) being cardiovascular agents (with CS: 59.0% vs 51.0%, p = 0.015; without CS: 58.0% vs 51.0%, p = 0.021), central nervous system agents (with CS: 55.0% vs 39.0%, p < 0.001; without CS: 50.0% vs 35.0%, p < 0.001), and gastrointestinal drugs (with CS: 47.0% vs 18.0%, p < 0.001; without CS: 45.0% vs 16.0%, p < 0.001). Medication frequency distributions by administration route are presented in Table 3.
Table 3 Medication therapeutic groups most received by patients with GEP-NETs versus reference groupsFor patients with GEP-NETs and CS (vs reference group), the three most frequently prescribed individual medications in the 0–90 days post index date were ondansetron hydrochloride (25.8% vs 1.9%, p < 0.001), acetaminophen/hydrocodone bitartrate (12.9% vs 4.5%, p < 0.001), and lisinopril (12.9% vs 8.9%, p = 0.058); for those without CS, they were ondansetron hydrochloride (20.3% vs 2.8%, p < 0.001), pantoprazole sodium (16.8% vs 3.9%, p < 0.001), and amlodipine besylate (15.9% vs 8.3%, p < 0.001). Individual medications prescribed in ≥ 5% of patients (including those prescribed between 91–180 days post index date) are summarized in Supplementary Tables 1 and 2 (patients with and without CS, respectively).
Patients with Lung-NETsThe three most frequently prescribed medication therapeutic groups in patients with lung-NETs (vs reference groups) in the 0–90 days post index date were cardiovascular agents (with CS: 80.0% vs 58.0%, p = 0.047; without CS: 75.0% vs 50.0%, p = 0.001), hormones and synthetic substitutes such as contraceptives, thyroid hormones, and antidiabetic agents (with CS: 77.0% vs 47.0%, p = 0.006; without CS: 64.0% vs 43.0%, p = 0.011), and central nervous system agents (with CS: 73.0% vs 43.0%, p = 0.006; without CS: 66.0% vs 36.0%, p < 0.001). In the 91–180 days post index date, findings were similar, with the three groups most frequently prescribed (vs reference groups) being cardiovascular agents (with CS: 70.0% vs 54.0%, p = 0.2; without CS: 70.0% vs 50.0%, p = 0.015), hormones and synthetic substitutes (with CS: 63.0% vs 43.0%, p = 0.1; without CS: 70.0% vs 42.0%, p < 0.001), and central nervous system agents (with CS: 57.0% vs 44.0%, p = 0.3; without CS: 70.0% vs 36.0%, p < 0.001). Medication frequency distributions by administration route are presented in Table 4.
Table 4 Medication therapeutic groups most received by patients with lung-NETs versus reference groupsAlbuterol sulfate was the medication most frequently prescribed in the 0–90 days post index date (lung-NETs and CS, 23.3% vs reference group, 7.5%, p = 0.029). At least 20% of patients with lung-NETs and CS (vs reference group) received prescriptions for the following: atorvastatin calcium (vs 19.2%, p > 0.9), fentanyl citrate (vs 0.0%, p < 0.001), gabapentin (vs 7.5%, p = 0.089), levothyroxine sodium (vs 9.2%, p = 0.2), lisinopril (vs 17.5%, p > 0.9), metoprolol succinate (vs 5.8%, p = 0.035), ondansetron hydrochloride (vs 0.8%, p < 0.001), oxycodone hydrochloride (vs 0.8%, p < 0.001), and pantoprazole sodium (vs 6.7%, p = 0.058); by those without CS, they were atorvastatin calcium (22.6% vs 11.3%, p = 0.054), amlodipine besylate (22.6% vs 10.4%, p = 0.031), levothyroxine sodium (18.9% vs 13.2%, p = 0.4), and ondansetron hydrochloride (18.9% vs 1.9%, p < 0.001).
Individual medications prescribed in ≥ 5% of patients (including those prescribed in the 91–180 days post index date) are summarized in Supplementary Tables 3 and 4 (patients with and without CS, respectively).
Concomitant Medication Costs in the 0–90 and 91–180 Days Post Index DatePatients with GEP-NETsMean (SD) overall concomitant medication costs per patient per month were significantly higher for patients with GEP‑NETs and CS and their payers than for the reference group in the 0–90 days post index date ($482 [1014] vs $212 [629]; p = 0.011) and 91–180 days post index date ($390 [949] vs $210 [638]; p = 0.037]) (Table 5). Mean (SD) overall concomitant medication costs per patient per month were also higher for patients with GEP-NETs without CS and their payers than for the reference group in the 0–90 days post index date ($636 [2038] vs $349 [4771]; p = 0.119), although the differences were not statistically significant. In the 91–180 days post index date, mean overall costs per patient per month were significantly higher for patients without CS and their payers than the reference group ($647 [1913] vs $302 [3615]; p = 0.028). When stratified by setting, the main driver of overall concomitant medication costs was outpatient costs. Median concomitant medication costs showed similar trends, although median costs were notably and consistently lower than mean costs as a result of variability in the data (Table 5).
Table 5 Concomitant medication costs (per patient per month) overall and by setting, excluding NET-specific treatment costs, for patients with GEP-NETs versus reference groupsPatients with Lung-NETsMean (SD) overall concomitant medication costs per patient per month were also higher for patients with lung-NETs (with and without CS) and their payers versus reference groups in the 0–90 days post index date ($811 [1536] vs $349 [1371]; p = 0.097 and $276 [452] vs $176 [459]; p = 0.449, respectively) and 91–180 days post index date ($566 [857] vs $285 [1313]; p = 0.166 and $409 [926] vs $216 [711]; p = 0.405, respectively), although the differences were not statistically significant (Table 6). When stratified by setting, the main driver of overall concomitant medication costs was outpatient costs. Median concomitant medication costs showed similar trends (Table 6).
Table 6 Concomitant medication costs (per patient per month) overall and by setting, excluding NET-specific treatment costs, for patients with lung-NETs versus reference groupsFrequency Distributions of Comorbidities in the Follow-up PeriodPatients with GEP-NETsDuring the follow-up period, patients with GEP-NETs had a higher prevalence of most comorbidities of interest than the reference cohort (exceptions were obesity, cough, and overweight) (Fig. 7a). The most common comorbidities (vs reference group) were hypertension (68.7% vs 55.0%), type 2 diabetes (35.5% vs 24.1%), obesity (21.0% vs 23.3%), cough (20.8% vs 23.0%), and depression (20.5% vs 15.3%). Frequency distributions of comorbidities were similar in patients with and without CS (data not shown) and were generally higher during follow-up (vs pre-index period) for the GEP-NETs and reference groups (Table 1).
Fig. 7
Frequency distributions of comorbidities in patients with GEP-NETs (a) and lung-NETs (b) in the follow-up period. The follow-up period was at least a 6-month period post index date that finished with the end of continuous enrollment or at the data cutoff date [December 31, 2022], whichever came first. GEP-NET gastroenteropancreatic neuroendocrine tumor, NET neuroendocrine tumor
Patients with Lung-NETsPatients with lung-NETs also had a higher prevalence of most comorbidities of interest in the follow-up period than the lung-NETs reference group (exceptions were overweight and pancreatic exocrine insufficiency [no observed cases in this comparison]) (Fig. 7b). The most common comorbidities (vs reference group) were hypertension (73.8% vs 58.3%), type 2 diabetes (50.0% vs 28.3%), cough (40.5% vs 23.2%), depression (39.3% vs 16.1%), and obesity (36.9% vs 23.8%). Frequency distributions of comorbidities were similar in patients with and without CS (data not shown) and were generally higher during follow-up than in the pre-index period for the lung-NETs and reference groups (Table 2).
Comments (0)