
Remember me

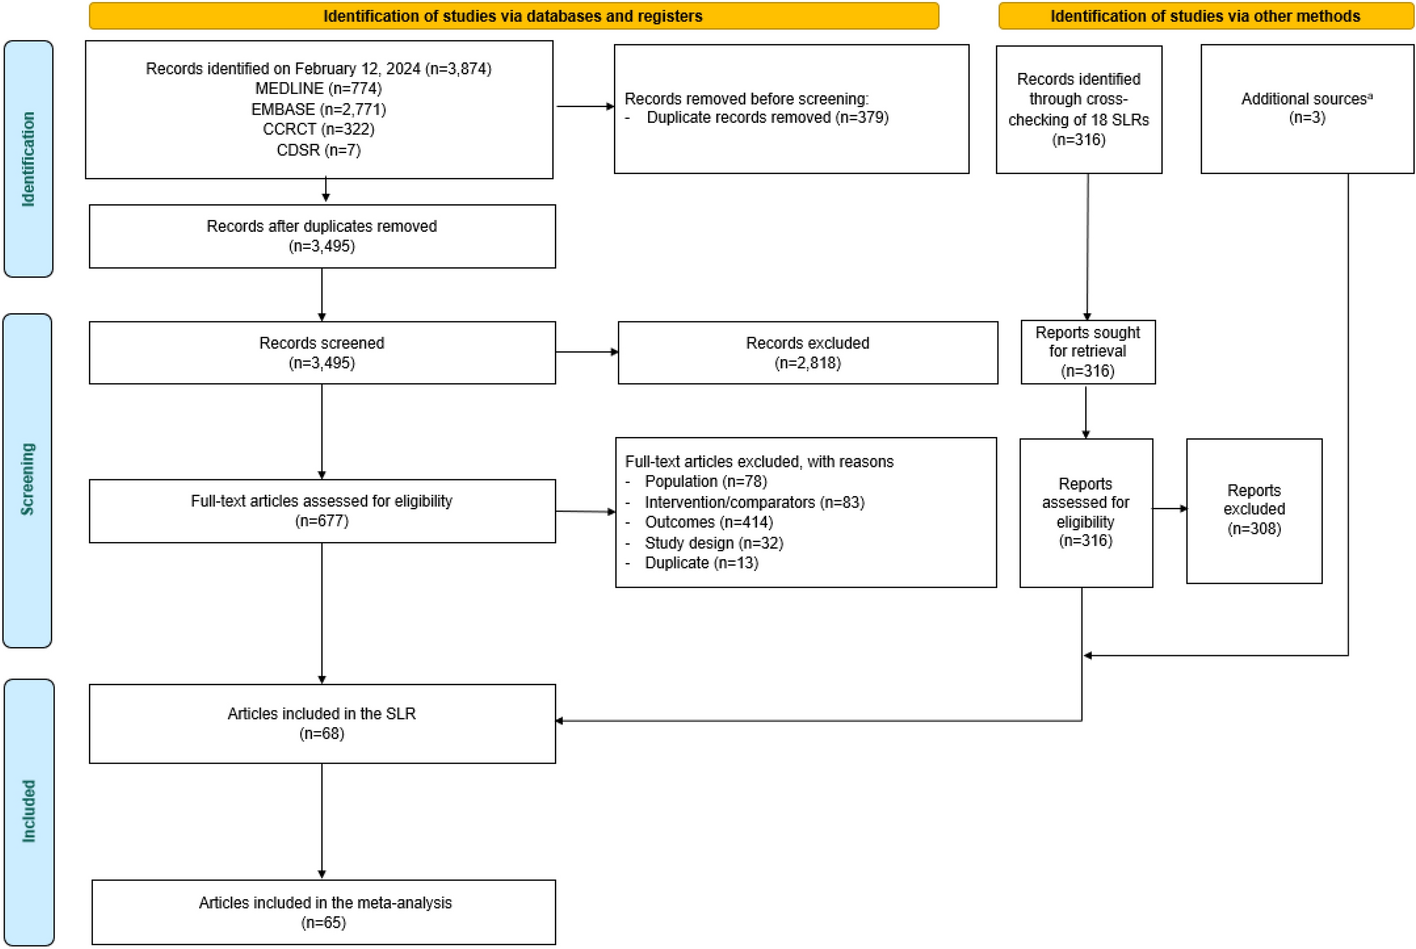


Of the 2572 participants screened for eligibility, 455 patients were enrolled in this study (Fig. 1). The main reasons for ineligibility were wrong diagnosis (1115/2572, 43.4%), wrong stage of PCa (580/2572, 22.6%), and lack of knowledge of PCa stage (19/2572, 0.7%). Of 455 participants enrolled, 442 (97.1%) completed the survey within the 1-week completion window; 13 (2.9%) of these withdrew from the study, and 28 (6.3%) were identified as speeders and excluded. There were no flat-liners or participants with more than 20% of data missing. The FAS comprised 414 participants, with most participants coming from Italy (123/414; 29.7%) and the UK (117/414; 28.3%), followed by Spain (90/414; 21.7%), France (61/414; 14.7%), and Belgium (23/414; 5.6%).
Fig. 1
Patient disposition. aAll participants who were provided with access to the screening section of the survey. bParticipants who met all inclusion criteria and none of the exclusion criteria. c28 participants were empirically identified as speeders and were not included in the FAS. dParticipants in the enrolled population who withdrew themselves from the study. eParticipants the enrolled population who completed the entire survey within the 1-week time frame. FAS, full analysis set
Baseline sociodemographic and clinical characteristics are presented in Table 1. The mean (SD) age was 64.2 (10.5) years, and 67.9% (281/414) of participants had regional PCa versus 32.1% (133/414) with metastatic disease, with some diversity in distributions across countries for some characteristics. Most participants were receiving injections every 3 months (236/414, 57.0%). The most frequently reported duration of treatment was 3 years (149/414, 36.0%), while a combined 50.0% had treatments lasting 1 (83/414, 20.1%) or 2 (124/414, 30.0%) years.
Table 1 Survey participant sociodemographic and clinical characteristicsPatient PreferencesPreferences Regarding Frequency of GnRH Agonist Injections (Primary Objective 1)Over half of the participants (223/414; 53.9%) reported a preference for a 6-month injection frequency, 27.3% (113/414) preferred a 3-month frequency, and 18.8% (78/414) reported no preference (Fig. 2). In Belgium and the UK, there was little difference between preferences for a 6-month versus 3-month injection frequency, whereas in Italy, Spain, and France a 6-month frequency was strongly favored. Belgium was the only country where a 3-month frequency was most preferred.
Fig. 2
Preference for frequency of treatment, by country and overall. Question administered to respondents (English version) was the following: “If you could decide for yourself, considering different frequencies have the same degree of successful results, how often would you prefer to receive your injectable hormonal treatment?” FAS, full analysis set
Preferences for injection frequency by subgroup are presented in Fig. 3. Across most subgroups, a high proportion of participants expressed a preference for a 6-month injection frequency. Exceptions to this, in which a 3-month frequency was either preferred or had a similar level of preference to the 6-month frequency, were reported for younger participants (< 65 years), those who had experienced worsening of their disease in the past year, participants who visited their doctor frequently (every month or every 3 months), and those who were not aware of different injectable treatment regimens. Only one subgroup (patients aged 80 years or older) reported that most participants had no preference for a particular injection frequency; however, this subgroup was extremely small (n = 8) so this finding should be interpreted with caution.
Fig. 3
Preference for frequency of treatment by subgroups. *Owing to the small patient numbers in this group, these results should be interpreted with caution
Reasons for Injection Frequency Preference, and Treatment Satisfaction and ConvenienceAmong the 113 participants who preferred a 3-month injection frequency, routine and perceived control over their disease were factors identified as important, with 38.1% (43/113) receiving their injections at the same frequency as doctor visits, 31.9% (36/113) believing their disease was better managed with a 3-month frequency, and 28.3% (32/113) expressing a desire to stick to their current treatment routine (Table 2).
Table 2 Reasons for preferences of a specific injection regimen and satisfaction with current frequency of injectable treatmentAmong 223 participants who preferred a 6-month injection frequency, convenience and routine were also identified as important in this preference. However, 7.2% (16/223) indicated that their preference was based on a dislike or fear of injections. For participants with no preference, 60.3% (47/78) indicated that this is because they defer to their doctor’s advice.
Overall, most participants (285/414; 68.8%) were satisfied with their current injection frequency (Table 2). When stratified by subgroup, satisfaction remained high across all groups (Fig. 4). Of patients who received injections every 6 months, 77.0% (137/178) were satisfied with the current frequency, and of those receiving injections every 3 months, 62.7% (148/236) were satisfied.
Fig. 4
Satisfaction with current frequency of injectable treatment by subgroups. *Owing to the small patient numbers in this group, these results should be interpreted with caution
Within the past 12 months, 30.7% (127/414) of participants reported a change in the frequency of their injection schedule; 66.9% (85/127) of those participants expressed greater satisfaction with their current versus previous injection frequency (Table 2). Although most participants felt their current injection frequency was convenient (202/414; 48.8%), 37.9% (157/414) reported that injections less often would be more convenient; only 13.3% (55/414) felt that more-frequent injections would be convenient (Table 2).
Direct/Indirect Costs, Healthcare Utilization, and Burden Associated with Frequency of InjectionNearly half of the participants (194/414; 46.9%) reported attending a doctor appointment every 3 months, 33.6% (139/414) attended every month, and 12.8% (53/414) every 4 months; 5.3% (22/414) of participants visited a doctor multiple times per month (Table 3). Most GnRH agonist injections were primarily administered by urologists or oncologists (237/414; 57.2%) and nurses (106/414; 25.6%), with administration by general practitioners (29/414; 7.0%) and trained family members/caregivers (41/414; 9.9%) less common. The most frequent location for receiving GnRH agonist injections was at a hospital, either during (203/414; 49.0%) or separate to (111/414; 26.8%) follow-up visits. Most participants (343/414; 82.9%) reported the need for transportation to their injection appointments, with 35% (120/343) using their own car, 22.4% (77/343) using their caregiver’s car, and 24.5% (84/343) using taxis (Table 4). Of the employed participants, 79.2% (118/149) had to ask for time off from work for their injection appointment (Table 4). Accompaniment for treatment was also important, with 66.2% (274/414) of participants never going alone; 58.7% (205/349) confirmed that their companions had to take time off from work to attend appointments.
Table 3 Healthcare utilization for injection appointmentsTable 4 Transportation and accompaniment needs, and workdays lost for injection appointmentsSeveral statistically significant correlations between the logistical factors of injectable hormonal treatment and the associated time and work-related burdens on patients requiring transportation were identified. These included that patients who required transportation to receive treatment also tended to travel further to receive their injection (r = − 0.46, P < 0.0001), spent more time receiving the injection (r = − 0.53, P < 0.0001), and experienced a more significant impact on their work schedule (r = 0.50, P < 0.001).
Association Between Sociodemographic and Clinical Characteristics with Patients’ Injection Frequency PreferenceFollowing the univariate analysis, the 6-month injection frequency was significantly more likely to be preferred over the 3-month option by patients who were employed [odds ratio (OR) 0.410, 95% confidence interval (CI) 0.257–0.653], experienced an impact on work schedule due to treatment (OR 0.331, 95% CI 0.125–0.880), and those accompanied to injection appointments sometimes (OR 0.255, 95% CI 0.105–0.620) (Table 5). Each additional year of age was associated with a slight increase in the preference for the 6-month regimen (OR 0.949, 95% CI 0.928–0.971). However, patients with a master’s degree or higher were more likely to prefer the 3-month injection frequency (OR 6.995, 95% CI 3.512–13.932).
Table 5 Association between sociodemographic and clinical characteristics with patients’ injection frequency preferenceFollowing the multivariate analysis, several determinants were associated with patients’ preferences for a specific injection frequency. Among participants who were employed, older age (OR 0.943, 95% CI 0.904, 0.984) and being diagnosed after 2020 (OR 0.389, 95% CI 0.156, 0.970) were associated with a preference for the 6-month injection frequency (Table 5). Among participants who were unemployed/retired, factors that were associated with a preference for a 6-month frequency were stability of the disease without worsening (OR 0.290, 95% CI 0.126, 0.664), and if participants attended injection appointments with a companion, consistently (OR 0.183, 95% CI 0.058, 0.577) or occasionally (OR 0.067, 95% CI 0.014, 0.326) (Table 5). A 3-month injection frequency was preferred by unemployed/retired participants with higher educational achievements, specifically those with master’s or higher degrees (OR 19.382, 95% CI 5.339, 70.359), and by those who were satisfied with their current injection frequency (OR 4.371, 95% CI 1.637, 11.674).
Patient Experience of Treatment Decision-MakingReceipt of Information About GnRH Treatments and Involvement in Treatment Decision-Making (Primary Objective 2)Two-thirds of participants (272/414; 65.7%) were aware that different frequencies of injectable GnRH treatments were available to treat their PCa (Table 6). Across subgroups (Fig. S3), at least 50% of participants were aware that different injection frequencies were available, except for patients who currently visited their doctor every month, of whom only 42.3% (22/52) were aware. Over 80% of participants were aware of different treatment frequencies in older subgroups [≥ 80 years, 8/8 (100%); 75–79 years, 37/44 (84.1%)] and among participants who were actively involved in their treatment decision-making (19/22; 86.4%). When grouped by patients’ involvement in treatment-related decision-making, the proportion of participants reporting awareness of different injectable treatment frequencies was highest among participants reporting being actively involved (19/22; 86.4%), followed by participants reporting being passively involved (96/145; 66.2%) and jointly involved (157/247; 63.6%).
Table 6 Patient awareness of treatment options and involvement in treatment decision-makingMost patients had received some level of information from their treating healthcare provider about side effects or different injection frequencies: 32.4% (134/414) received information on side effects only, 30.9% (128/414) on different injections frequencies, and 31.9% (132/414) on both side effects and injection frequencies (Table 6). Only 4.8% (20/414) reported receiving no information.
In terms of treatment decision-making, 42.8% (177/414) of participants indicated that decisions about injection frequency were made jointly with their doctor (Table 6). However, 35% (145/414) of participants left it up to their doctor to make the decision. Across subgroups (Fig. S4), shared involvement in decision-making was also most frequently reported, except for participants who currently visited their doctor every 12 months: 53.8% (n = 7) of these participants reported passive involvement, although this subgroup was very small (n = 13) so data should be interpreted with caution.
Exploratory Endpoints Related to Patient Experience of Treatment Decision-MakingAmong the 272 participants who were aware of the different injection frequencies available, 62.1% (n = 169) reported a preference for the 6-month injection frequency (Table S3). The preference for the 6-month formulation was consistently observed across subgroups based on awareness of specific treatment intervals (every 1, 3, 4, 6, or 12 months). Regardless of the preferred injection frequency, most participants reported a shared involvement in treatment decision-making (Table S4). The exceptions were among the 4.8% (20/414) of participants who did not receive information on available injection frequencies and/or side effects, of whom 55.0% (11/20) reported passive involvement in their treatment decisions, and among 6.3% (26/414) of participants who rated the information they were provided as unimportant, 76.9% (20/26) reported passive involvement. Significant associations were observed between those who make the treatment decision and the type of information provided (r = 0.06, P < 0.0001), and the rating of the importance that a patient had assigned to the information they receive and who makes the treatment frequency decision (r = 0.24, P < 0.0001). The correlation between the type of information (side effects, different frequency options of treatment, or both types of information) that participants received from healthcare providers on treatment frequency options and how they rated the importance of that information was very weak (r = 0.03, P > 0.001).
Comments (0)