
Remember me

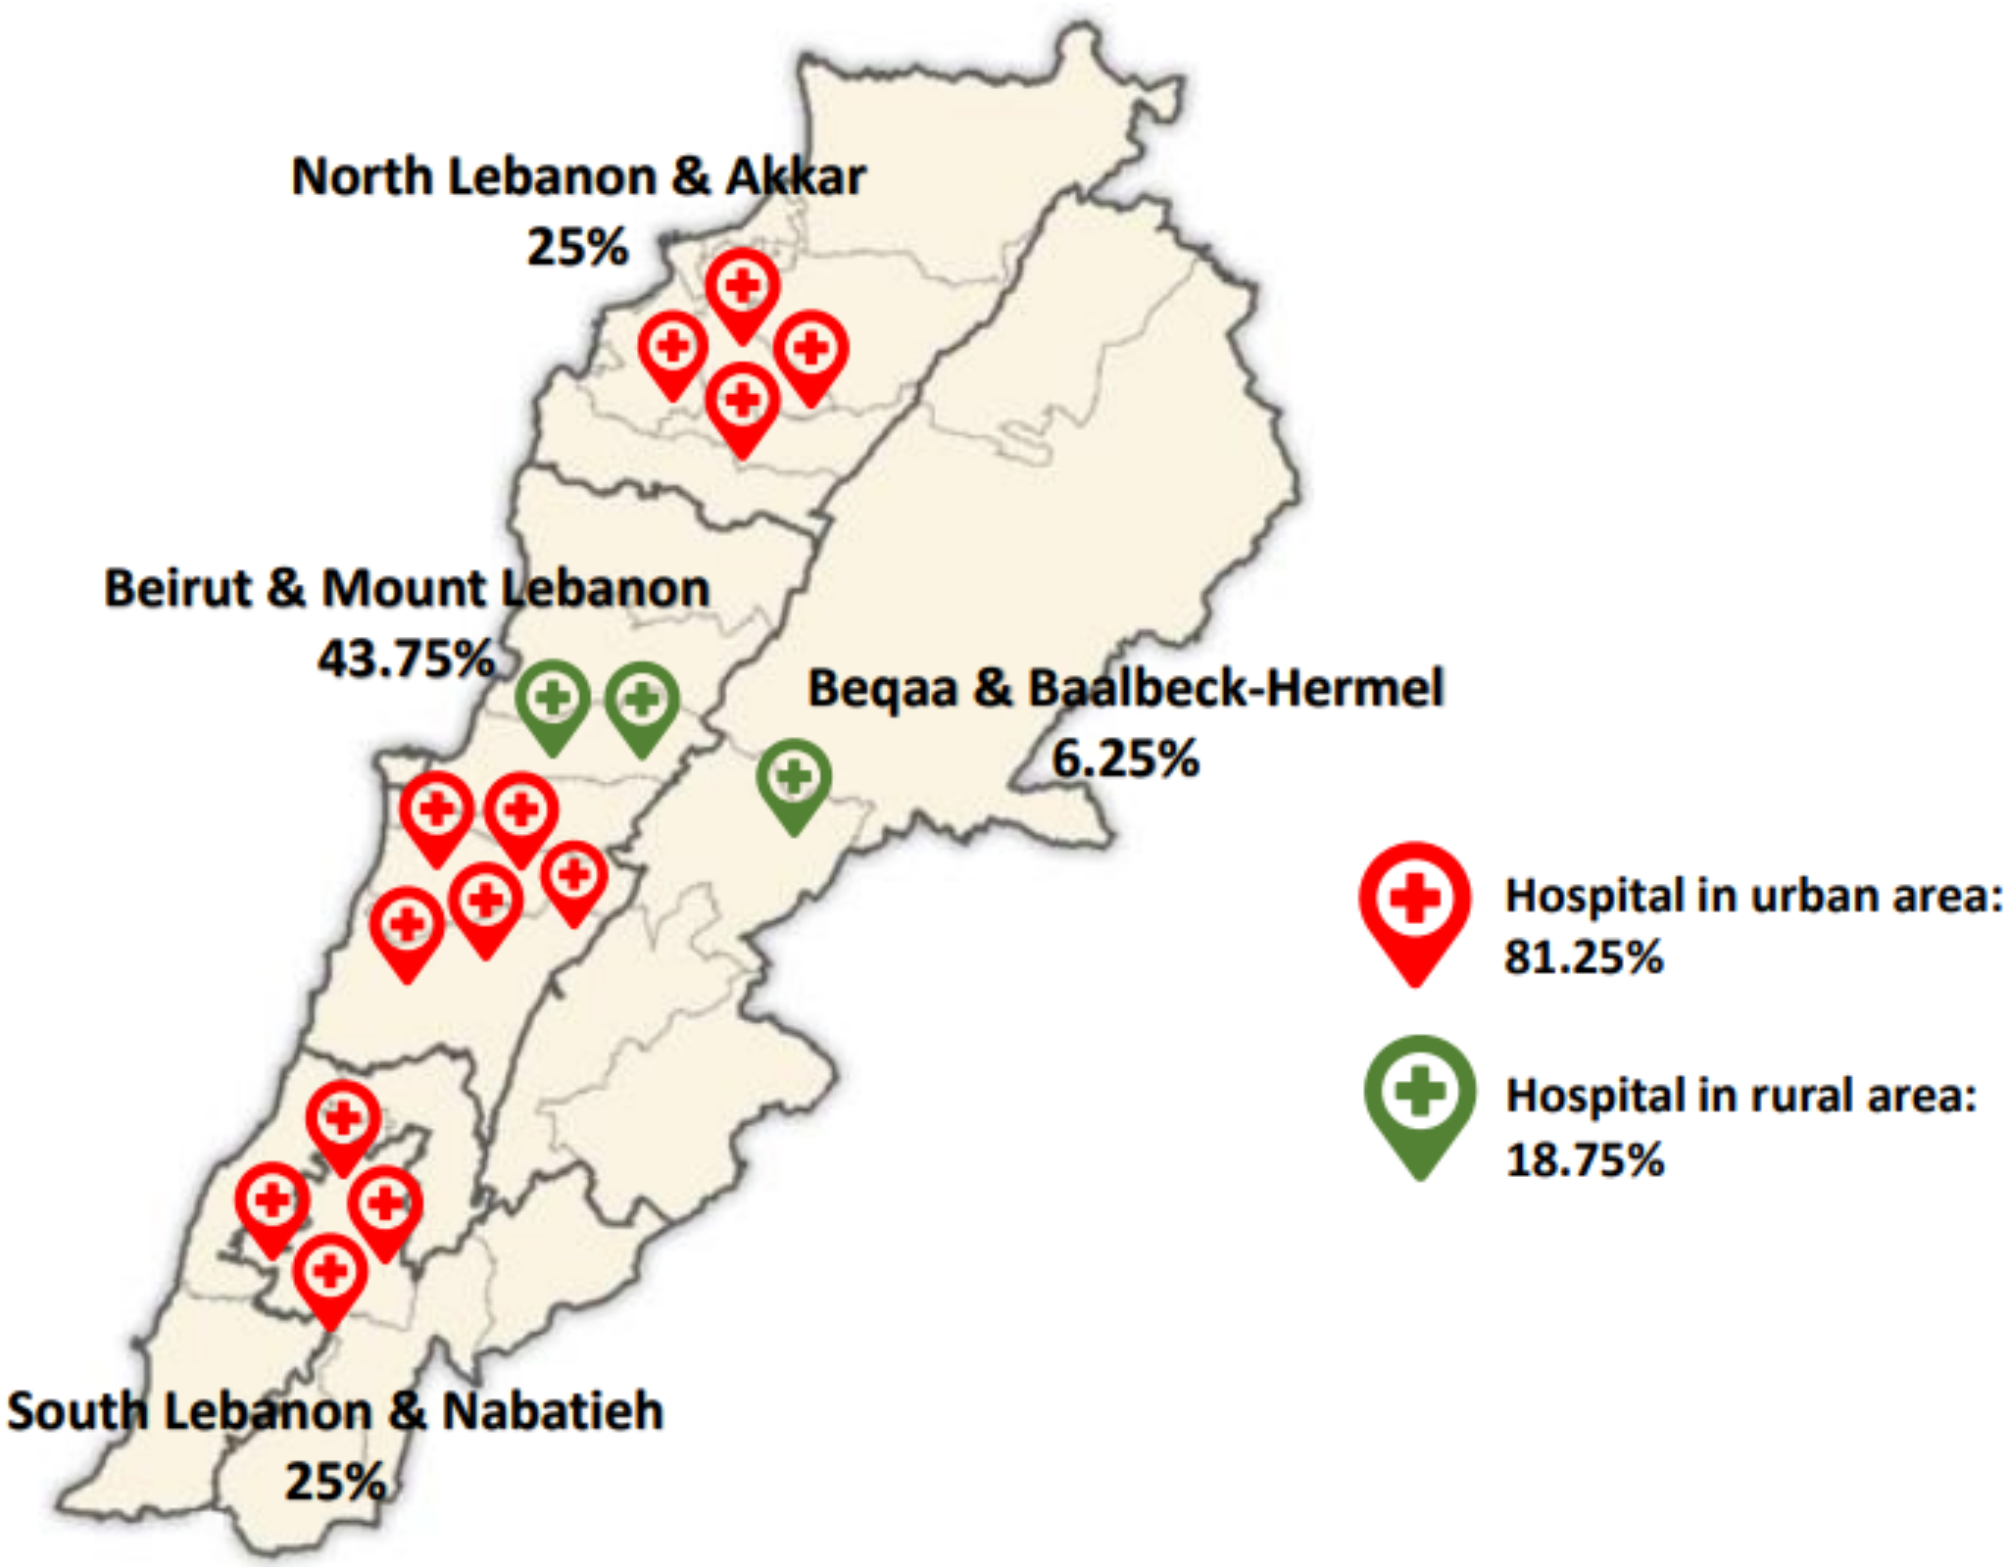
Out of 180 eligible patients, 25 were excluded because they were discharged before spending one full day at the hospital. The study thus included 155 in-patients from cardiovascular (n = 54), gastrointestinal (n = 21), OBGYN (n = 24) and surgical (n = 56) wards. Of the participants, 58.1% were females. Most participants were residing in Beirut & Mount Lebanon (n = 69, 44.5%).
The basic demographic and socioeconomic characteristics of the study participants and their hospital stay information are summarized in Table 1. Participants had a mean age of 49 years (SD: 15), and the majority (81.9%) had a hospital stay of less than seven days. Almost half of the participants (54.2%) were aged between 51 and 65 years. The mean Body Mass Index (BMI) was 25.38 (SD: 5.56) for male participants and 27.68 (SD: 6.44) for female participants, with female participants having a significantly higher BMI (p-value = 0.048). About one-third of participants reported having no chronic diseases. As for the ones who reported having chronic diseases, blood pressure was the most prevalent one (34.2%), followed by diabetes (25.8%). The prevalence of chronic diseases in the study participants is summarized in Fig. 3.
Table 1 Sociodemographic characteristics, hospital stay information, and anthropometric characteristics of the study population, overall and by genderMost participants (75.5%) had a household monthly income of less than US$500. Almost half of the participants (51%) had a crowding index below 1, which indicates a higher socioeconomic status. The crowding index is calculated by dividing the number of people living in a household by the number of rooms in the house (excluding bathrooms, balconies, porches, foyers, hallways, and half-rooms); values above 1 indicate a household is crowded, and eventually has a lower socioeconomic status [19].
A significant difference was found between genders when it comes to employment status (p-value < 0.001), marital status (p-value = 0.027), and household crowding index (p-value = 0.03).
Fig. 3
Medical characteristics of study participants
Nutritional value of food served in hospitalsEnergy content of food servedThe mean weight of served food was 1.24 kg (SD: 0.43) and contained a mean of 1489 kcal energy (SD: 546.55) per hospital bed per day. The mean energy requirement for each patient was 1891.6 kcal per day, which means that on average, the food served accounted for 79% of the patient’s daily estimated energy requirement (EER).
The mean daily estimated dietary energy content of food served in Lebanese hospitals and the percent contribution to estimated energy needs by different age groups and genders is shown in Table 2. Based on our findings, the mean energy content of food served for all age groups and genders was lower than the EER, and most participants were served food for which the energy content did not exceed their EER. For instance, the energy content of food served exceeded the EER for 29 participants in our study, accounting for only 19% of the study population.
Table 2 Estimated dietary energy content of food served to adult patients in Lebanese hospitals and percent contribution to estimated energy needs by age and genderMacronutrient content of food servedThe macronutrient content of food served in Lebanese hospitals is shown in Table 3. Our results showed that food served provided more than 70% of the percent daily value (% DV) for males in all age groups and more than 80% of the % DV for the females in all age groups, with females in the age group 51–65 being provided by 94% of their daily carbohydrates needs. The percent composition of carbohydrates in food served ranged from 51.7 to 62.8%. Concerning the fat content, the percent composition ranged from 19.3 to 30.6%, and patients were provided more than 55% of their % DV except for the 18-year-old age group, in which males and females were provided 50% and 42% of their % DV, respectively. As for proteins, the percent composition in the food served ranged from 17.65 to 21%, with patients of all ages and genders being provided more than 55% of their % DV. Furthermore, the food served provided less than 75% of the estimated dietary fiber requirements to patients of all ages and genders. None of the documented nutrient content in the food served reached 100% of the daily value requirements.
Table 3 Macronutrient content of food served in Lebanese hospitals and contribution to percent daily value, per age and per genderMicronutrient content of food servedThe micronutrient content of food served in Lebanese hospitals is shown in Table 4. Our results showed that the percent contribution of food served to daily value varied across micronutrients. For instance, the percent contribution of food served to daily needs exceeded 75% for most B vitamins in all age groups and genders, especially thiamin, riboflavin, niacin, and B6. As for folate and B12, it exceeded 65% in all age groups and genders except for the female in the 18 years age group, where it provided less than 50% for both vitamins and less than 60% of B12 for the males in this age group. As for vitamin C, patients in all age groups and genders were provided more than 50% of their estimated daily needs except the females in the 18 years age group (48%). In addition, females in the age group 19–30 years were provided more than 100% of their estimated daily value (107%). Bone-related nutrients include calcium, phosphorus, magnesium, and vitamin D. The calcium content in the meals served to patients was below 85% of the recommended daily intake requirements, with the lowest amount in the female patients aged 18 years and those aged 51–65 years, being 38% and 48.33%, respectively. The percentage daily value of phosphorus exceeded 100% for the majority of patients of all genders except for 18-year-old patients, where the recorded values were lower than 70% for both age groups. As for vitamin D, food served provided less than 20% of the daily needs of all patients. Moreover, our results revealed that patients in all age groups and genders were provided less than 55% of their daily vitamin A and vitamin E requirements, except for vitamin A in the females belonging to the 19–30 age group (66%). Additionally, patients in all age groups and genders were provided 60% or more of their daily iron needs except for the female in the 18 years age group (40%).
Table 4 The micronutrient content of food served in Lebanese hospitals and contribution to percent daily value, per age and per genderFood groups served based on the Mediterranean diet classificationBased on our findings, the most served food group in hospitals was the ‘grains and cereals’ group from which a patient was served on average 4.51 servings per day, followed by 3.92 servings from the ‘meat, poultry and fish’ group, and 3.52 servings from the ‘dairy products’ group.
Compared to the Mediterranean diet, our results showed that hospitals’ diets showed low adherence to the Mediterranean diet when it comes to many food group. For instance, per day, hospitals served more than the recommended amounts of the following: sweets (3.47 servings served vs. 0.28 servings recommended); dairy products (3.52 servings served vs. 2 servings recommended); meat (1.57 servings served vs. a maxium of 0.57 serving recommended); poultry (1.57 serving served vs. 0.57 serving recommended). On the other hand, hospitals served less than the recommended amounts of the following groups: Vegetables (3 servings served vs. 6 servings recommended); fruits (0.7 serving served vs. 3 servings recommended); legumes (0.11 serving served vs. at least 0.57 serving recommended). ‘Fish’ and ‘grains and cereals’ groups were within the recommendations. A pyramid showing the comparison of the food groups served at hospitals to the Mediterranean diet is shown in Fig. 4.
Fig. 4
Pyramid comparing the diets served in Lebanese hospitals to the Mediterranean diet recommendations (The value for meat is the maximum recommended daily intake; values of fish and legumes are the minimum recommended daily intake)
Composition of food consumed by patients in terms of energy, macronutrients and micronutrientsEnergy consumptionOur results revealed that, on average, a patient consumed 0.85 kg of food (68% of the amount served), which contained a mean of 1084 kcal per day, equivalent to 57% of a patient’s daily energy requirements. Energy content and contribution to EER of food served at hospitals and wasted/consumed by patients is shown in Fig. 5.
Fig. 5
Energy content and percent EER of food served, wasted, and consumed
Estimated macronutrient values of food consumed by hospitalized patientsThe mean estimated daily carbohydrate intake for 18-year-old hospitalized male and female patients is equivalent to 111.37 g per day (g/day) and 95 g/day, respectively, less than 45% of the required carbohydrate intake per day. A lower percentage of carbohydrate intake is noticed in males aged 19 to 30 years, equivalent to 82.5 g/day (27.5% of the estimated daily needs). Intake of carbohydrates did not exceed 70% for all age groups and genders, and none of the patients who participated consumed their required carbohydrate daily intake. As for proteins, the consumed food provided less than 70% of the daily required protein intake for all patients. Our results revealed that the females in the 18-year-old group consumed the least amount of protein (19 g/day), representing only 21.2% of the total daily protein needs. As for total fat, based on our findings, the amount consumed by hospitalized patients varied between different ages and genders and ranged from 8 g/day for females in the 18 years age group to 83.13 g/day for females aged 19–30 years. Plus, we found that consumption of saturated fat exceeded 40% of the limit for all age groups and genders except the females in the 18-year-old group (22%), with females in the 19–30 age group exceeding 90% of the limit. In addition, consumption of monounsaturated fat was less than 35% of the recommended amount in all age groups and genders. As for dietary fiber intake, we found that patients consumed less than 60% of their daily requirements. The detailed estimated macronutrient intake of hospitalized Lebanese patients across different age groups and genders is shown in Table 5.
Table 5 Macronutrient content of food consumed by patients, per age and per genderEstimated micronutrient value of food consumed by hospitalized patientsThe highest amount of vitamin C consumed among patients was observed in males of the 18-year-old group, totaling an average of 38 milligrams per day (mg/day), accounting for 51% of their daily dietary requirements. A low vitamin C intake was noticed in males in the 19–30 age group, in which, on average, as little as 5.3 mg/day was consumed, accounting for 7% of their daily needs. As for B vitamins, it is noteworthy that none of the patients of all age categories and genders met their recommended intake levels for these vitamins. Moreover, it was observed that patients were consuming less than 65% of their recommended daily folate intake, with the least amount of folate being consumed by the female in the 18 years age group, equivalent to 79 micrograms per day (µg/day), covering only 19.7% of their daily needs. As for vitamin B12, consumption varied between patients, with the highest amount consumed in 19 to 30-year-old females (2.21 µg/day representing 92% of their daily needs) and the lowest in the females aged 18 years old who did not consume vitamin B12. As for calcium, patients in all age groups and genders consumed less than 55% of their estimated daily needs, except females in the 19–30 age group, who consumed, on average, 688.38 mg/day, representing 69% of their required daily needs. The amounts of other micronutrients, such as iron, zinc, vitamin A, vitamin K, etc. consumed by hospitalized Lebanese patients are shown in Table 6.
Table 6 Micronutrient content of food consumed by patients, per age and per genderConsumption of meals and snacksThe consumption of every meal and snack by patients is shown in Table 7. Our results showed that patients consumed 36.8%, 28.4%, 27.7%, and 43.9% of the provided breakfast, lunch, dinner, and snacks, respectively. A significant difference in consumption between genders existed for lunch (P-value = 0.045) and snacks (P-value = 0.029), with more males consuming all of the provided meals than females. Most patients (71%) reported not bringing food from outside during their hospital stay.
Table 7 Meals and snacks consumption at hospitals among study participants, overall and by gender
Comments (0)