
Remember me


Globally, the number of elderly individuals (aged 60 and above) diagnosed with neuroblastoma and peripheral nervous system tumours increased from 281.36 (95% UI 221.73, 352.95) per 100,000 in 1990 to 1166.65 (95% UI 918.18, 1413.19) per 100,000 in 2021, representing an increase of 314.65%. Simultaneously, the age-standardised prevalence rate increased from 0.06 per 100,000 (95% UI 0.05, 0.08) in 1990 to 0.11 per 100,000 (95% UI 0.09, 0.13) in 2021, with an EAPC of 1.74 (95% CI 1.57, 1.91) (Fig. 1A, Table 1). Regarding incidence, the number of new cases rose from 562.72 (95% UI 443.46, 705.91) per 100,000 in 1990 to 2333.31 (95% UI 1836.36, 2826.39) per 100,000 in 2021, also marking a 314.65% increase. The age-standardised incidence rate showed a similar EAPC of 1.74 (95% CI 1.57, 1.91), increasing from 0.12 per 100,000 (95% UI 0.09, 0.15) in 1990 to 0.22 per 100,000 (95% UI 0.17, 0.26) in 2021 (Fig. 1B, Supplementary Table 1). Regarding mortality, the death count in 2021 was 1593.92 (95% UI 1329.94, 1781.63) per 100,000, a significant rise from 424.42 (95% UI 361.82, 491.51) per 100,000 in 1990, representing an increase of 275.55%. The age-standardised mortality rate similarly showed a notable increase, rising from 0.09 per 100,000 (95% UI 0.08, 0.11) in 1990 to 0.15 per 100,000 (95% UI 0.12, 0.17) in 2021, accompanied by an EAPC of 1.42 (95% CI 1.29, 1.56) (Fig. 1C, Supplementary Table 2). Regarding DALYs, the total number of DALYs in 2021 resulting from neuroblastoma and peripheral nervous system tumours in the elderly was 32,050.19 (95% UI 26,840.23, 35,736.83), an increase of 262.53% compared to 8,840.78 (95% UI 7,492.67, 10,292.56) in 1990. The age-standardised DALY rate also rose from 1.82 per 100,000 (95% UI 1.55, 2.12) in 1990 to 2.95 per 100,000 (95% UI 2.47, 3.29) in 2021, with an EAPC of 1.40 (95% CI 1.27, 1.53) (Fig. 1D, Supplementary Table 3).
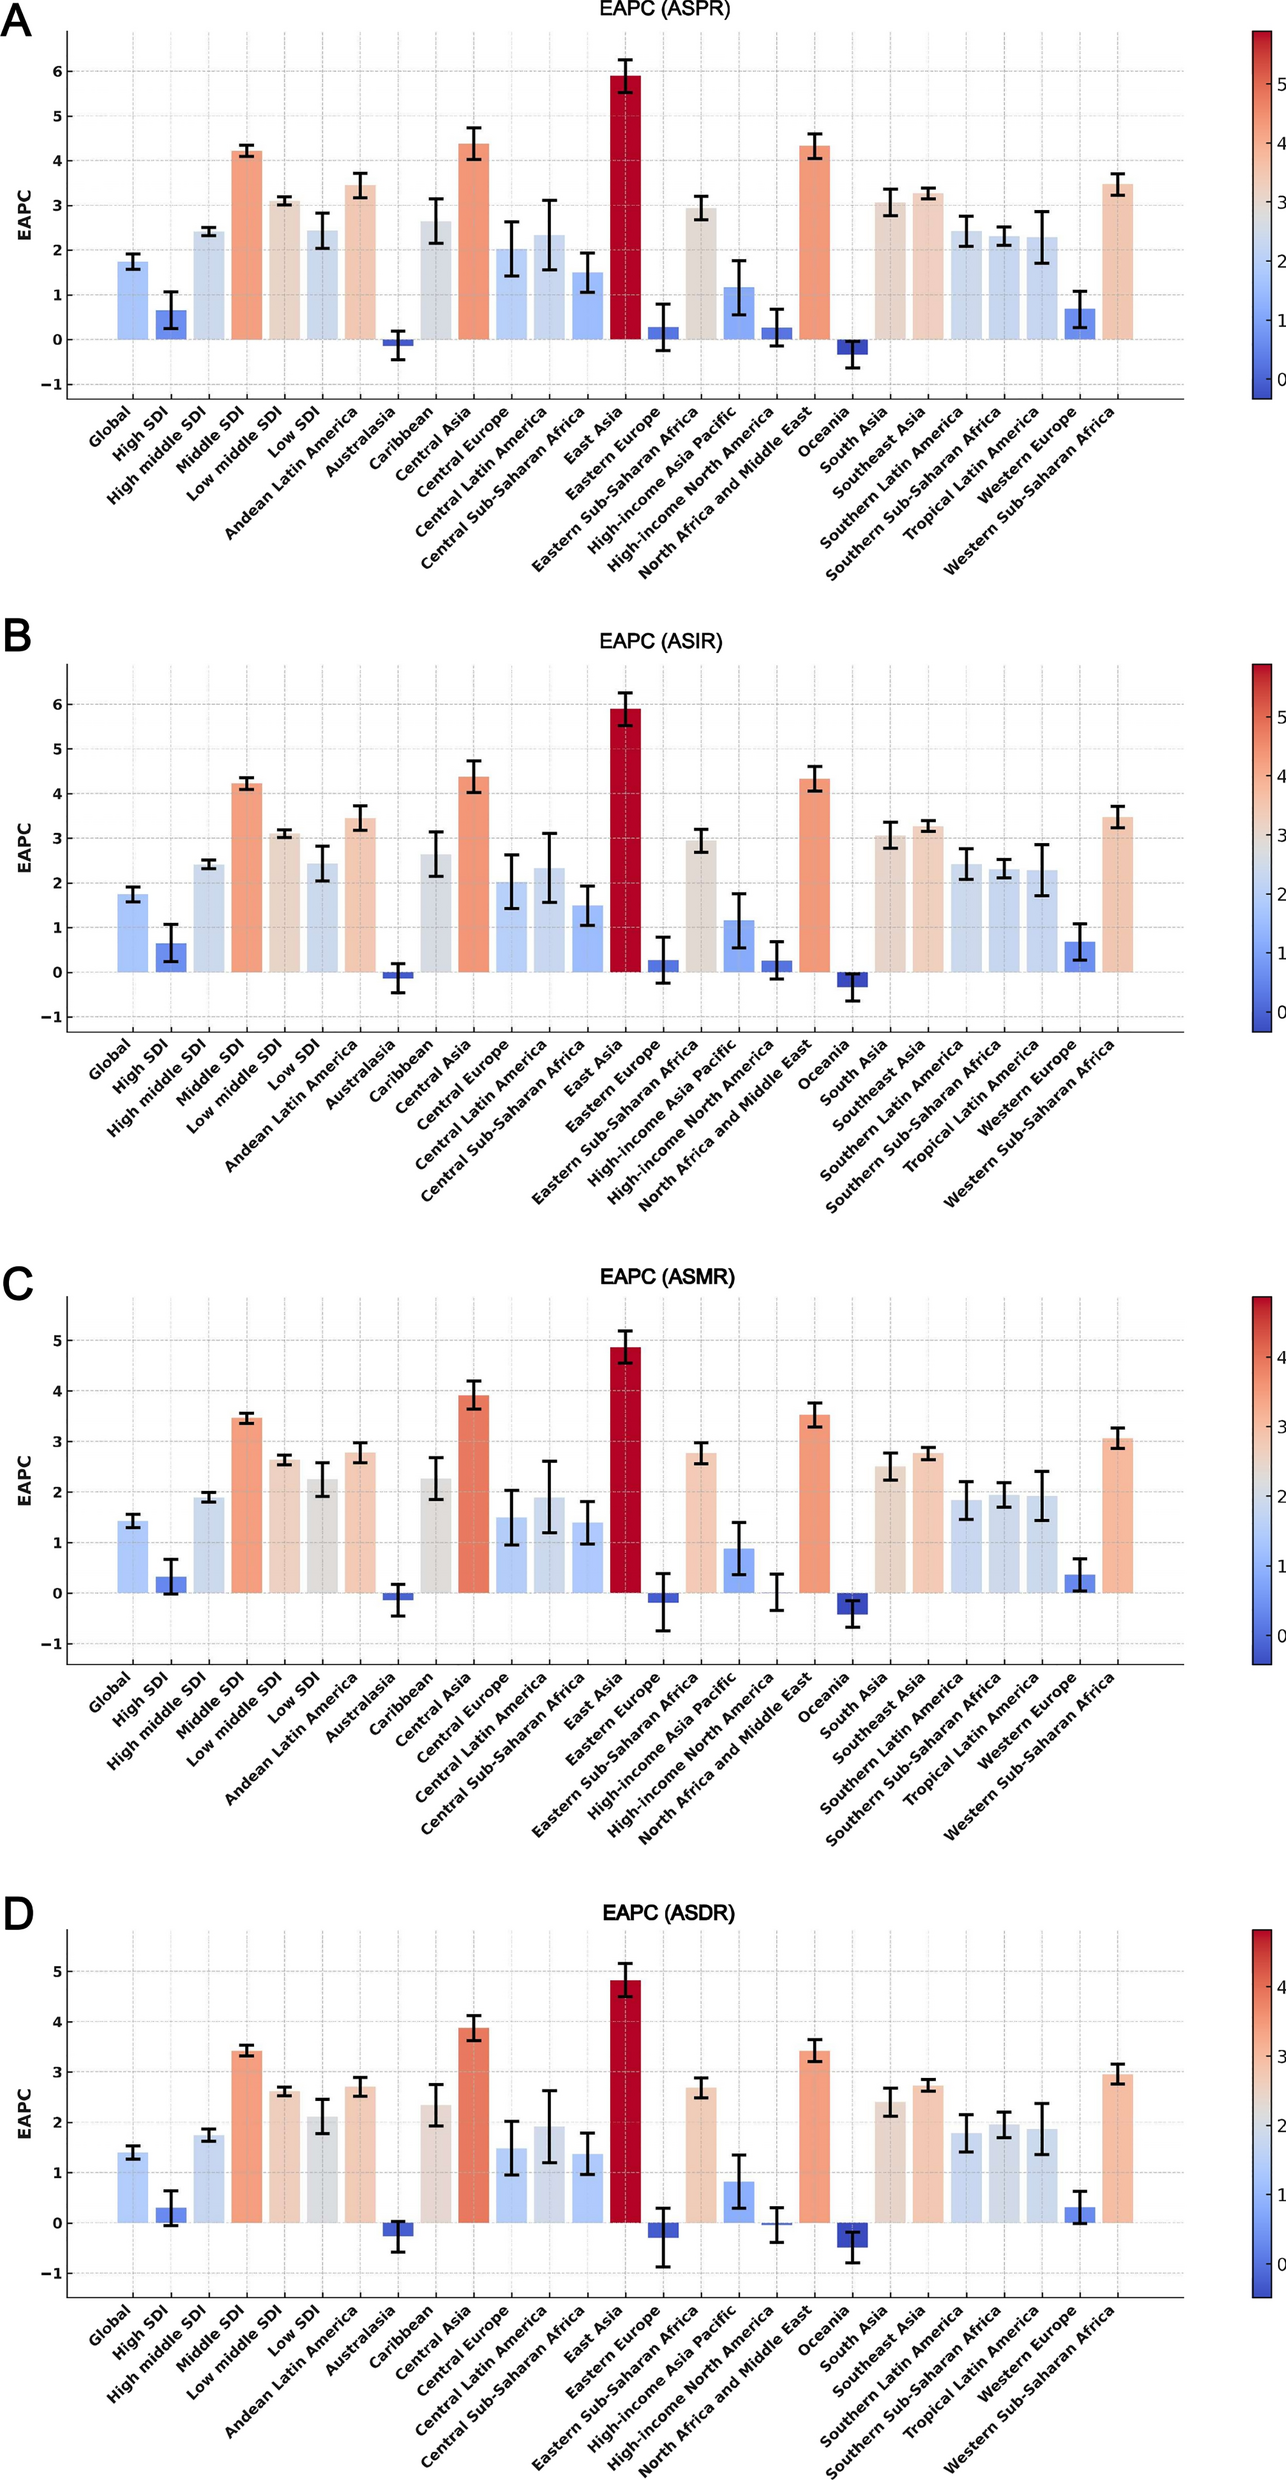
Fig. 1
EAPCs in age-standardised prevalence (A), incidence (B), mortality (C), and DALYs (D) for neuroblastoma and peripheral nervous system tumours, stratified by GBD regions and SDI quintiles, from 1990 to 2021. EAPC Estimated Average Percentage Changes, DALYs Disability-adjusted Life-Years, SDI Socio-demographic Index
Table 1 The age-standardized prevalence rate, number of cases, and EAPC of neuroblastoma and peripheral nervous system tumours among elderly individuals aged 60 and above globally and regionally from 1990 to 2021Global trends by genderBetween 1990 and 2021, the age-standardised prevalence, incidence, mortality, and DALY rates for neuroblastoma and peripheral nervous system tumours among the elderly population showed a marked upward trend for both males and females globally, an even more noticeable rise was seen in males (Fig. 2A–D). Notably, the trends in age-standardised prevalence and incidence were consistent, with males having an EAPC of 2.01 (95% CI 1.85, 2.18) compared to 1.39 (95% CI 1.21, 1.58) for females (Fig. 2A, B, Table 1, Supplementary Table 1). For age-standardised mortality rates, the EAPC for males was 1.69 (1.56, 1.82), while for females, it was 1.08 (95% CI 0.93, 1.24). Similarly, in terms of age-standardised DALY rates, males had an EAPC of 1.62 (95% CI 1.49, 1.75), compared to 1.11 (95% CI 0.97, 1.25) for females (Fig. 2C, D, Supplementary Table 2 and Table 3). Form 1990 to 2021, the disease burden of neuroblastoma and peripheral nervous system tumours among elderly males has consistently been greater than that observed in females.
Fig. 2
Trends in age-standardised prevalence (A), incidence (B), mortality (C), and DALYs rates (D) of neuroblastoma and peripheral nervous system tumours among individuals aged 60 years and older, classified by gender, from 1990 to 2021. ASPR Age-standardized Prevalence Rate, ASIR Age-standardized Incidence Rate, ASMR Age-standardized Mortality Rate, ASDR Age-standardized, DALYs Disability-adjusted Life-Years
Global trends by age groupsGlobally, in 2021, the age-specific prevalence, incidence, and mortality rates of neuroblastoma and peripheral nervous system tumours among the elderly exhibited a gradual increase with advancing age, peaking within the 90–94 age group. The rates for this age group reached 0.23 per 100,000 (95% UI 0.28, 0.17) for prevalence, 0.46 per 100,000 (95% UI 0.56, 0.34) for incidence, and 3.05 per 100,000 (95% UI 3.49, 2.43) for mortality (Fig. 3A–C, Table 2). The number of cases, including prevalence, incidence, and mortality, peaked predominantly within the 65–69 age group, with figures of 41.08 (95% UI 50.04, 30.84), 82.16 (95% UI 100.08, 61.68), and 61.17 (95% UI 70.02, 48.56), respectively. Following this peak, the numbers showed a consistent decline as age increased (Fig. 3A–C). In contrast, the age-specific DALY rate demonstrated a relatively stable trend, with its highest point observed in the 70–74 age group at 3.32 per 100,000 (95% UI 2.74, 3.71). The peak number of DALYs was concentrated in the 60–64 age group, reaching 8766.73 (95% UI 7257.25, 9675.18), and subsequently declined gradually with age (Fig. 3D, Table 2).
Fig. 3
Age distribution of the total number of cases and age-standardised prevalence (A), incidence (B), mortality (C), and DALYs (D) due to neuroblastoma and peripheral nervous system tumours among individuals aged 60 years and older, classified by sex, globally in 2021, with error bars indicating the 95% uncertainty range for case numbers, while the shading represents the 95% uncertainty range for the rates. DALYs, Disability-adjusted Life-Years
Table 2 Age-specific prevalence, incidence, mortality rates, and DALYs, as well as the corresponding case numbers, for elderly individuals across different age groupsGlobal trends by SDI quintilesBetween 1990 and 2021, the age-standardised prevalence, incidence, mortality, and DALY rates for neuroblastoma and peripheral nervous system tumours among the elderly across all SDI regions demonstrated broadly similar trends. Low SDI regions consistently maintained the lowest levels, while all other SDI regions, except for high SDI regions which showed minimal change, exhibited a gradual upward trend. The middle SDI regions experienced the highest growth rate throughout the period (Fig. 4A–D). In terms of age-standardised prevalence and incidence rates, high SDI regions held the highest levels until 2017, after which high-middle SDI regions surpassed them and took the lead. Regarding the rate of increase, middle SDI regions showed the highest EAPC at 4.22 (95% CI 4.09, 4.35), followed by middle-low SDI regions and then low SDI regions (Fig. 4A, B, Table 1, Supplementary Table 1). For age-standardised mortality rates, high SDI regions remained at the highest level until 2014, after which high-middle SDI regions took over. The highest growth rate in age-standardised mortality was observed in middle SDI regions, with an EAPC of 3.46 (95% CI 3.36, 3.56), followed by middle-low SDI regions and low SDI regions (Fig. 4C, Supplementary Table 2). With respect to age-standardised DALY rates, high SDI regions maintained the highest levels until 2013, after which high-middle SDI regions consistently led. The middle SDI regions again displayed the highest growth rate, with an EAPC of 3.42 (95% CI 3.32, 3.53), followed by middle-low SDI regions and low SDI regions (Fig. 4D, Supplementary Table 3).
Fig. 4
Global trends in age-standardised prevalence (A), incidence (B), mortality (C), and DALYs rates (D) from 1990 to 2021, stratified by SDI quintiles. DALYs, Disability-adjusted Life-Years; SDI: Socio-demographic Index
Regional trendsThe GBD regional classification includes 204 countries and territories, grouped into 21 regions [15]. An analysis of the burden of neuroblastoma and peripheral nervous system tumours among the elderly across 21 global regions in 2021 revealed that Central Europe exhibited the highest age-standardized rates for prevalence, incidence, and mortality, recorded at 0.16 per 100,000 (95% UI 0.13, 0.20), 0.32 per 100,000 (95% UI 0.26, 0.40), and 0.21 per 100,000 (95% UI 0.18, 0.25), respectively. Meanwhile, Eastern Europe showed the highest age-standardised DALY rate globally, reaching 4.58 per 100,000 (95% UI 3.91, 5.29) (Fig. 5A, Supplementary Fig. 1A, Supplementary Fig. 2A, Supplementary Fig. 3A, Table 1, Supplementary Tables 1–3). In terms of case numbers, East Asia recorded the highest numbers for prevalence, incidence, mortality, and DALYs in 2021 among the 21 regions, with figures of 399.83 (95% UI 262.84, 522.80), 799.66 (95% UI 525.67, 1045.61), 532.57 (95% UI 367.41, 670.62), and 10,742.81 (95% UI 7,395.77, 13,606.59), respectively (Fig. 5B, Supplementary Figs. 1B, 2B, 3B, Table 1, Supplementary Tables 1–3). Between 1990 and 2021, most regions exhibited an upward trend in age-standardised prevalence and incidence rates, except for Australasia and Oceania, where no significant increases were observed. East Asia demonstrated the fastest growth, with EAPCs of 5.89 (95% CI 5.52, 6.25) for both prevalence and incidence rates. Similarly, in terms of age-standardised mortality and DALY rates, most regions showed a marked increase, with East Asia again exhibiting the highest growth. The EAPCs for age-standardised mortality and DALY rates in East Asia were 4.86 (95% CI 4.55, 5.18) and 4.82 (95% CI 4.49, 5.15), respectively (Fig. 1A–D).
Fig. 5
Age-standardised prevalence rates (A) and prevalent cases (B) of neuroblastoma and peripheral nervous system tumours among people aged 60 and above across the 21 regions of the Global Burden of Disease (GBD) from 1990 to 2021
National trendsOn a national scale, in 2021, the Republic of Estonia recorded the highest age-standardised prevalence, incidence, and mortality rates globally, at 0.42 per 100,000 (95% UI 0.28, 0.63), 0.85 per 100,000 (95% UI 0.56, 1.25), and 0.51 per 100,000 (95% UI 0.34, 0.72), respectively. In contrast, the Republic of Croatia had the highest age-standardised DALY rate at 9.14 per 100,000 (95% UI 6.36, 12.73) (Fig. 6A, Supplementary Figs. 4A, 5A, Supplementary Tables 4–8). In 2021, the People's Republic of China reported the highest numbers for prevalence, incidence, mortality, and DALYs among the 204 countries studied, with figures of 389.19 (253.48, 511.35), 778.39 (95% UI 506.97, 1022.69), 518.98 (95% UI 354.83, 656.37), and 10,464.64 (95% UI 7,140.82, 13,312.97), respectively (Fig. 6B, Supplementary Figs. 4B, 5B, 6B, Supplementary Tables 4–8). Examining trends from 1990 to 2021 across 204 countries, more than 90% exhibited an increasing pattern in age-standardised prevalence and incidence rates. Georgia exhibited the highest growth rate globally, with EAPCs for age-standardised prevalence and incidence rates of 13.35 (95% CI 11.93, 14.80). In terms of age-standardised mortality and DALY rates, over 85% of countries demonstrated an increasing trend, with Georgia again showing the highest growth. The EAPCs for age-standardised mortality and DALY rates in Georgia were 13.34 (95% UI 11.89, 14.80) and 13.26 (95% CI 11.81, 14.73), respectively (Fig. 6C, Supplementary Figs. 4C, 5C, 6C).
Fig. 6
The global prevalence of neuroblastoma and peripheral nervous system tumours among individuals aged 60 years and older across 204 countries and territories: age-standardised prevalence rate in 2021 (A), number of prevalent cases in 2021 (B), and the EAPC in prevalence from 1990 to 2021 (C). EAPC, Estimated Average Percentage Change
Comments (0)