
Remember me


This study was registered with the University Hospital Medical Information Network Clinical Trials Registry (UMIN R000061898 registered on July 21, 2024). Given the nature of the study, the Fukushima Medical University Hospital Institutional Review Board waived the requirement for approval. However, verbal informed consent for participation was obtained from all the participants. Twenty-eight healthy volunteers, who had no visual disorders in previous biannual medical examinations, were recruited from consultant and resident anesthesiologists in this institute for the study. Individuals who use corrective eyewear including contact lens were included. However, ones who use sunglasses in their daily life were excluded.
Experimental environmentThe study was conducted in a high-illuminance environment simulating outdoor conditions to ensure consistent brightness for all participants. Maintaining such consistency is difficult in natural outdoor settings due to variations in time and weather. Given that daylight on a clear day typically ranges from around 50,000 to 100,000 lx, the goal was to replicate outdoor conditions using commercially available floodlights. Additionally, to simulate screen smudges, artificial sweat (1% emulsified saline solution) was used to recreate dirt on the screen.
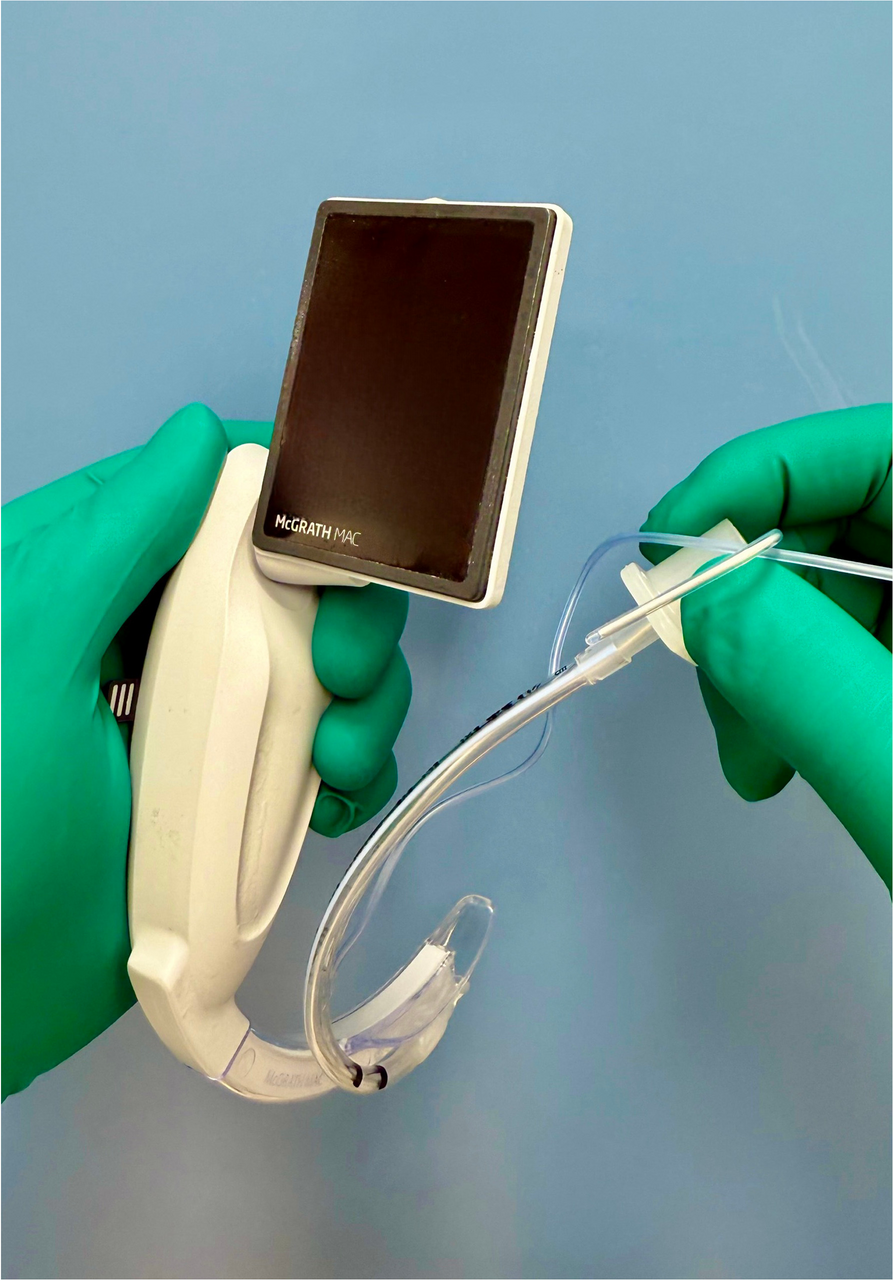
The experiment was performed in a room of the hospital, which had no windows and was blocked from sunlight. The usual luminous intensity provided by the ceiling light ranged from 300 to 500 lx. To simulate outdoor conditions on a typical clear day with reproducibility, high-illuminance intensity (50,000–60,000 lx) was created on the monitor screen of the video laryngoscope (McGRATH MAC, Covidien Japan, Japan) using commercially available floodlights (B0C2T3JNV5, Aicdas, China). Briefly, with 5 floodlights, each capable of emitting a luminous flux of 950,000 lumens, attached to a stanchion using double clips, a high-illuminance environment without shadows on the monitor screen was created, and the illuminance intensity was adjusted to 50,000–60,000 lx using an illuminometer (VLT113, C-Timvasion, China). Finally, the set of floodlights was placed approximately 2.5 m away from the monitor screen of the laryngoscope. Regarding simulated screen smudges, the screen was swiped two or three times with a sheet of gauze soaked in artificial sweat and then dried using a hair dryer. While sweat primarily consists of NaCl, a 1% emulsified saline solution was used to replicate dirt on the screen from finger marks containing sebum.
The object of evaluation for visibilityAn adult patient upper body airway simulator (Ambu® Airway Management Trainer, Ambu A/S, Denmark), was used for evaluation for visibility. The laryngoscope blade (MacGrath disposable blade size 3) was fixed into position to visualize the larynx using a retort stand and a clamp [5] so that the same fixed laryngeal exposure. In this condition, screen smudges were made by the previously mentioned procedure. These smudges were designed to simulate those occurring during daily use, and it was confirmed that the screen visibility was not impaired by this level of smudging under normal luminous intensity.
Experimental protocolConfirmation of light adaptationFirst, a warning was issued against directly viewing the floodlights during the examination. If a participant inadvertently looked at the floodlights, they were excluded from the study. To allow their eyes to acclimate to the brightness, participants were exposed to conditions of 50,000–60,000 lx for at least 1 min. To confirm light adaptation, participants were asked to read aloud large letters from a newspaper at a distance of 30–40 cm. If a participant was unable to read the letters, it was determined that they had not adapted to the high-illuminance environment, and they were excluded from the study.
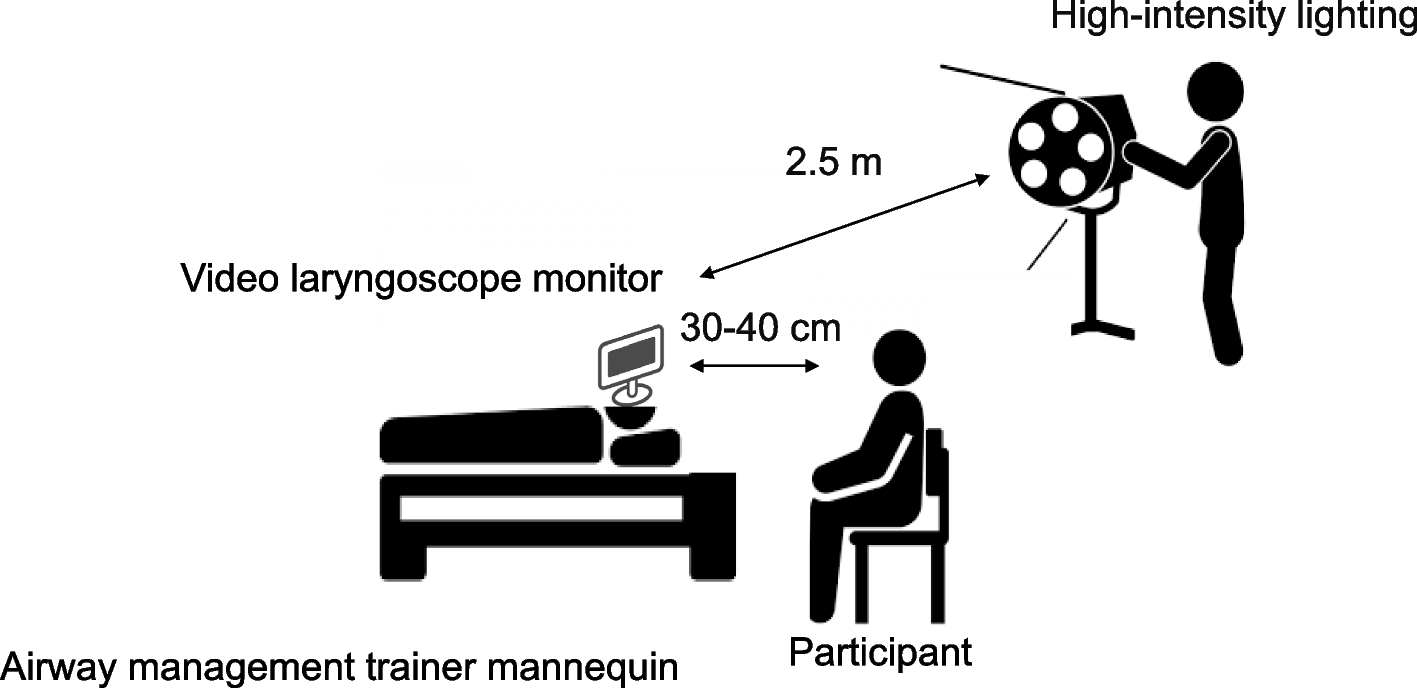
Preparation for experimental settings (Fig. 1 ) Fig. 1
Experimental setting. The illuminance intensity was adjusted to 50,000–60,000 lx using five floodlights. The set of floodlights was placed approximately 2.5 m away from the monitor screen of the laryngoscope. The participants evaluated the screen visibility at a distance of 30–40 cm
Participants evaluated the screen visibility at a distance of 30–40 cm, representing the typical distance between the screen and the operator during routine practice. Specifically, they were asked to give a score using a visual analog scale (VAS) (0–100 mm) to evaluate the visibility of the larynx displayed on the screen. In this study, a VAS of 0 indicated no visibility of the larynx, while a VAS of 100 represented perfect visibility of the larynx.
Preliminary experiment (Fig. 2 ) Fig. 2
Experimental protocol. The experimental protocol consisted of two parts. The first part was a preliminary study to confirm whether the screen visibility on the video laryngoscope was impaired under a high-illuminance environment. Participants evaluated the visibility of the screen on the video laryngoscope under both high and usual luminance intensities. The second part was the main experiment to investigate whether each intervention could improve screen visibility on the video laryngoscope under a high-illuminance environment
Screen visibility on the video laryngoscope was assessed to determine whether it was impaired under high-illuminance conditions. During the evaluation, participants were instructed to view the screen while avoiding direct reflections from the floodlights. The position where each participant experienced the worst visibility was identified, and they were asked to maintain this position for all subsequent evaluations. However, it was confirmed that this worst viewing position remained stable even when the viewing angle varied slightly. This was crucial because later evaluations involved wearing and removing sunglasses.
To ensure consistency, adjustments were made by changing the monitor screen’s angle while keeping the typical distance between the screen and the operator. The VAS was assessed by having participants indicate a point on the VAS sheet as directed by the examiner, ensuring their head position remained stable. After this evaluation, the floodlights were turned off. Visibility was then reassessed under normal lighting conditions 1 min later. To confirm dark adaptation, participants were asked to read large newspaper letters placed on the monitor screen. This step was conducted to reconfirm that high-illuminance conditions impaired screen visibility on the video laryngoscope.
In a real outdoor setting on a sunny day, the overall brightness makes it difficult to see the video laryngoscope screen, regardless of the viewing angle, even if sunlight is not directly reflected. However, in the artificial setup simulating outdoor brightness, the bright area created by the floodlights was limited. As a result, visibility worsened only within a specific range of viewing angles. Therefore, the worst viewing position within the typical distance between the screen and the operator during routine use was selected.
Main experiment (Fig. 2 )In a fixed order sequence comprising viewing with the naked eye, wearing sunglasses, cleaning the screen without wearing sunglasses, and cleaning the screen while wearing sunglasses, the main experiment to evaluate visibility with each intervention was conducted. Between each intervention, confirmation of light adaptation was performed using the naked eye as mentioned above because the effects of light adaptation might be compromised, especially after any intervention, including wearing sunglasses. Blinding each intervention was difficult, primarily due to the observable changes in screen condition after cleaning. Consequently, the order of interventions was not randomized. Initially, visibility was evaluated with the naked eye. In cases where participants wore glasses, the status of wearing glasses was considered as “naked eyes.” Subsequently, visibility was assessed with wearing sunglasses. A pair of polarized sunglasses (B0C6QYW331, OSCE Japan, Miyazaki, Japan), with no distinctive features and readily available, was used as the sunglass intervention. The functionality of the polarized lenses was confirmed using the included polarization test sheet, which contains images or text that become visible only when viewed through polarized lenses. In cases where participants wore glasses, they were asked to wear the sunglasses over their glasses. Following this evaluation, participants were instructed to remove the sunglasses. The monitor screen was then cleaned with a sheet of disinfecting wipes (Mikrozid universal wipes premium, Maruishi Pharmaceutical, Co., Ltd., Japan), and any remaining cleaning agent was wiped away with a sheet of dry tissue cloth (KimWipes, Kimberly-Clark, Irvine, USA). Under this condition, visibility was reassessed with the naked eye. Finally, visibility was reevaluated while wearing sunglasses.
Sample size calculationIn this study, the VAS scores were treated as normally distributed continuous variables for the purpose of sample size calculation. Consequently, A paired t-test followed by Bonferroni’s correction was deemed appropriate to determine the required sample size. For the calculation, a difference of 20 mm with a common standard deviation of 20 mm was assumed for each comparison between interventions. The power analysis indicated that 22 volunteers would be required to achieve a statistical power of 0.95 with a type I error probability of 0.0083, where a type I error probability of 0.05 was adjusted for six comparisons using a two-tailed test. Ultimately, 28 volunteers were recruited to account for potential variations in estimation.
Statistical analysisThe participant characteristics of the participants, including age, sex, years of clinical experience, and the use of corrective eyewear (including contact lenses), were summarized using descriptive statistics. All data were presented using the mean and standard deviation (SD) for normally distributed data, and the median and interquartile range (IQR) for non-normally distributed data, or as the number of participants. The VAS scores for visibility were presented as box plots, with scatter plots of individual values displayed alongside and assessed for their normality using Kolmogorov–Smirnov test. When a normal distribution was confirmed, to perform simple comparisons between and among the interventions, the paired t-test or the repeated measurement analysis of variance is followed by the paired t-test with the Bonferroni’s correction. When the null hypothesis for a normal distribution was rejected, the Wilcoxon signed-rank test or the Friedman test followed by the Wilcoxon signed-rank test with the Bonferroni’s correction. Analyses were computed using EZR (Saitama Medical Center, Jichi Medical University, Saitama, Japan). [6] EZR is a user-friendly interface for R (the R Foundation for Statistical Computing, Vienna, Austria). For all analyses, a significance level of P < 0.05 was considered as the threshold for statistical significance.
Comments (0)