Study design
The PES was a nationwide cross-sectional survey in Japan, using a self-administered questionnaire administered to cancer patients in 2019. For the main survey, patients diagnosed in 2016 were recruited; detailed methods and results have been reported elsewhere [14]. In addition, for comparison purposes, patients diagnosed with stage III-IV diseases in 2013 were surveyed from the same participating hospitals and thus analyzed in this study.
This study was approved by the Institutional Review Board of the National Cancer Center (2018–218). Informed consent was obtained from all the participants at the beginning of the survey.
Source population
We obtained samples from the Hospital-Based Cancer Registry (HBCR) as the source population. The HBCR is a mandatory cancer case-reporting system for all designated cancer care hospitals and many non-designated cancer care hospitals in Japan. The designated cancer care hospitals are selected by each prefecture and designated by the Ministry of Health, Labour, and Welfare. The HBCR aims to collect detailed cancer information, such as basic demographic information, tumor location, histological information, cancer treatment, and other information based on standardized rules. Compared to the national incidence statistics, the HBCR accounts for approximately 70% of all patients with cancer in Japan [15]. The HBCR is leveraged by hospitals and government authorities to improve the quality of cancer care and inform cancer control policies through data analysis. We used the HBCR as the source population because it can be de-identified at each facility, and more detailed cancer information was collected, such as identifying rare cancers based on the ICD-O-3.1 code.
Sampling
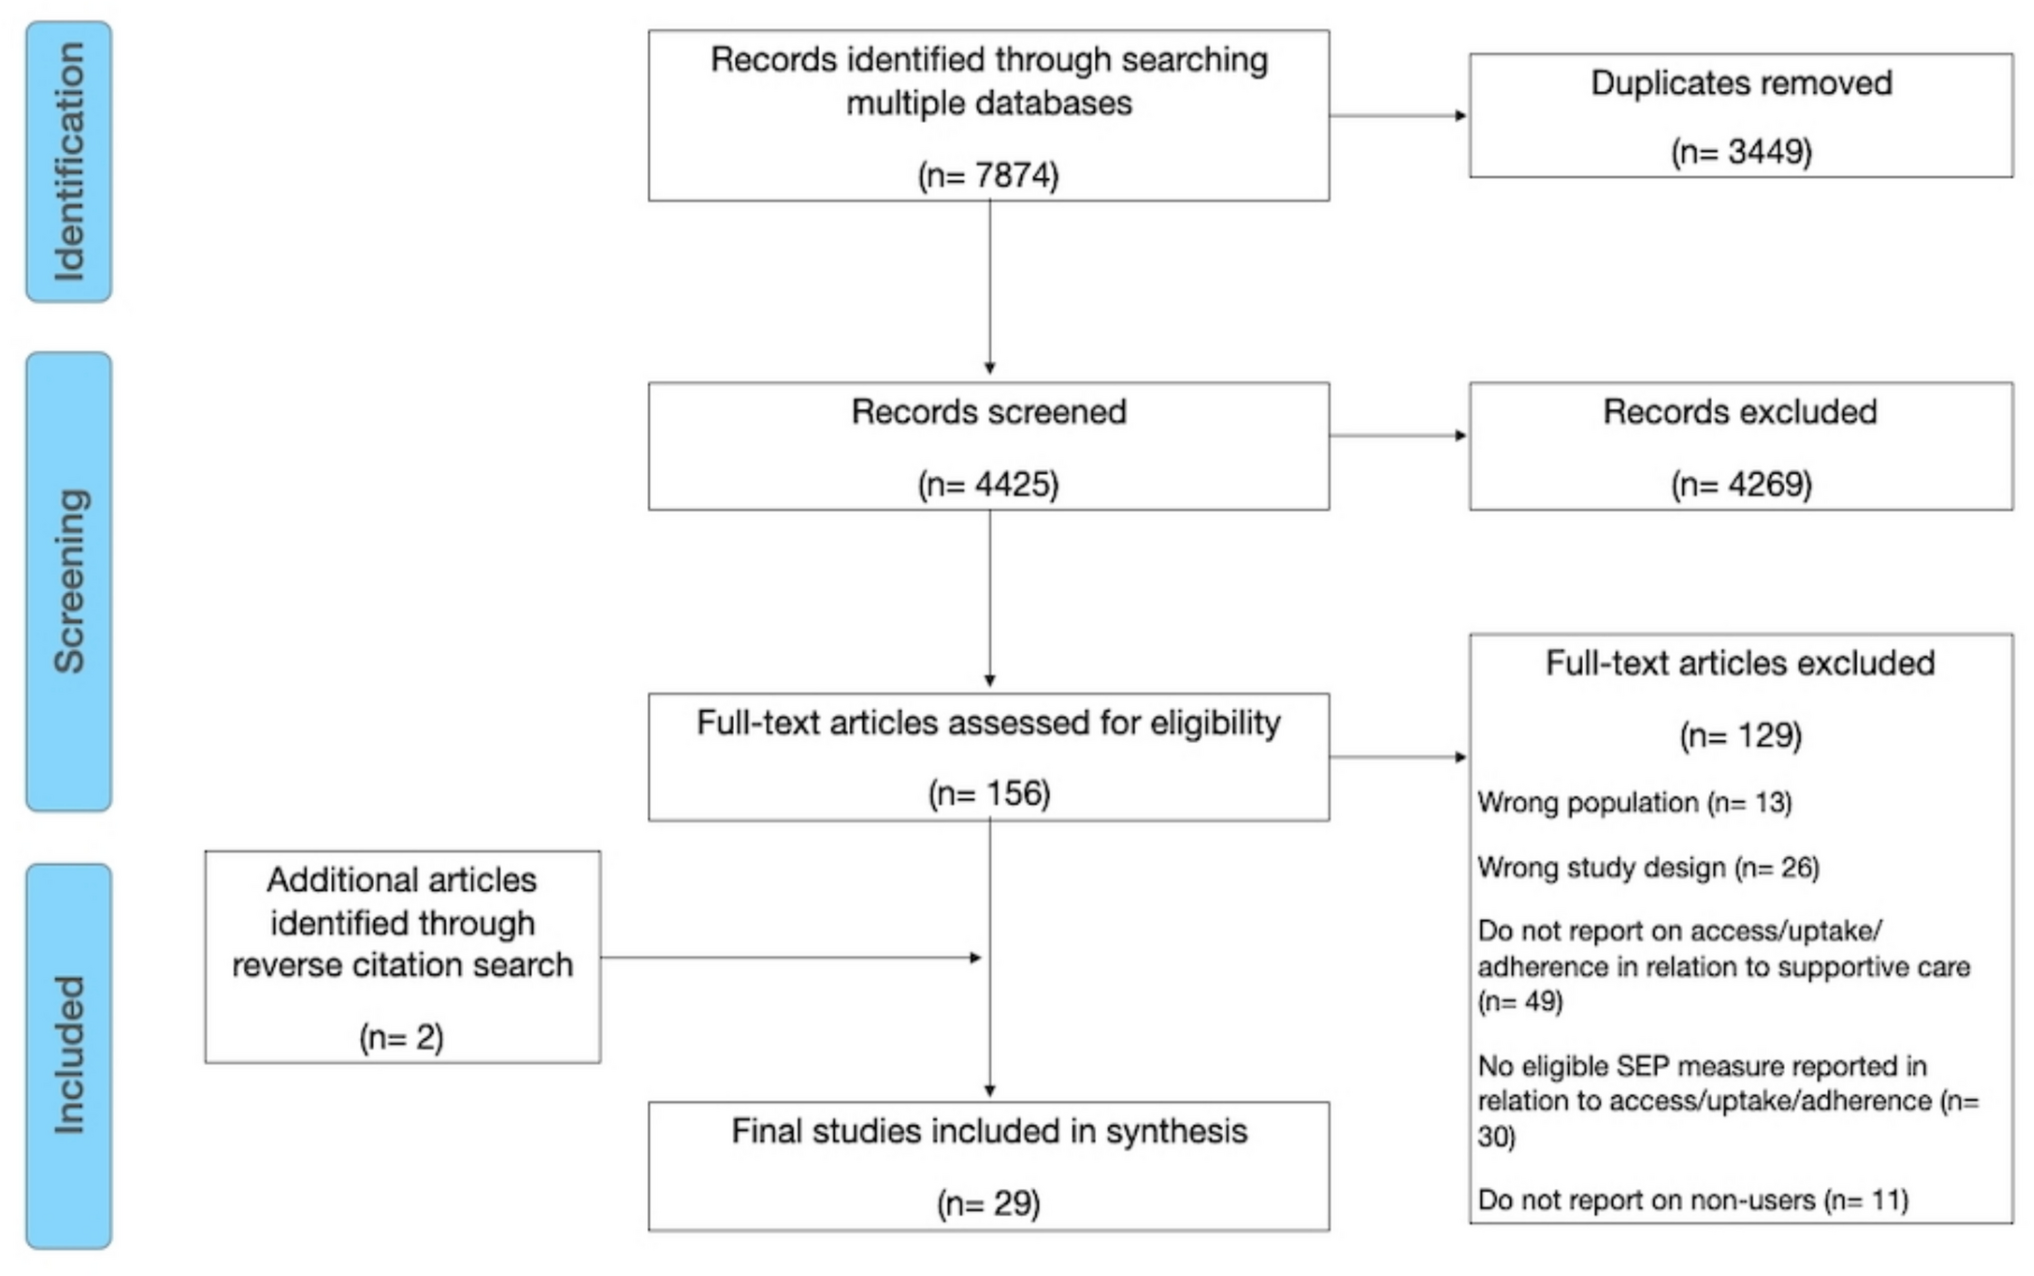
Participants in the PES were randomly selected from patients registered in the HBCR. The PES utilized stratified two-stage random sampling among all the cancer patients registered in the HBCR. First, hospitals from each prefecture were selected. The number of selected hospitals varied depending on the type of accreditation status of the designated cancer hospitals. Then, we randomly selected cancer patients who were 19 years old or older from the selected hospitals at the time of diagnosis. Participants in the PES were stratified into four groups before random selection, focusing on age, rare cancer types, and cancer stage [16]. This study specifically analyzed patients with advanced-stage cancer (stage III-IV) diagnosed in 2013 and 2016. While other stratified groups were included for broader survey purposes, only patients with advanced cancer were randomly selected for the current analysis. Questionnaires were sent to the selected patients via mail. Participants who consented to participate in the study returned their anonymized answers (Supplementary Fig. 1).
Study participants
We selected all patients diagnosed with stage III-IV cancer in 2013 and 2016 from the PES. Although the main body of this survey targeted patients diagnosed 3 years prior to the survey, it also sampled patients diagnosed 6 years prior to elucidate the views of patients with longer-term experiences post-diagnosis. Subsequently, we divided the patients into two groups: those diagnosed with stage III-IV cancer in 2016 (referred to as the “newer diagnosis group,” diagnosed with advanced cancer 3 years prior) and those diagnosed with stage III-IV cancer in 2013 (referred to as the “earlier diagnosis group,” diagnosed with advanced cancer 6 years prior). In this study, we focused on patients with stage III-IV cancer because patients with advanced-stage cancer tend to continue treatment for longer periods.
Questionnaire and analysis variables
The PES questionnaire has been illustrated in previous literature [14]. We defined outcome variables for each question based on the following rule. As for questions with the five Likert-scale choices (Q13, Q18, Q24, Q28, Q33, and Q34), we calculated the percentage of positive responses combining “Agree strongly” and “Agree.” To avoid the ceiling effect, we treated the “Agree somewhat” response as nonpositive. For Q8 and Q9, we calculated the percentage of less than 1 month by diagnosis or starting treatment by combining the response “Less than 2 weeks” and “More than 2 weeks and less than 1 month.” For Q31 and Q32, the responses “very familiar” and “somewhat familiar” were treated as outcome responses. For questions allowing multiple responses, we calculated the percentage excluding those who chose the specific response (“None of the above happened” for Q17, “None of above” for Q25, and “I did not experience any of the above” for Q27). For other questions permitting a single response, we determined the proportion of specific replies as outcome responses (“I talked to someone” for Q10; “Yes” for Q11, Q12, Q16, Q19, Q22, Q23, Q26, Q29, and Q30; “Yes, I was able to” for Q20). Finally, we calculated the mean and standard deviation for these questions using the global scale, Q21.
Statistical analysis
We developed a set of sample weights based on the sampling design and used them to estimate the distributions of patient experiences in the representative population. Operationally, the weights for each patient were calculated as the inverse of the probability of being sampled, and non-response was incorporated by assuming that all non-respondents occurred randomly.
First, we compared the experiences of patients diagnosed in 2013 and 2016, including patient and proxy responses. We then performed a detailed analysis comparing patient and proxy responses, focusing on the responses of the patients themselves. The questionnaire items covered aspects before, during, and after treatment. We analyzed participants’ responses to each question (Q8–Q13, Q16–Q34). We excluded the results of Q14 and Q15 because of their small sample sizes.
We calculated the frequency (proportion) for categorical variables and the mean (standard deviation) or median (interquartile range) for continuous variables. To compare the characteristics of the two groups, we conducted Rao and Scott corrections for the chi-square test [17]. Moreover, Welch’s t-test was conducted to compare the means of the two groups [18]. Although the two groups had different source populations (patients with cancer registered in 2016 and 2013), we assumed that they had similar patient backgrounds. In addition, the same survey method was used to obtain samples for each year of diagnosis. All statistical analyses were performed using R version 3.6.1 (R Core Team, Vienna, Austria), RStudio 2023.12.1 (RStudio Team, Boston, MA, USA), and Stata 17.1 (Stata Corporation, College Station, TX, USA) [19,20,21]. Statistical significance was set at P < 0.05.


Comments (0)