
Remember me


To identify the immediate role of CTCF in erythroid cell genome features and related erythroid gene expression, we utilized the previously established CTCF-AID knockin HUDEP-2 cell model [17] by integrating the miniAID-mClover3 cassette into the endogenous CTCF locus, accompanied by stable expression of the plant E3 ubiquitin ligase Ostir1 (Fig. 1a). To validate the major conclusion in an alternative model, we also successfully established a new CTCF-AID system in erythroleukemia cell line, HEL. In the presence of the plant hormone auxin or indole-3-acetic acid (IAA), OsTIR1 can quickly mediate the ubiquitination of the CTCF fusion protein and further degradation by the proteasome system. We confirmed that the CTCF protein was efficiently depleted after treatment with IAA for 24 h, accompanied by a reduction in the Clover3 fluorescence signal in both CTCF-AID cell lines (Fig. 1b and c; Additional file 1: Fig. S1a). The CTCF mRNA level was slightly increased upon IAA treatment (Additional file 1: Fig. S1b), suggesting a feedback or compensatory effect after CTCF protein degradation. Moreover, the protein degradation was reversible after removing the IAA from the culture medium (Additional file 1: Fig. S1a).
Fig. 1
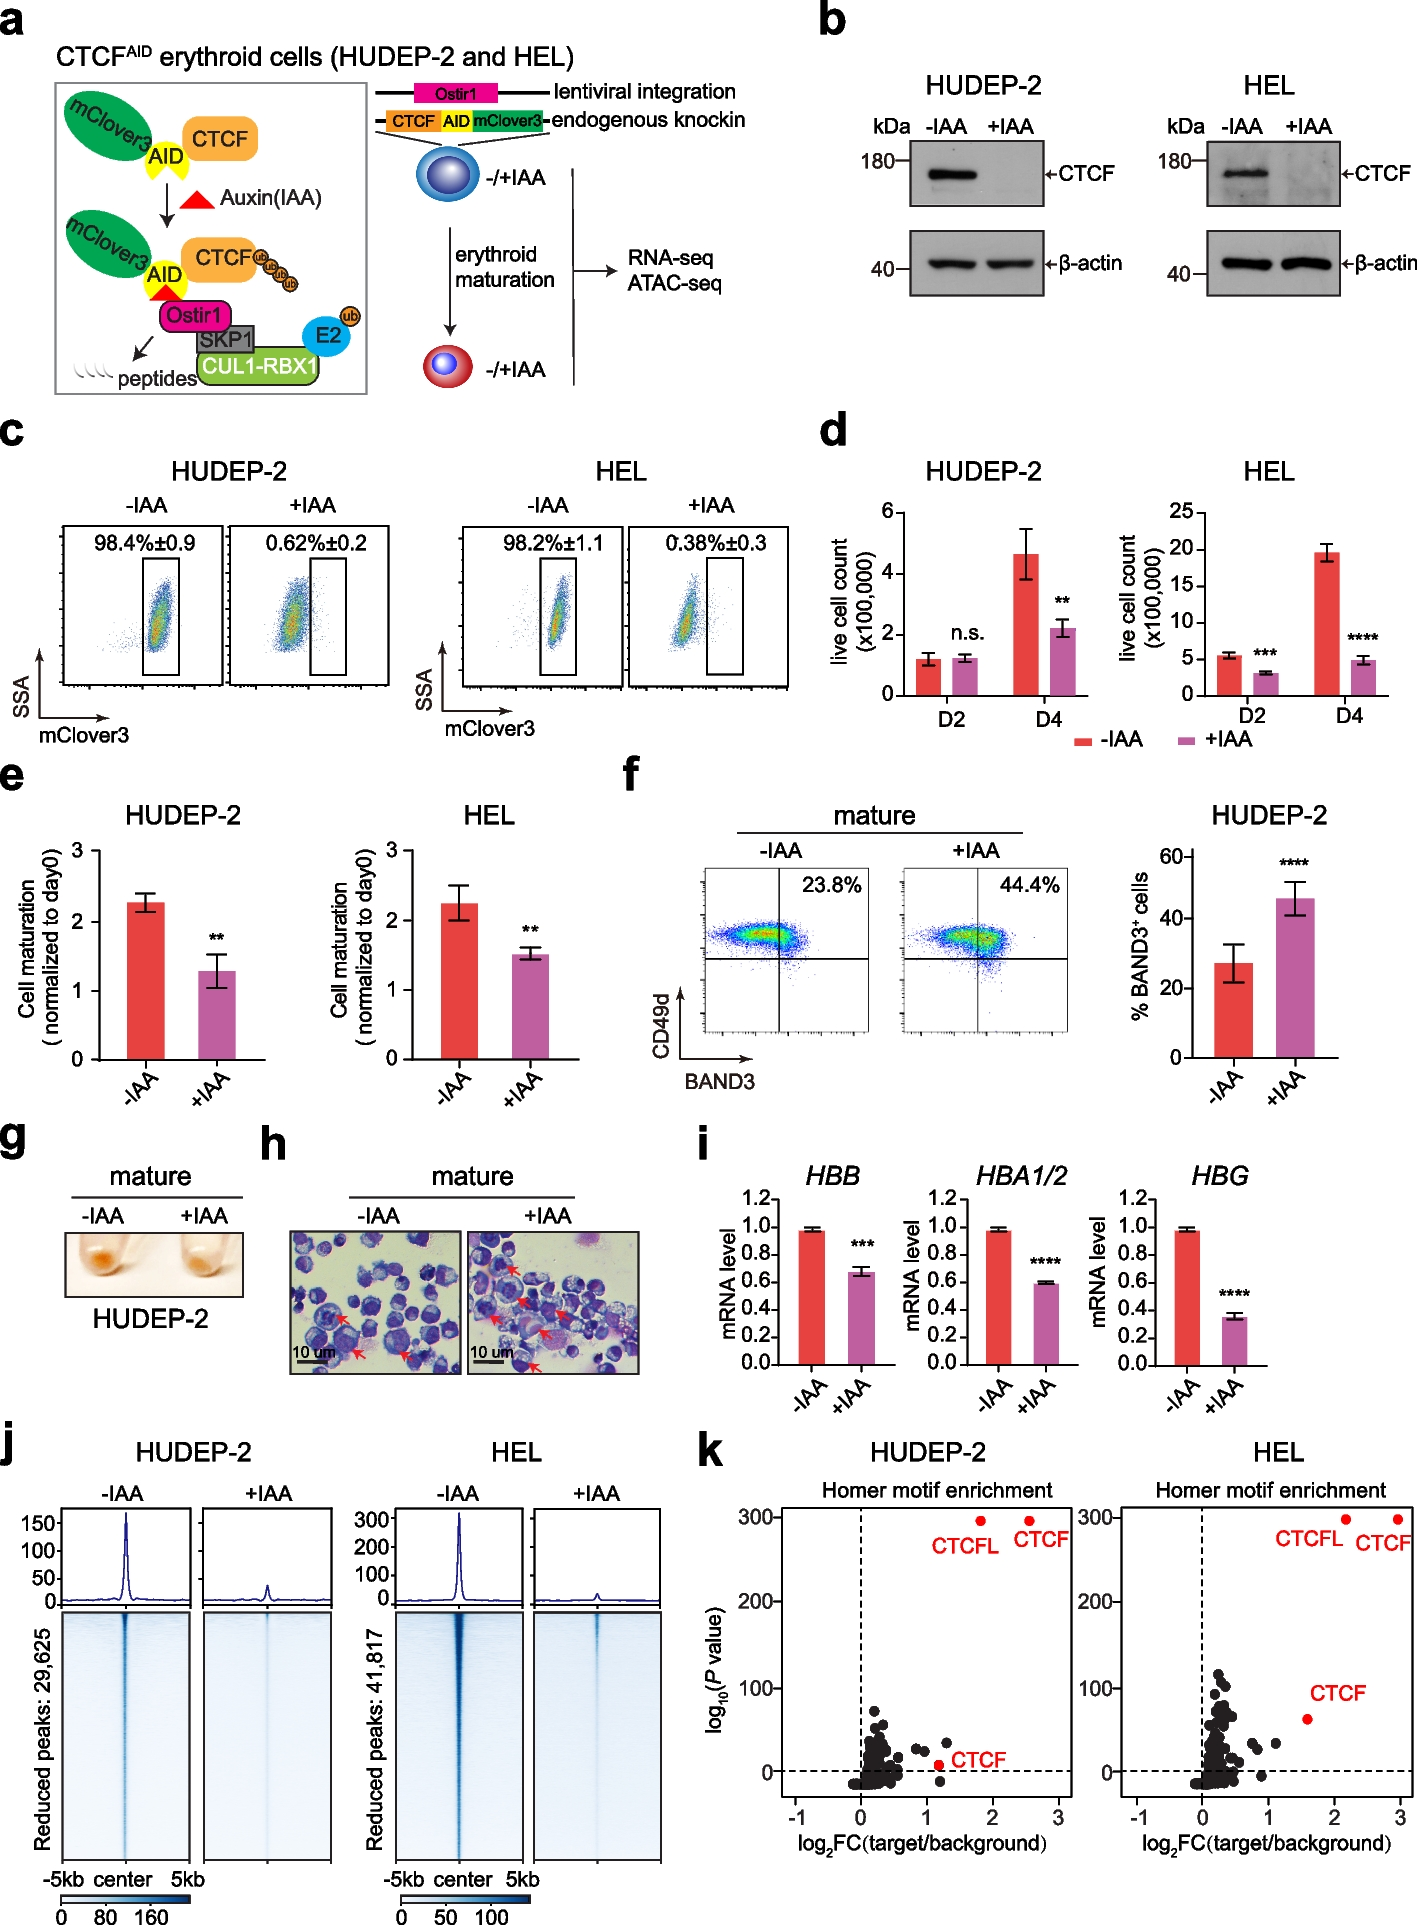
CTCF is indispensable for the proliferation and maturation of erythroid progenitor cells. a Schematic diagram of the auxin-inducible degron model for tagging endogenous CTCF in HUDEP-2 and HEL cells. The miniAID-mClover3 cassette was electroporated to knockin both endogenous alleles in frame with CTCF, and a lentivirus expressing plant OsTIR1 was transduced into HUDEP-2 and HEL cells (right panel). As shown in the left panel, in the presence of auxin (IAA), the plant E3 ligase adaptor OsTIR1 combines with Skip1/Cullin scaffold components to form the functional SCF-OsTIR1 E3 ubiquitin ligase complex, which rapidly ubiquitinates and degrades the miniAID-mClover3 fusion protein. b Western plots showing CTCF expression in HUDEP-2 and HEL cell lines without IAA treatment and with IAA treatment for 24 h in an expansion medium. CTCF was detected with anti-CTCF antibodies. β-actin was used as a loading control. c Flow cytometry plots showing CTCF-AID-mClover3 expression without and with IAA treatment for 24 h in the HUDEP-2 and HEL cell lines. The data shown are the means ± SEMs from three independent experiments. d Proliferation of HUDEP-2 and HEL cells on day 2 and day 4 after induction of erythroid maturation without and with IAA treatment for 24 h. The data shown are the means ± SEMs from three independent experiments. The “n.s.” represents nonsignificant; ** P < 0.01, *** P < 0.001, **** P < 0.0001, unpaired Student’s t test. e HUDEP-2 and HEL cell maturation after induction of CTCF-AID degradation with 500 µM IAA for 24 h. The data are presented as the means ± SEMs from three independent experiments. ** P < 0.01, unpaired Student’s t test. f Flow cytometry plots showing BAND3 and CD49d expression in HUDEP-2 cells on day 2 after induction of erythroid maturation without and with IAA treatment for 24 h. The graph on the right shows the quantified BAND3+ cell percentage. The data are presented as the means ± SEMs from three independent experiments. **** P < 0.0001, unpaired Student’s t test. g Images of HUDEP-2 cell pellets after 2 days of induced erythroid maturation showing hemoglobinization without and with IAA treatment for 24 h. h May-Grünwald-Giemsa-stained HUEDP-2 cells after erythroid maturation on day 4 without and with IAA treatment for 24 h. Red arrows denote immature erythroblasts. Scale bar: 10 µm. i HBB, HBA1/2, and HBG mRNA levels in HUDEP-2 erythroid maturation on day 4 without and with IAA treatment. The y-axis shows the mRNA level relative to β-actin. ** P < 0.01, *** P < 0.001, **** P < 0.0001, unpaired Student’s t test. j Genomic heatmap centered at reproducible CTCF-reduced peaks summits by CTCF ChIP-seq data from CTCF-AID cells before and after IAA treatment for 24 h (29,625 peaks in HUDEP-2 cells and 41,817 in HEL cells). k Homer motif enrichment analysis revealed that the CTCF and CTCFL motifs were the top enriched transcription factor motifs for the CTCF-reduced regions in both HUDEP-2 and HEL cells. The enriched CTCF motifs are shown as red circles
Next, we studied the effects of erythroid progenitor cell proliferation and maturation. Consistent with previous findings that CTCF functions as an essential gene, we observed that the loss of CTCF protein over 48 and 72 h significantly blocked the cell growth of both HUDEP-2 and HEL cells. However, no severe impact on cell growth was observed within 24 h (Fig. 1d; Additional file 1: Fig. S1c). Consistently, acute CTCF loss did not result in significant apoptosis in either HUDEP-2 or HEL cells within 24 h of IAA treatment (Additional file 1: Fig. S1d). Therefore, we reasoned that utilizing the 24 h IAA treatment regimen would be optimal for subsequent mechanistic studies to reduce secondary effects.
The HUDEP-2 and HEL cell lines can be induced to undergo terminal maturation after treatment with EPO and hemin, respectively. Although the cells treated with IAA exhibited no difference in expansion conditions within 24 h, the loss of CTCF inhibited cell growth during erythroid maturation (Fig. 1e). Moreover, the CTCF depletion also increased the level of the late erythroid maturation cell surface marker BAND3, as suggested by the increase in BAND3-positive erythroid cell number from 25 to 45% in HUDEP-2 line, which was accompanied by less hemoglobinization and larger cell size (Fig. 1f–h). Similarly, we observed that CTCF depletion in HEL cell line decreased the CD71 expression after hemin-induced maturation (Additional file 1: Fig. S1e). To further explore the effect of CTCF loss on globin expression, we measured both adult and fetal globin expressions with and without CTCF. We found that CTCF is required for the programmed expression of both adult and fetal globin genes in these two cell lines (Fig. 1i, Additional file 1: Fig. S1f). These results suggest that CTCF is required for normal erythroid proliferation and maturation in erythroid progenitors.
To examine the effects of CTCF depletion on the occupancy of CTCF at genomic loci, we performed ChIP-seq to identify the CTCF binding profile in CTCF-AID HUDEP-2 and HEL cells before and after IAA treatment for 24 h. Principal component analysis (PCA) confirmed that before and after IAA treatment groups were separated from each other, suggesting a global dynamic change in CTCF occupancy (Additional file 1: Fig. S1g). Indeed, a global reduction of CTCF occupancy was observed in both HUDEP-2 and HEL cells after the 24 h of IAA treatment, with a proportion of retained regions (Fig. 1j; Additional file 1: Fig. S1h). Moreover, the Homer motif analysis revealed that the CTCF consensus binding motif was the top enriched TF motif for the CTCF-reduced regions (Fig. 1k). Collectively, these results confirmed the efficient elimination of chromatin-bound CTCF in the erythroid progenitor cells.
CTCF depletion leads to substantial loss of chromatin accessibility in erythroid progenitor cellsGiven that CTCF directly binds to DNA with consensus motifs and that the immediate loss of CTCF may change the local chromatin environment, we hypothesized that CTCF maintains appropriate chromatin accessibility in erythroid progenitors. To test this hypothesis, a genome-wide ATAC-seq was performed in both HUDEP-2 and HEL cells before and after the 24 h of IAA treatment. A total of 51,004 and 71,039 reproducible peaks were identified from two respective cell lines. The differential accessibility regions (DARs) were defined by a stringent cutoff (false discovery rate (FDR) controlled P-value < 0.05 and fold change > 2) [18]. We observed that the decreased DARs were notably more than the increased regions after the CTCF depletion in both erythroid cell lines. After acute depletion of CTCF in the HUDEP-2 cell line, about 2100 chromatin accessibility regions were significantly decreased, whereas only 728 regions were significantly increased (Fig. 2a; Additional file 1: Fig. S2a; Additional file 2: Table S1). Similarly, 3054 chromatin accessibility regions were decreased, whereas only 202 regions were increased in the HEL line (Fig. 2b; Additional file 1: Fig. S2a; Additional file 3: Table S2).
Fig. 2
CTCF depletion leads to substantial loss of chromatin accessibility in erythroid progenitor cells. a Heatmap centered at ATAC-seq nucleosome-free peak summits for 728 increased regions and 2100 decreased regions together with the corresponding CTCF binding signal by the ChIP-seq in the CTCF-AID HUDEP-2 cell line without and with IAA treatment for 24 h. CTCF ChIP-seq data indicate that decreased DARs have the most robust CTCF binding in HUDEP-2 cells. Increased and decreased regions were called based on a cutoff of false discovery rate (FDR) < 0.05 and fold change > 2. b Heatmap centered at ATAC-seq nucleosome-free peak summits for 202 increased regions and 3054 decreased regions together with the corresponding CTCF binding signal determined by ChIP-seq in the CTCF-AID HEL cell line without and with IAA treatment for 24 h. CTCF ChIP-seq data indicate decreased DARs have the most robust CTCF binding in HEL cells. Increased and decreased regions were called based on a cutoff of false discovery rate (FDR) < 0.05 and fold change > 2. c Genomic localization of increased, decreased, and unchanged regions from ATAC-seq in the HUDEP-2 and HEL cell lines without and with IAA treatment for 24 h. The peak distributions of increased, decreased, and control regions from ATAC-seq in the HUDEP-2 and HEL cell lines were calculated based on the absolute distance to the TSS. d Volcano plot of motif enrichment analysis of ATAC-seq comparisons: decreased regions versus unchanged control regions in the HUDEP-2 and HEL cell lines. The P values and odds ratios were calculated via Fisher’s exact tests to compare the frequency of regions containing a motif with those that do not. Each dot represents a motif in the database. The blue dots indicate motifs enriched for decreased regions. For the highlighted CTCF, multiple dots are shown as different motif IDs enriched in the database. e Violin plot of the normalized CTCF binding signal (fragments per kilobase of peaks per million reads mapped, FPKM) at decreased DARs and increased DARs or control regions in the CTCF-AID HUDEP-2 (left panel) and HEL (right panel) cell lines, from which the relative CTCF binding signal was calculated. **** P < 0.0001 according to the Wilcoxon test
Given the unique feature of substantially decreased regions in erythroid progenitors, we analyzed their genomic distribution and calculated the genomic distance from the chromatin accessibility regions to the nearest CTCF motifs. We observed that more than half of the decreased regions were located at enhancers, either distal regulatory regions (defined by 50 kb > absolute distance to the transcription start site > 2 kb) or introns. In contrast, the increased or unchanged regions were closer to the gene promoter regions (Fig. 2c). The decreased regions were closer to the CTCF motifs than the increased or unchanged regions (Additional file 1: Fig. S2b). Next, we predicted the TF occupancy profiles of DARs using the TRANSFAC motif database as a reference [19] and scored the enrichment frequency. The top TFs enriched for the decreased regions were CTCF and CTCFL (Fig. 2d; Additional file 4: Table S3). In contrast, several master TFs involved in regulating erythropoiesis and hematopoiesis (e.g., GATA1/2, TAL1, MEIS1, and NFY) were significantly enriched in increased regions (Additional file 4: Table S3). To further confirm the underlying associated TFs in these DARs, de novo motif analysis (Homer v4.9.1) was performed [20]. The results consistently revealed that the CTCF and CTCFL motifs were the top two significantly enriched motifs for the decreased regions but not for the increased regions (Additional file 1: Fig. S2c). Using the GREAT tool analysis, we further annotated the dynamic chromatin-accessible regions [21]. The decreased regions in HUDEP-2 were enriched in regulating the ROS biosynthesis process, cellular signaling, kinase activity, and metabolism pathways (Additional file 1: Fig. S2d; Additional file 5: Table S4). The decreased regions in HEL were also enriched in regulating the ROS biosynthesis process, cellular signaling, kinase activity, and metabolism pathways (Additional file 1: Fig. S2e; Additional file 5: Table S4). In addition, by integrating ATAC-seq and CTCF ChIP-seq datasets, the CTCF occupancy signals were more robust at the decreased DARs than those at increased DARs or control regions (Fig. 2e). Thus, these results indicate that CTCF is selectively required for maintaining the proper chromatin accessibility in the erythroid progenitor cells.
CTCF is required for erythroid gene activation in a stage-dependent mannerTo interrogate the impact of CTCF on the gene expression network, we profiled the transcriptome using the same CTCF depletion cellular models to identify target genes in different maturation stages. We compared the whole transcriptome between the CTCF wild-type (CTCFAID-IAA) and CTCF-depleted (CTCFAID + IAA) HUDEP-2 cells before and after induced maturation. The wild-type HUDEP-2 cells were clearly distinguished from the CTCF-depleted cells before and after maturation using the principal component analysis (PCA) (Additional file 1: Fig. S3a). Interestingly, the CTCF-depleted cells appeared close to each other before and after maturation, indicating that the differential-expressed genes after the loss of CTCF at different stages might share common targets (Additional file 1: Fig. S3a). We next performed the differential gene expression analysis with a stringent cutoff (fold change > 2 and FDR < 0.05). Before induced maturation, 267 genes decreased while 949 genes increased expression in CTCF-depleted cells compared to the control (Fig. 3a; Additional file 6: Table S5). Upon CTCF degradation after maturation, 411 and 538 genes presented a twofold decrease and increase, respectively (Fig. 3a; Additional file 6: Table S5). Importantly, the differentially expressed genes (DEGs) before and after maturation were quite different (Fig. 3b). To further explore the gene function, we performed the gene ontology (GO) analysis for the deregulated genes using the EnrichR algorithm [22]. We found that erythropoiesis-related pathways, such as the porphyrin-containing compound biosynthetic and 2-oxoglutarate metabolic processes, were enriched in the decreased genes after CTCF depletion. In contrast, the complement receptor-mediated signaling pathway and negative regulation of cytokine production were enriched in the increased genes (Fig. 3c; Additional file 1: Fig. S3b; Additional file 6: Table S5). To further confirm whether the DEGs identified after the acute CTCF degradation are direct or indirect targets, we analyzed the publicly available ChIP-seq datasets of CTCF in both immature and mature states in HUDEP-2 cells (GSE131055) [23]. About 40,371 and 39,403 reproducible peaks were called before and after maturation, respectively. Notably, over 90% of the peaks (34,224) overlapped between the two states (Fig. 3d; Additional file 7: Table S6). We then analyzed the CTCF occupancy in the deregulated genes after CTCF loss. We observed that more than half of the decreased or increased genes were directly bound by CTCF (Fig. 3e). For example, the expression of genes related to erythroid maturation (e.g., HBA1, HBA2, TFRC, SLC25A37, and CD36) and genes involved in metabolic pathways (e.g., ALAS2, ALAD, FXN, GPT, and GOT2) decreased after the induction of CTCF degradation (Fig. 3f). These results are consistent with the observation that CTCF-depleted HUDEP-2 cells underwent abnormal erythroid maturation as described previously. We also performed a transcriptome analysis of the CTCF-AID HEL cell line before and after hemin-induced maturation. We observed similar stage-dependent differences in the DEGs after CTCF depletion in the HEL model (Additional file 1: Fig. S3c and S3d; Additional file 8: Table S7). Similarly, erythroid-related targets in the sulfur compound metabolic pathway were decreased in HEL cells before and after maturation (Additional file 1: Fig. S3e; Additional file 8: Table S7). To further rule out the potential secondary effects of CTCF depletion on transcriptome changes, we performed bulk RNA-seq after CTCF degradation for shorter periods, including 6 (T6) and 12 (T12) upon CTCF depletion in the two CTCF-AID cellular systems. In total, 241 and 432 DEGs were identified for T6 and T12, respectively, in the CTCF-depleted HUDEP-2 cells (Additional file 1: Fig. S3f). Similarly, 246 and 443 differentially expressed genes were identified for T6 and T12, respectively, in the CTCF-depleted HEL cells (Additional file 1: Fig. S3f). Notably, the downregulated and upregulated genes dramatically overlapped at each time point (Additional file 1: Fig. S3g). Thus, these results suggest that CTCF is required for the expression of different subsets of genes in different maturation stages during human erythropoiesis.
Fig. 3
CTCF is required for target gene activation in a stage-dependent manner. a Volcano plot showing transcriptome changes in the CTCF-AID clones of HUEDP-2 without and with IAA treatment in an immature expansion state (left panel). Volcano plot showing transcriptome changes in two individual clones of HUEDP-2 on day 2 after induction of erythroid maturation without and with IAA treatment (medium panel). The number of differentially expressed genes in immature and mature HUDEP-2 cells before and after IAA treatment is summarized (right panel). The cutoff was based on an FDR < 0.05 and fold change > 2. b Overlap analysis of decreased genes between mature and immature states at the transcriptional level after CTCF depletion (left panel); and overlap analysis of increased genes between mature and immature states at the transcriptional level after CTCF depletion (right panel) in CTCF-AID HUDEP-2 cells. c Gene ontology analysis of the enriched biological processes associated with the genes whose expression decreased from panel b in the mature, immature, and both states. The relative P value was calculated via the EnrichR database. d Overlap between CTCF ChIP-seq peaks between immature and mature states. The CTCF ChIP-seq data were processed from the GSE131055 dataset [23]. e Percentages of CTCF occupancy in decreased and increased genes within their promoters in the immature (upper panel) and mature (lower panel) states. f Heatmap of erythroid marker gene and metabolism pathway gene expression in CTCF-AID HUDEP-2 cells without IAA treatment, with IAA treatment for 24 h and washout of IAA for 24 h in expansion medium
Interrogate CTCF target genes based on multi-omics integrative analysisTo project our observations in three-dimensional chromatin niche in human erythroid progenitor cells, we utilized in situ Hi-C to quantify the genome-wide DNA contacts via proximity ligation and next-generation sequencing in CTCF-AID HEL cells before and after 24 h of IAA treatment. A high-resolution Hi-C profiling at 5 kb showed a strong correlation between replicates (Additional file 1: Fig. S4a). The high-order chromosome folding at the resolution of A/B compartments was similar before and after the CTCF depletion in HEL cells (Additional file 1: Fig. S4b and S4c). Next, based on two replicates of our Hi-C data, we called an average of 3208 TADs and 1100 TADs before and after CTCF depletion in the HEL cells, respectively (Fig. 4a; Additional file 9: Table S8). To further explore the effect of the CTCF loss on chromatin loops, we combined the data from two replicates for further analysis. We obtained 13,053 chromatin loops within TAD boundaries before CTCF depletion, whereas 3977 chromatin loops remained after the 24 h of IAA treatment (Fig. 4b; Additional file 9: Table S8). In agreement with previous studies in other model systems [17], our Hi-C data suggests that CTCF is essential for maintaining intra-TAD DNA interactions and delineating TAD boundaries but is dispensable for higher-order compartment integrity.
Fig. 4
Interrogate CTCF target genes based on multi-omics integrative analysis. a The number of TADs called from CTCF-AID HEL cells is shown with or without 24 h of IAA treatment. The reproducibility of the Hi-C data from two independent replicates was high, allowing the integration of raw Hi-C data to recall TADs. b The number of chromatin loops called from CTCF-AID HEL cells is shown with or without 24 h of IAA treatment. The reproducibility of the Hi-C data from two independent replicates was high, allowing the integration of raw Hi-C data to recall loops. c Violin plot showing the relative fold change in normalized contact numbers from Hi-C in CTCF-AID HEL cells (+ IAA versus − IAA) at loops grouped by whether the loop anchors overlapped the DARs from ATAC-seq (left panel) or the DEGs from RNA-seq relative to their corresponding control groups. *** P < 0.001; **** P < 0.0001, according to the Wilcoxon test. d Screenshot of the metabolism-related gene example FXN, with ATAC-seq, CTCF ChIP-seq, and GATA1 ChIP-seq signals and annotated TAD domains and chromatin loops from the genome-wide Hi-C interaction map before and after IAA treatment in CTCF-AID HEL cells. The red arrow highlights the decreased ATAC-seq and CTCF ChIP-seq peaks in the enhancer and promoter regions. The black cycle indicates the position of loops identified with lost contacts after IAA treatment in CTCF-AID HEL cells. e Screenshot of the metabolism-related gene example GOT2, with ATAC-seq, CTCF ChIP-seq, and GATA1 ChIP-seq signals and annotated TAD domains and chromatin loops from the genome-wide Hi-C interaction map before and after IAA treatment in CTCF-AID HEL cells. The red arrow highlights the decreased ATAC-seq and CTCF ChIP-seq peaks in the promoter region. The black cycle indicates the loop position identified with lost contacts after IAA treatment in CTCF-AID HEL cells. f In both the immature and mature states, the validated mRNA level of FXN expression in the CTCF-AID HUDEP-2 and HEL cells was obtained without and with IAA treatment. The mRNA level was determined relative to that of β-actin from three replicates. ** P < 0.01, *** P < 0.001, **** P < 0.0001, unpaired Student’s t test. g In both the immature and mature states, the validated mRNA level of GOT2 expression in the CTCF-AID HUDEP-2 cells and HEL cells without and with IAA treatment. The mRNA level was determined relative to that of β-actin from three replicates. ** P < 0.01; *** P < 0.001, **** P < 0.0001, unpaired Student’s t test
To decipher the role of CTCF in gene transcriptional regulation at the 3D level, we performed multi-omics integrated analysis by utilizing ATAC-seq and RNA-seq together with the in situ Hi-C data. First, we asked whether the DARs from ATAC-seq or the DEGs from RNA-seq were directly associated with the dynamic chromatin loops. We separated the chromatin loops into three DARs groups and plotted their normalized chromatin contact numbers with different criteria (Knight-Ruiz normalization) according to previous methods [18]. Importantly, the number of lost contracts at loops overlapping the decreased DARs was significantly more than that of the loops overlapping the control regions (Wilcoxon test P value < 2.2 × 10⁻¹⁶) (Fig. 4c). Similarly, compared with the control genes, the decreased genes were observed with a significantly higher frequency with lost looping (Wilcoxon test P value = 0.002388) (Fig. 4c). These results suggest that the loss of chromatin looping after CTCF depletion was strongly correlated with the loss of chromatin accessibility and the suppression of gene transcription. Next, we explored whether these DARs or DEGs were also associated with the TAD boundaries. Accordingly, we called high-confidence TAD boundaries in the control and CTCF-depleted cells from the Hi-C dataset. Notably, the decreased or increased DARs or relative control regions were observed to have a similar distribution pattern of distance to the TAD boundaries. In contrast, only the decreased genes were more distal from the TAD boundaries than the increased or control genes were (Additional file 1: Fig. S4d). These results indicate that CTCF-mediated chromatin looping, not TAD maintenance, is correlated with chromatin accessibility and gene transcription.
The other unique application for the multi-omics data is to reveal the downstream gene regulation of CTCF. To further identify direct CTCF targets, we reasoned that direct CTCF occupancy likely affects chromatin accessibility and transcription. Therefore, we conducted an integrated data analysis using the ATAC-seq, RNA-seq, and CTCF ChIP-seq data. We selected all decreased ATAC peaks within 100 kb of the transcription start sites (TSSs) and then annotated those peaks to the associated genes. Among the deregulated genes in the immature state, 141 genes contained ATAC peaks that were decreased upon CTCF depletion. In this gene set, 46 genes were downregulated (activated by CTCF), and 95 genes were upregulated (repressed by CTCF) (Additional file 1: Fig. S4e; Additional file 10: Table S9). Moreover, over 90% of those genes were bound by CTCF in HUDEP-2 cells, identifying them as direct CTCF targets (Additional file 10: Table S9). Importantly, the GO analyses of downregulated genes with reduced ATAC peaks upon CTCF depletion revealed an enrichment of genes associated with the amino acid metabolic, sulfur compound metabolic, and glycoprotein biosynthetic processes (Additional file 1: Fig. S4f; Additional file 11: Table S10). For example, CTCF exhibited strong occupancy at the loci of three direct target genes that are essential for mitochondrial heme and iron-sulfur cluster metabolism (e.g., FXN and GOT2) and novel RNA-binding protein (RBM45), of which the mRNA levels and the chromatin accessibility were significantly decreased, accompanied by loss of the chromatin looping after the induction of CTCF degradation (Fig. 4d and 4e; Additional file 1: Fig. S5a-d). All three gene expression patterns were confirmed and validated by Q-PCR after the CTCF depletion in the HEL and HUDEP-2 cells (Fig. 4f, g; Additional file 1: Fig. S5e). Among them, RBM45 is one of the most sensitive downstream targets of CTCF, and the CTCF protein binds directly to the promoter region of RBM45. The CTCF binding site in the RBM45 promoter is functional for gene regulation, supported by the fact that CRISPR/Cas9-mediated disruption of this site significantly reduced its mRNA level (Additional file 1: Fig. S5f). Thus, these results suggest that CTCF can directly bind and activate its target genes through chromatin accessibility and chromatin looping in erythroid lineage.
CTCF is also required for a subset of GATA1-mediated gene repressionImportantly, we observed that a proportion of the subset of upregulated genes was associated with the ATAC peaks that were reduced upon CTCF depletion (Additional file 1: Fig. S4e). The GO analysis of those upregulated genes revealed an enrichment of genes associated with positive regulation of cytokine production, muscle system processes, negative regulation of transport, epithelial cell proliferation, and ameboidal-cell type migration (Additional file 1: Fig. S4f; Additional file 11: Table S10). These genes were most likely repressed by CTCF, suggesting the role of CTCF in suppressing alternative lineage genes. More importantly, by analyzing the potential transcription factor occupancy upstream of those genes, hematopoietic transcription factors, including GATA1, were identified as the most significant TFs (Fig. 5a; Additional file 11: Table S10). These results suggest that CTCF may coordinate with GATA1 to suppress a subset of genes.
Fig. 5
CTCF is also required for a subset of GATA1-mediated gene repression. a The top ten enriched TFs associated with the genes with decreased ATAC peaks and upregulated expression in IAA-treated cells were identified via the EnrichR database. The relative P value was calculated from the database. b Heatmaps showing the dynamic GATA1 binding signal centered at the GATA1 peak summit for decreased and increased GATA1 regions in the HUDEP-2 cell line without and with IAA treatment for 24 h. The GATA1 ChIP-seq results were merged with analyses from two independent replicates. c Screenshot of KIT, with ATAC-seq, CTCF ChIP-seq, and GATA1 ChIP-seq signals and annotated TAD domains and chromatin loops from the genome-wide Hi-C interaction map before and after IAA treatment in CTCF-AID HEL cells. The red arrow highlights the decreased CTCF ChIP-seq peaks in the enhancer and promoter regions. The black cycle indicates the loop position identified with no change before and after IAA treatment in CTCF-AID HEL cells. d Plot of fragments per kilobase of peaks per million reads mapped (FPKM) values and validated mRNA levels of KIT expression in CTCF-AID HUDEP-2 cells without and with IAA treatment in both the immature and mature states. The mRNA level was determined relative to that of β-actin from three replicates. ** P < 0.01, *** P < 0.001, unpaired Student’s t test. e Screenshot of GATA2, with ATAC-seq, CTCF ChIP-seq, and GATA1 ChIP-seq signals and annotated TAD domains and chromatin loops from the genome-wide Hi-C interaction map before and after IAA treatment in CTCF-AID HEL cells. The red arrow highlights the decreased ATAC-seq and CTCF ChIP-seq in the distal region. The black cycle indicates the loop position identified in CTCF-AID HEL cells. f Plot of fragments per kilobase of peaks per million reads mapped (FPKM) values and validated mRNA levels of GATA2 expression in CTCF-AID HEL cells without and with IAA treatment in both the immature and mature states. The mRNA level was determined relative to that of β-actin from three replicates. * P < 0.05, ** P < 0.01, *** P < 0.001, unpaired Student’s t test. g The cartoon illustrating the location of CBS1 (CTCF binding site 1) between GATA2 and its downstream neighbor gene RPN1, which is about 129 kb to the first exon of the GATA2 gene. h Measurement of GATA2 mRNA by quantitative real-time PCR (left panel) and GATA2 protein by Western blot (right panel) in the GATA2-CBS1-sgRNA targeted bulk population relative to non-targeting sgRNA control in HUDEP-2 cells. The mRNA expression levels were normalized to those of β-actin mRNA. The graph shows the results as the mean values ± SEMs from three replicates. *P < 0.05, unpaired Student’s t test. The β-actin was used as a loading control for immunoblots. i Measurement of GATA2 mRNA by quantitative real-time PCR in three individual GATA2-CBS1 knockout HUDEP-2 cell clones generated with Cas9 + CBS1-sgRNA. The expression levels were normalized to those of β-actin mRNA. The graph shows the results as the mean values ± SEMs from three replicates. **P < 0.01, **** P < 0.0001, unpaired Student’s t test
The well-known erythroid “master” transcription factor GATA1 controls the activation of the erythroid-specific gene signatures and the suppression of other lineage genes. Although CTCF colocalizes with GATA1 during human erythropoiesis, how CTCF affects the occupancy of genome-wide GATA1 remains unknown. We hypothesized that the acute CTCF depletion may disrupt a specific subset of GATA1 targets. To test this hypothesis, we further profiled the genome-wide occupancy of GATA1 via ChIP-seq before and after the CTCF depletion. First, we called 49,114 and 57,071 reproducible GATA1 peaks in the CTCF-AID HUDEP-2 and HEL cells before the IAA treatment, and the GATA motifs were significantly enriched in the reproducible peaks (Additional file 12: Table S11). We then compared the dynamic GATA1 binding signals before and after the CTCF depletion. Notably, 1032 decreased and 1097 increased GATA1 regions were identified in the HUDEP-2 cells, while 1902 decreased and 954 increased GATA1 regions were identified in the HEL cells (Fig. 5b; Additional file 1: Fig. S6a). Both CTCF and GATA1 binding signals were significantly reduced after the CTCF depletion for the decreased GATA1 regions, and those two TFs were identified among the top significantly enriched TFs by Homer analysis (Additional file 1: Fig. S6b), suggesting that CTCF is required for the proper occupancy of GATA1 in a subset of regions. Moreover, the genomic distribution of the decreased GATA1 was located mainly in the distal regulatory regions (Additional file 1: Fig. S6c). We further explored whether the DEGs were correlated with reduced GATA1 occupancy at the nearby locus. A more significant correlation between increased genes and decreased GATA1 occupancy was identified in HUDEP-2 cells (Additional file 1: Fig. S6d). Taken together, these results suggest that a proportion of the reduced GATA1 occupancy might correlate with partial gene upregulation after CTCF depletion.
Furthermore, we validated some of the GATA1-suppressed targets. For example, CTCF exhibited strong occupancy at the KIT locus, in which the mRNA expression was significantly increased while the chromatin looping remained unchanged in the immature stage after the induction of CTCF degradation (Fig. 5c, d; Additional file 1: Fig. S6e). KIT is critical for the cell proliferation of both HSCs and erythroid progenitors and is also a well-known direct target gene of both GATA1 and GATA2 that needs to be repressed after erythroid maturation [24]. Next, we determined how CTCF changed the expression level and chromatin accessibility of both GATA1 and GATA2. Strikingly, we found that GATA2 mRNA significantly increased after depletion of CTCF in the HUDEP-2 line before and after erythroid maturation (Fig. 5e, f).
To decipher the CTCF functional occupancy site, we analyzed it more deeply by combining all the chromatin accessibility, histone modification, CTCF, and GATA1 occupancy datasets across the annotated TAD region in different cellular contexts. Notably, the GATA2 locus was directly bound by CTCF at multiple sites, mainly located in distal regions. In particular, two CTCF binding sites in the GATA2 distal enhancer region exhibited significantly decreased chromatin accessibility after the CTCF depletion in the HEL and HUDEP-2 lines with opposite orientations in the nearest downstream region of RPN1 (Fig. 5e; Additional file 1: Fig. S6f). Of note, the Hi-C data collected from both HUDEP-2 and HEL cells confirmed the interaction between the GATA2 promoter region and the left-orientated CTCF binding site 1 (CBS1) (Fig. 5e; Additional file 1: Fig. S6f). Although CTCF binds directly to the GATA2 locus in multiple human cell contexts (Additional file 1: Fig. S7a), its suppressive role is not conserved. We re-analyzed the regulation using SEM, representing the human B-ALL cell context (Additional file 1: Fig. S7b). Upon CTCF degradation, the ATAC-seq and CTCF binding were lost at the GATA2 locus (Additional file 1: Fig. S7b). However, the genes in the GATA2 locus exhibited no decrease or a mild decrease in expression after the CTCF loss (Additional file 1: Fig. S7c). To determine the role of the CTCF binding site (CBS) in the GATA2 locus, we performed the following experiments to explore its regulatory role. To further validate the function of the 3’ distal element, we used the CRISPR/Cas9 system to delete the CTCF binding motif. A sgRNA targeting the CBS1 in the distal chromatin accessibility region achieved an overall indel frequency of 70% in the targeted pool population (Fig. 5g; Additional file 1: Fig. S7d). Importantly, disruption of the CBS1 in the distal region of GATA2 led to a significant increase in GATA2 expression but a decrease for the neighbor gene RPN1 in the bulk population and generated single knockout clones compared with the non-targeting guide RNA control (Fig. 5h, i; Additional file 1: Fig. S7e and S7f). Thus, the CBS1 in the distal region acts as a transcription repressive element for GATA2 expression in erythroid progenitor cells.
Comments (0)