
Remember me
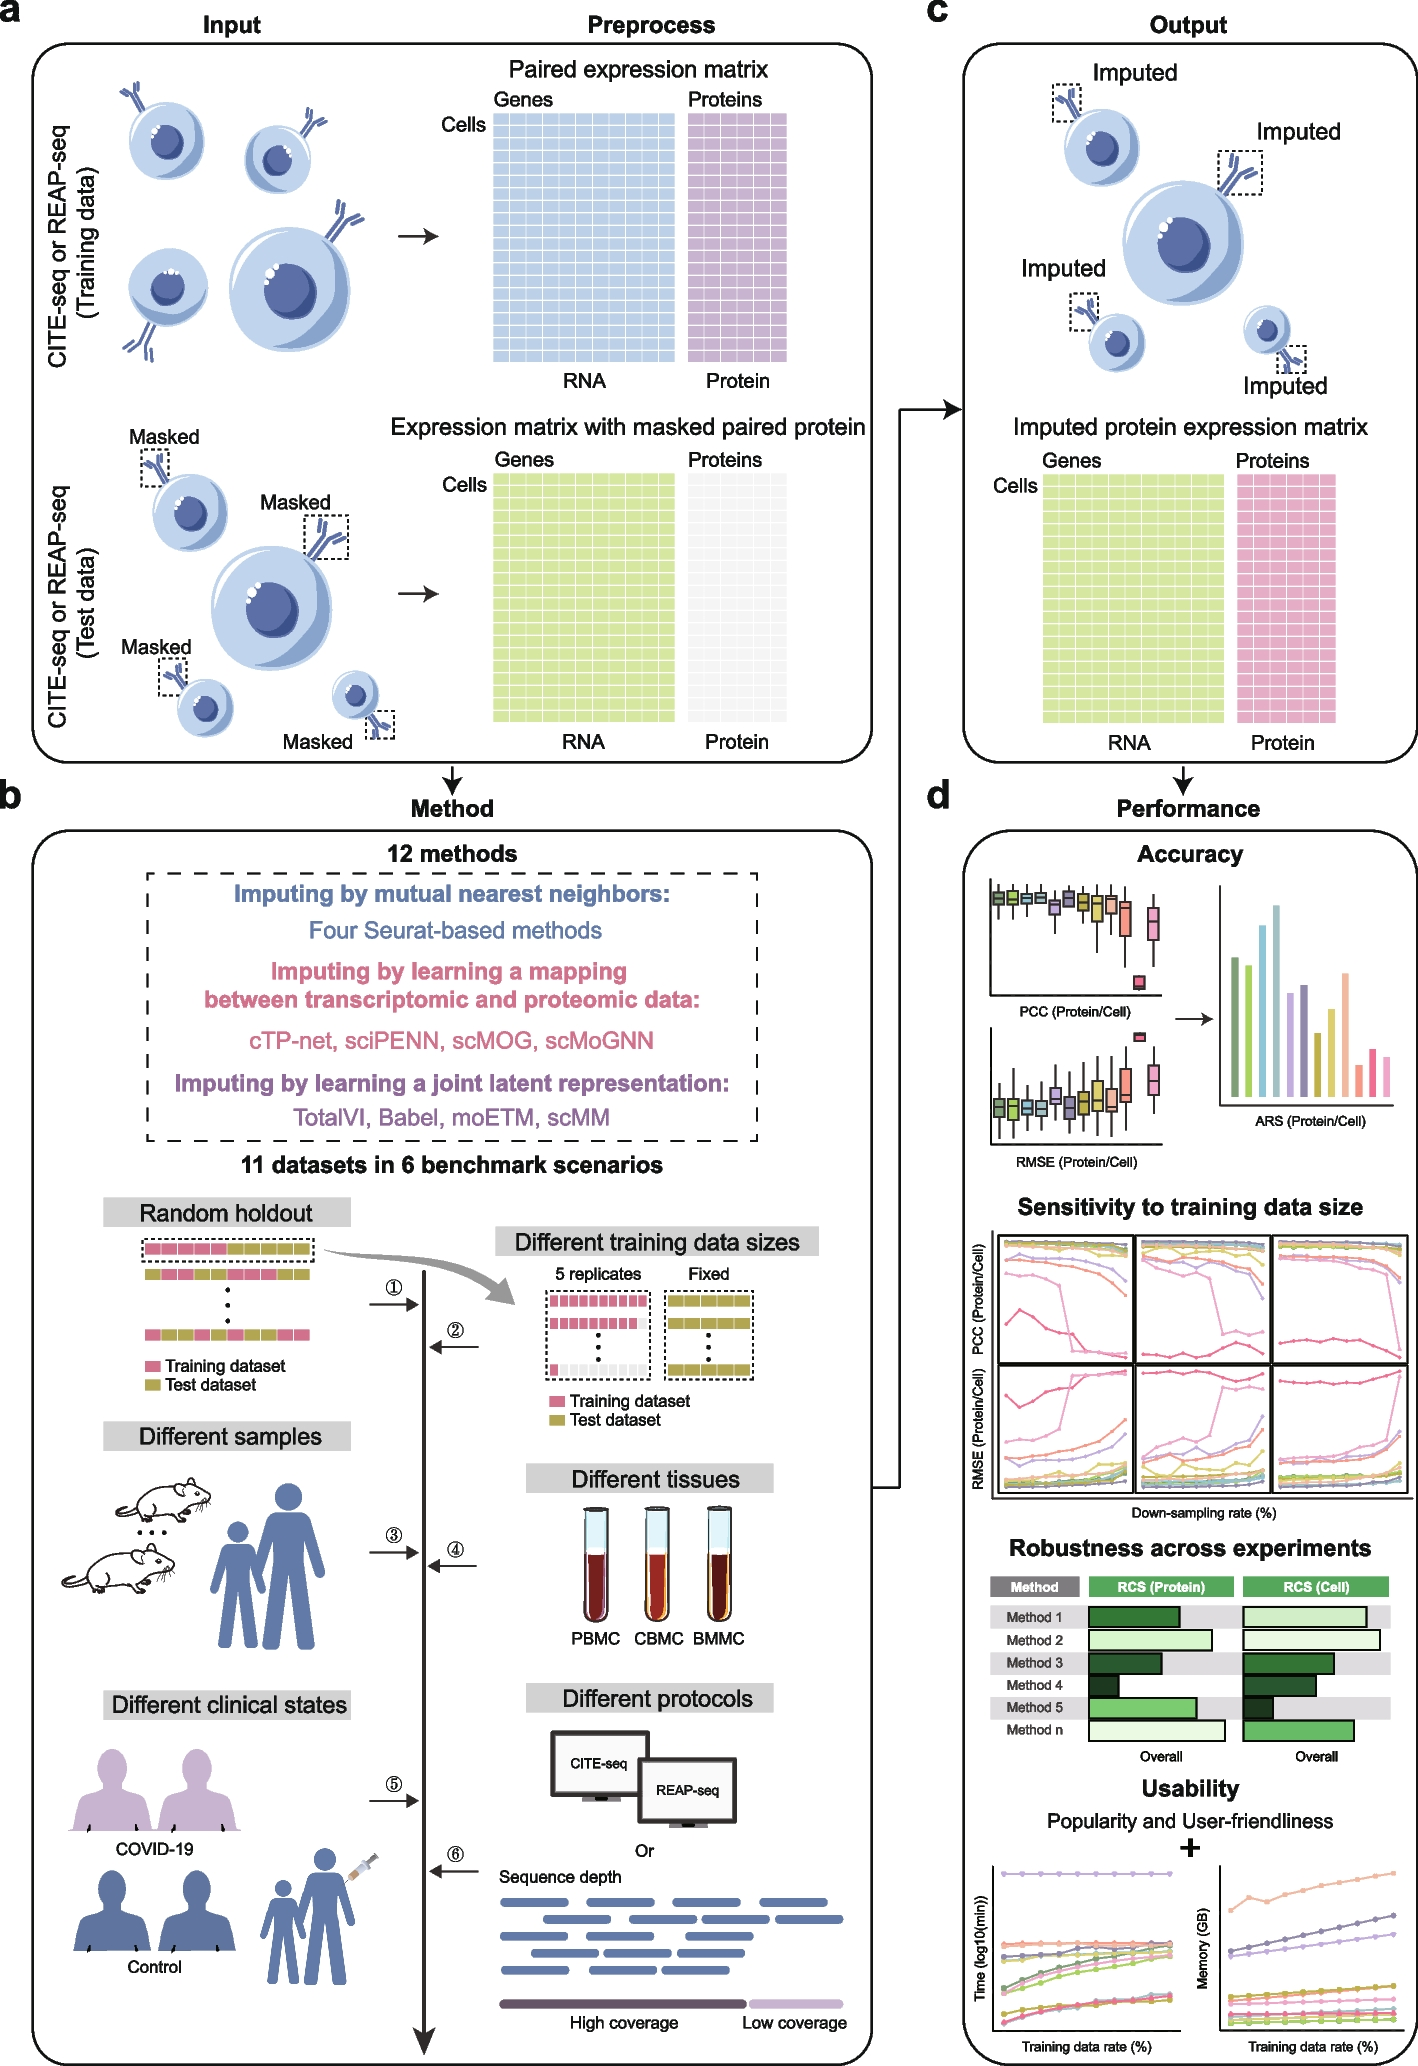


The overall pipeline of this benchmark study is illustrated in Fig. 1. In each experiment, we use one CITE-seq or REAP-seq dataset containing paired transcriptomic and proteomic data as the training data. For the test data, we mask the proteomic data from another CITE-seq or REAP-seq dataset, retaining only the transcriptomic data to simulate scRNA-seq data, and then use various imputation methods to predict the corresponding proteomic data (Fig. 1a).
To comprehensively evaluate the performance of these imputation methods, our benchmark includes twelve state-of-the-art methods: four Seurat-based methods (Seurat v3 (CCA), Seurat v3 (PCA), Seurat v4 (CCA), and Seurat v4 (PCA)), cTP-net, sciPENN, scMOG, scMoGNN, TotalVI, Babel, moETM, and scMM. These methods are categorized based on their imputation strategies (Fig. 1b): imputing by mutual nearest neighbors, imputing by learning a mapping between transcriptomic and proteomic data using deep learning, and imputing by learning a joint latent representation using an encoder-decoder framework. To test the generalizability and robustness of these imputation methods, we use eleven datasets and conduct experiments under six distinct benchmark scenarios (Fig. 1b and Additional file 1: Tables S1, S2): (1) Random holdout: A dataset is randomly divided into training and test sets to address the case without technical or biological differences; (2) Different training data sizes: Evaluating performance with varying training data sizes to understand how training data size influences each method; (3) Different samples: Considering the scenario where the training and test datasets come from different samples; (4) Different tissues: Testing each method’s generalizability when predicting protein expression for cells from tissues different from those used in the training set; (5) Different clinical states: Assessing each method’s ability to transfer between datasets with biological variations; (6) Different protocols: Investigating performance when training and test datasets are derived from different sequencing protocols.
Fig. 1
Overview of the benchmark framework. a The raw CITE-seq or REAP-seq datasets are preprocessed, with one dataset containing paired gene and protein expression matrices used as the training data, and the other dataset having its protein expression matrix masked, with only the gene expression matrix used to simulate scRNA-seq data, which serves as the test data. b Twelve state-of-the-art methods, categorized according to their imputation strategies, are evaluated using eleven datasets across six benchmark scenarios. c After training on the training data, the imputed protein expression matrix for the test data is generated through inference. d The benchmark results are assessed based on accuracy, sensitivity to training data size, robustness across experiments, and usability in terms of popularity, user-friendliness, running time, and memory usage
After generating imputation values using different methods (Fig. 1c), we design a comprehensive framework to evaluate their performance (Fig. 1d). First, we evaluate the accuracy of methods using Pearson correlation coefficient (PCC) and root mean square error (RMSE). To provide an overall performance metric, we also introduce an average rank score (ARS) that combines the rank score values of methods based on PCC and RMSE. A higher ARS value indicates better accuracy performance across all metrics in the experiment. Second, we assess how the methods’ accuracy performance changes with varying training data sizes by running the methods on training sets of different sample sizes. This analysis helps to understand how the amount of training data influences the methods’ accuracy performance. Third, we evaluate the robustness of methods across experiments by introducing a robustness composite score (RCS). This metric considers both the mean and standard deviation of the ARS values across different experiments. We primarily evaluate experiments demonstrating technical and biological differences that closely resemble those conducted in real-world applications. These experiments stem from scenarios involving different samples, tissues, clinical states, and protocols. A high RCS value indicates that a method not only performs well on average but also maintains consistent performance across all experiments with technical and biological differences. Accurate protein abundances across cells are crucial for tasks such as differential expression analysis and omics feature correlation analysis, while accurate protein abundances in individual cells are essential for tasks like cell clustering analysis and cell trajectory inference. Therefore, we assess the methods at both the protein and cell levels for the above evaluations to accommodate the varying requirements of different downstream tasks. Finally, we compare the methods in terms of usability metrics, including popularity (measured by the number of stars on their official GitHub repositories), user-friendliness (measured by the quality of installation procedures, codes, and tutorials), running time, and memory usage.
Scenario 1: evaluating accuracy performance over random holdoutTo evaluate the performance of different imputation methods, we begin with a straightforward scenario where the training and test datasets are randomly divided from the same dataset. We utilize three widely referenced datasets: CITE-PBMC-Stoeckius [5], CITE-CBMC-Stoeckius [5], and CITE-BMMC-Stuart [12], which have been extensively used in previous studies assessing surface protein expression imputation methods [12, 14, 19, 21]. For each dataset, we randomly split the cells into two groups: a training dataset comprising half of the cells and a test dataset with the remaining half. The training dataset is used to train the models, and the test dataset is used to evaluate their performance. To account for variability in the dataset split, we repeat the experiment five times and present the results of each repetition using boxplots. Finally, in this scenario, we conduct a total of 15 experiments, consisting of three datasets, with five repeated experiments for each dataset.
Figure 2a shows the median PCC of each method across proteins or cells in each replicate experiment, while the corresponding results evaluated using RMSE are presented in Additional file 2: Fig. S1. Most methods exhibit stable performance across different replicates, except for moETM, which appears sensitive to the split between training and test datasets. Notably, moETM demonstrates superior and stable performance with the CITE-CBMC-Stoeckius dataset but exhibits considerable performance fluctuations with the other two datasets, suggesting that its performance may heavily depend on the underlying dataset. The performance of each method also varies across datasets and evaluation metrics, with no clear overall winner. To summarize these results, we calculate the average of the 15 ARS values (from three datasets, five repetitions) at both the protein and cell levels. We find that cTP-net outperforms other methods at the protein level while achieving moderate performance at the cell level (Fig. 2b, c). Unlike cTP-net, which shows a preference for the protein level, Seurat v4 (PCA), Seurat v4 (CCA), and Seurat v3 (PCA) demonstrate competitive performance at both the protein and cell levels (Fig. 2b, c).
Fig. 2
Comparison of PCC among methods over random holdout. a Boxplots for PCC of each method in experiments with the CITE-PBMC-Stoeckius, CITE-CBMC-Stoeckius, and CITE-BMMC-Stuart datasets. The boxplots display the median PCC of each method across proteins or cells in each replicate experiment. Center line: median; box limits: upper and lower quartiles; whiskers: 1.5 times interquartile range. b, c Barplots for ARS value of each method at the protein (b) and cell (c) levels. Data are presented as the average of the 15 ARS values (from three datasets, five repetitions) across all experiments in this scenario. Methods are ordered according to their performance
Scenario 2: evaluating accuracy performance over different training data sizesWe investigate the impact of training data size variations on the accuracy performance of imputation methods. Using the CITE-PBMC-Stoeckius, CITE-CBMC-Stoeckius, and CITE-BMMC-Stuart datasets, we first randomly split each dataset into training and test sets, following scenario 1. Subsequently, we down-sample the training dataset by removing cells at intervals of 10% from 0 to 90%, while keeping the test dataset constant. To address variability, we conduct five replicate experiments for each dataset. In total, we conduct 150 experiments in this scenario, using three datasets and performing five repeated experiments for each dataset across ten different down-sampling rates.
Under each down-sampling rate, we first calculate the median PCC and RMSE across proteins or cells for each experiment, and then take the median of these values across five replicate experiments to obtain a robust performance measure, whose trends across different down-sampling rates are illustrated in Fig. 3a and Additional file 2: Fig. S2. As expected, imputation performance generally decreases as the training dataset size is reduced. Notably, methods such as Seurat v3 (CCA), Seurat v4 (CCA), and Seurat v4 (PCA) show relative insensitivity to training data size variations, maintaining robust performance. In contrast, deep learning-based methods like scMM, scMOG, and moETM, which perform poorly initially, are more sensitive to reductions in training data size. TotalVI also exhibits some sensitivity at the protein level. This sensitivity may be due to the larger training datasets required by deep learning models for optimal performance. To comprehensively rank the twelve imputation methods, we calculate the average of the 150 ARS values (from three datasets, five repetitions, and ten down-sampling rates) at both the protein and cell levels. cTP-net, Seurat v4 (PCA), and Seurat v4 (CCA) demonstrate the best performance across various down-sampling rates at the protein level (Fig. 3b). At the cell level, Seurat v4 (PCA), Seurat v4 (CCA), and Seurat v3 (PCA) outperform other methods (Fig. 3c).
Fig. 3
Comparison of PCC among methods over different training data sizes. a Line plots for PCC of each method as the down-sampling rate of the training dataset changes. The horizontal axis represents the down-sampling rate of the training dataset. The vertical axis represents the median PCC performance at the protein or cell level across five replicate experiments under each down-sampling rate. Each line represents a method. b, c Barplots for ARS value of each method at the protein (b) and cell (c) levels. Data are presented as the average of the 150 ARS values (from three datasets, five repetitions, and ten down-sampling rates) across all experiments in this scenario. Methods are ordered according to their performance
Scenario 3: evaluating accuracy performance over different samplesIn this scenario, we evaluate the performance of imputation methods when the training and test datasets originate from different samples, reflecting common real-world conditions. We use three datasets: CITE-PBMC-Li [26, 27], CITE-SLN111-Gayoso [18], and CITE-SLN208-Gayoso [18]. The CITE-PBMC-Li dataset includes data from eight volunteers measured before and after HIV vaccination. To eliminate potential batch differences from biological variation, we use only pre-vaccination data. The volunteers are randomly assigned to two non-overlapping groups: group 1, consisting of four volunteers, and group 2, comprising the remaining four. We conduct two complementary experiments, alternating between using one group as the training set and the other as the test set. To account for randomness, we repeat the group assignments five times and conduct the experiments for each random division. The CITE-SLN111-Gayoso and CITE-SLN208-Gayoso datasets contain data from the spleen and lymph node tissues of two mice. For each dataset, we perform two complementary experiments, alternating between using one mouse as the training set and the other as the test set. In total, 14 experiments are conducted in this scenario. For the CITE-PBMC-Li dataset, two complementary experiments are performed with five repetitions, while for the CITE-SLN111-Gayoso and CITE-SLN208-Gayoso datasets, two complementary experiments are conducted for each.
A comparison of the evaluation results from experiments involving different datasets reveals significant differences. In experiments involving the CITE-PBMC-Li dataset, moETM consistently achieves the best performance in protein-level evaluation metrics (Fig. 4a and Additional file 2: Fig. S3a). However, no single method consistently outperforms others at the cell level, with TotalVI, Seurat v3 (PCA), and scMoGNN each demonstrating their respective strengths (Fig. 4a and Additional file 2: Fig. S3a). Boxplots in Additional file 2: Fig. S4 are based on the median evaluation metric value across proteins or cells of each repetition, showing the performance of each method across different random divisions. We observe that most methods exhibit relatively stable performance, with the aforementioned methods consistently maintaining their respective advantages. In the CITE-SLN111-Gayoso dataset, TotalVI and Seurat-based methods excel at the protein and cell levels, respectively (Fig. 4b and Additional file 2: Fig. S3b). In the CITE-SLN208-Gayoso dataset, TotalVI leads at both the protein level and for PCC at the cell level (Fig. 4c and Additional file 2: Fig. S3c). To summarize, we evaluate the methods’ performance at the protein and cell levels by averaging the six ARS values (from three datasets, two complementary experiments per dataset). To account for the potential impact of varying numbers of experiments across datasets on the overall results, the ARS for the CITE-PBMC-Li: Group1\(\rightarrow\)Group2 and CITE-PBMC-Li: Group2\(\rightarrow\)Group1 experiments are calculated using the median evaluation metric values across five repetitions. moETM, TotalVI, and scMoGNN show superior performance at the protein level (Fig. 4d). Seurat-based methods consistently demonstrate superior performance when focusing on the accuracy of protein abundances at the cell level (Fig. 4e).
Fig. 4
Comparison of quantitative evaluation metrics among methods over different samples. a–c Boxplots for PCC or RMSE of each method in the CITE-PBMC-Li: Group1\(\rightarrow\)Group2 (a), CITE-SLN111-Gayoso: Mouse1\(\rightarrow\)Mouse2 (b), and CITE-SLN208-Gayoso: Mouse1\(\rightarrow\)Mouse2 experiments (c). The boxplots display values calculated at the protein or cell level. In (a), the results represent all five repetitions of the experiment, with all values at the protein or cell level across these repetitions included in the boxplot, where each point indicates the evaluation metric value of a protein or cell from the five repetitions. Center line: median; box limits: upper and lower quartiles; whiskers: 1.5 times interquartile range. d, e Barplots for ARS value of each method at the protein (d) and cell (e) levels. Data are presented as the average of the six ARS values (from three datasets, two complementary experiments per dataset) across all experiments in this scenario. Methods are ordered according to their performance
Scenario 4: evaluating accuracy performance over different tissuesWe assess the performance of the methods when the training and test datasets are derived from different tissues. We utilize three datasets: CITE-BMMC-Stuart (bone marrow mononuclear cells), CITE-CBMC-Stoeckius (cord blood mononuclear cells), and CITE-PBMC-Stoeckius (peripheral blood mononuclear cells), each representing cells from distinct but related blood sources [28, 29]. Each of these datasets is paired with one another, resulting in six experiments where each dataset is alternately used as the training and test dataset.
Summarizing the results of these six experiments (Fig. 5a), we observe variability in benchmark results across different assessment metrics. Specifically, for metrics at the protein level, Seurat-based methods generally lead in performance except in the BMMC\(\rightarrow\)PBMC and CBMC\(\rightarrow\)PBMC experiments, where scMoGNN and cTP-net outperform other methods, respectively. For PCC at the cell level, sciPENN shows superior performance, except in the CBMC\(\rightarrow\)PBMC and PBMC\(\rightarrow\)CBMC experiments, where TotalVI and Seurat v4 (PCA) perform best, respectively. Seurat-based methods consistently demonstrate superior performance in RMSE at the cell level across all experiments. An interesting observation is that protein-level metrics are more sensitive to the direction of data migration. The leading methods achieve higher PCC values and lower RMSE values in the BMMC\(\rightarrow\)CBMC and PBMC\(\rightarrow\)CBMC experiments compared to their respective complementary experiments. To summarize the results across all six experiments using average ARS values, Seurat v4 (PCA), Seurat v3 (PCA), and Seurat v3 (CCA) exhibit superior performance for protein-level metrics (Fig. 5b). Seurat v3 (PCA), Seurat v3 (CCA), and Seurat v4 (CCA) lead in performance for cell-level metrics (Fig. 5c).
Fig. 5
Comparison of quantitative evaluation metrics among methods over different tissues. a Heatmaps for PCC or RMSE of each method in each experiment of this scenario. The horizontal axis represents each method and the vertical axis represents each experiment. The values are the median across all proteins or cells. b, c Barplots for ARS value of each method at the protein (b) and cell (c) levels. Data are presented as the average of the six ARS values across all experiments in this scenario. These methods are ordered according to their performance
Scenario 5: evaluating accuracy performance over different clinical statesIn this scenario, we assess the ability of the methods to transfer between datasets with biological variations. We use three datasets: CITE-PBMC-Haniffa [30], CITE-PBMC-Sanger [31], and CITE-PBMC-Li. The first two datasets are related to COVID-19, while the last one pertains to human immunodeficiency virus (HIV). The CITE-PBMC-Haniffa dataset includes data from volunteers with varying illness severity, healthy volunteers, and patients with severe non-COVID-19 respiratory illnesses. We design two experiments: one using data from healthy volunteers to infer data from critical patients, and another using data from non-COVID-19 acute respiratory disease patients to infer data from asymptomatic individuals. For benchmarking, we randomly select five samples each from the healthy volunteer and critical patient groups due to their large data size. To minimize the influence of randomness on the benchmark results, we perform five repetitions of the experiment. The CITE-PBMC-Sanger dataset categorizes patients by treatment severity. We first use data from asymptomatic patients not requiring oxygen therapy as the training dataset and data from symptomatic patients not requiring oxygen therapy as the test dataset. Next, we use data from symptomatic patients not requiring oxygen therapy as the training dataset and data from symptomatic patients requiring extracorporeal membrane oxygenation (ECMO) therapy as the test dataset. The CITE-PBMC-Li dataset includes data from eight volunteers before and after HIV vaccination. We design two experiments: one using pre-vaccination data (Day0) as the training set and data from the third day post-vaccination (Day3) as the test set, and the other using Day0 data as the training set and data from the seventh day post-vaccination (Day7) as the test set. In the CITE-PBMC-Li: Day0\(\rightarrow\)Day3 experiment, we randomly select data from four volunteers before vaccination as the training set, and use data from the remaining four volunteers collected on the third day post-vaccination as the test set. The same experimental setup is also applied in the CITE-PBMC-Li: Day0\(\rightarrow\)Day7 experiment. To reduce the impact of randomness in training and test set partitioning on the benchmark results, we perform five repetitions for each experiment. In total, 18 experiments are conducted. Among these, the experiments involving CITE-PBMC-Haniffa: Healthy\(\rightarrow\)Critical, CITE-PBMC-Li: Day0\(\rightarrow\)Day3, and CITE-PBMC-Li: Day0\(\rightarrow\)Day7 are each repeated five times to account for sampling randomness.
Benchmark results for protein-level metrics indicate that moETM consistently achieves superior performance across all experiments (Fig. 6a–c and Additional file 2: Fig. S5). Notably, in the four COVID-19 experiments, moETM significantly surpasses other methods, while in the remaining two experiments, scMoGNN demonstrates performance comparable to moETM. This trend remains consistent across repeated experiments (Additional file 2: Fig. S6). In this scenario, characterized by significant technical differences and biological variations, cTP-net’s performance decreases significantly compared to scenarios 1 and 2 (Figs. 2, 3, 6 and Additional file 2: Figs. S1, S2, S5), highlighting its limitations in handling batch differences without correction. For cell-level metrics, the results vary across experiments (Fig. 6a–c and Additional file 2: Fig. S5). No single method achieves the best performance in all experiments, and the rankings of methods vary considerably. Finally, we employ the ARS to assess the overall performance of these methods in this scenario. To mitigate the impact of varying numbers of experiments on the evaluation results, for experiments with repetitions, the ARS is calculated based on the median evaluation metric values across five repetitions. Overall, the top three methods by ARS at the protein level are moETM, Seurat v3 (PCA), and scMoGNN (Fig. 6d). At the cell level, the top three methods are Seurat v3 (PCA), Seurat v4 (PCA), and scMoGNN (Fig. 6e).
Fig. 6
Comparison of quantitative evaluation metrics among methods over different clinical states. a–c Boxplots for PCC or RMSE of each method in the CITE-PBMC-Haniffa: Healthy\(\rightarrow\)Critical (a), CITE-PBMC-Sanger: Asymptomatic\(\rightarrow\)Symptomatic (b), and CITE-PBMC-Li: Day0\(\rightarrow\)Day3 experiments (c). The boxplots display values calculated at the protein or cell level. In (a and c), the results represent all five repetitions of the experiments, with all values at the protein or cell level across these repetitions included in the boxplot, where each point indicates the evaluation metric value of a protein or cell from the five repetitions. Center line: median; box limits: upper and lower quartiles; whiskers: 1.5 times interquartile range. d, e Barplots for ARS value of each method at the protein (d) and cell (e) levels. Data are presented as the average of the six ARS values across all experiments in this scenario. These methods are ordered according to their performance
Scenario 6: evaluating accuracy performance over different protocolsWe delve deeper into the performance of imputation methods in the scenario where training and test datasets originate from different sequencing protocols. Four datasets are utilized: CITE-PBMC10K-10X [32], CITE-PBMC5K-10X [33], CITE-PBMC-Stoeckius, and REAP-PBMC-Peterson [6]. The primary distinction between the first two datasets lies in their sequencing depths [18]. For each pair of datasets, two experiments are conducted, alternating between using one dataset as the training dataset and the other as the test dataset. The latter two datasets differ in sequencing technologies. We also perform two experiments using these latter two datasets. Thus, a total of four experiments are conducted in this scenario.
Upon summarizing the results of these experiments (Fig. 7a), we observe that Seurat-based methods consistently exhibit superior generalization capabilities across all experiments. Their performance remains among the top regardless of the evaluation metrics employed. Seurat v4 generally outperforms Seurat v3, except in the CITE\(\rightarrow\)REAP experiment. Notably, comparing the outcomes of experiments with reciprocal training and test datasets unveils an intriguing finding: leveraging the REAP-PBMC-Peterson dataset as the training dataset yields superior imputation performance compared to using the CITE-PBMC-Stoeckius dataset. Based on the average ARS values across all four experiments, Seurat v4 (PCA), Seurat v4 (CCA), and Seurat v3 (CCA) emerge as the top performers for protein-level metrics (Fig. 7b). Conversely, for cell-level metrics, the leading methods are Seurat v4 (PCA), Seurat v4 (CCA), and Seurat v3 (PCA) (Fig. 7c).
Fig. 7
Comparison of quantitative evaluation metrics among methods over different protocols. a Heatmaps for PCC or RMSE of each method in each experiment of this scenario. The horizontal axis represents each method and the vertical axis represents each experiment. The values are the median across all proteins or cells. b, c Barplots for ARS value of each method at the protein (b) and cell (c) levels. Data are presented as the average of the four ARS values across all experiments in this scenario. These methods are ordered according to their performance
Evaluating usability in terms of time and memoryWe evaluate the usability of different imputation methods in terms of time and memory. Using a computational platform with a 16,896 KB L3 Cache, 48 CPU cores, and an NVIDIA Tesla V100 GPU, we conduct experiments on the CITE-BMMC-Stuart dataset. Following the settings from scenario 2, we use various training data rates (from 10 to 100% in 10% intervals), where the training data rate is equivalent to 1 minus the down-sampling rate in scenario 2. To reduce biases caused by fluctuations in the experimental environment and enhance the reliability and robustness of the evaluation results, we perform five repeated experiments for each training data rate.
From the running time trends shown in Fig. 8a, which is based on the medians of the repeated experiments, and the specific recorded values presented in Additional file 1: Table S3, several patterns emerge. cTP-net requires significantly more time than the other methods, often exceeding 11 h, mainly due to its data denoising process with SAVER-X [34]. Other methods can be grouped into three categories based on their running times. TotalVI and scMOG have longer but relatively stable running times across different training data rates. In contrast, sciPENN, Babel, and moETM are the most time-efficient methods, completing tasks in under a minute. While their running times slightly increase with higher training data rates, they remain significantly faster than the other methods. The remaining methods show a clear increase in running time as the training data rate rises. Notably, Seurat v4 is slower than Seurat v3 at lower training data rates, likely due to its more complex preprocessing. However, as the training data rate increases, Seurat v3 becomes slower than Seurat v4, indicating greater sensitivity to training dataset size. Moreover, CCA is slower than PCA within Seurat. Additional file 1: Table S3 presents the detailed running times for each method across repeated experiments. Although variability is observed in some repetitions, the fluctuations remain consistently within a reasonable range.
Fig. 8
Comparison of running time and memory usage among methods. a, b Line plots for running time (a) and memory usage (b) as the training data rate changes. The horizontal axis represents the training data rate. The vertical axis shows the running time in \(\log _\) minutes (a) or memory usage in GB (b). The values for running time and memory usage are based on the median of the five repetitions. Each line represents a method
Regarding memory usage, as shown in Fig. 8b, which is based on the medians of the repeated experiments, and Additional file 1: Table S4, the methods can be divided into three groups. At higher training data rates, both scMOG and scMoGNN exceed 20 GB in memory usage, significantly surpassing the other methods, with scMoGNN showing a more pronounced increase compared to scMOG. The excessive memory usage of scMOG and scMoGNN may be attributed to the pretraining mechanism and the incorporation of graph structures, respectively. cTP-net uses between 10 and 20 GB, with usage increasing as the training data rate rises, likely due to data denoising. The remaining methods use less than 10 GB, with minor variations. Within Seurat, memory usage does not depend on the dimensionality reduction method but is slightly higher for Seurat v4 than Seurat v3. Additional file 1: Table S4 records the detailed memory usage for each method across repeated experiments. The results show that memory usage exhibits less fluctuation than running time across repetitions.
Overall summary of benchmark resultsWe summarize the performance of these methods across four primary dimensions: accuracy, sensitivity to training data size, robustness across experiments, and usability. The accuracy of each scenario is defined as the mean average rank score (ARS) values of different experiments within that scenario, while the overall accuracy is evaluated by the mean ARS values across all scenarios. Sensitivity to training data size is assessed using two metrics: rank score of increments of accuracy performance, which quantifies the variability of methods with changes in training data size, and average-increment composite score (AICS), which considers both the average performance of methods and their variability to training data size to reflect the effectiveness of models. This evaluation is conducted in scenario 2. Robustness across experiments is evaluated by the robustness composite score (RCS), which is calculated based on the ARS values from all experiments with technical and biological differences, indicating the stability and competitiveness of accuracy across these real-world-like experiments. These experiments are conducted on the scenarios of different samples, tissues, clinical states, and protocols, resembling experiments in real-world application scenarios. Both accuracy, sensitivity to training data size, and robustness across experiments are examined at both the protein and cell levels. Usability encompasses time, memory, and quality. For time and memory, we calculate both the mean and increment relative to the training data size using the results recorded in Fig. 8. These metrics provide insights into the efficiency of the methods and their variability to training data size, respectively. Quality is measured through popularity and user-friendliness. The popularity is represented by the number of stars on each method’s official GitHub repository (last updated on 15 December 2024). We score the user-friendliness of methods based on three aspects: installation, code, and tutorial. Each method starts with 5 points in each aspect, with points deducted for any identified issues. The user-friendliness score for each method is then calculated by summing the points across all three aspects. The overall benchmark results are summarized in Fig. 9 and the accuracy evaluation results for specific scenarios are shown in Additional file 2: Fig. S7. Based on the results of our study, we draw several findings.
Fig. 9
Overall summary of benchmark results for the methods. a Names of the twelve methods and their primary programming languages. Methods are categorized into three main classes based on their imputation strategies. b Evaluation of accuracy using mean ARS values across different scenarios. Methods are compared based on the mean ARS values, with better performance indicating more accurate imputation performance. Longer rectangular bars and lighter colors denote better performance. c Sensitivity analysis of accuracy performance to training data size using the rank score of increments and AICS. Methods are compared based on these criteria, with better performance indicating less variability to training data size or greater effectiveness. Longer rectangular bars and lighter colors denote better performance. d Robustness assessment across experiments with technical and biological differences using RCS. Methods are compared based on the RCS values, with better performance indicating more robust imputation performance. Longer rectangular bars and lighter colors denote better performance. e Usability evaluation in terms of time, memory, and quality. Time and memory are assessed using data from Fig. 8, with better performance indicating greater efficiency or less variability to training data size. Quality is evaluated based on popularity and user-friendliness, with better performance indicating more popular or user-friendly methods. Longer rectangular bars and lighter colors denote better performance. In each evaluation, the top three methods are marked with stars: three stars for the best-performing method, two stars for the second-best, and one star for the third
In terms of accuracy, we observe that at the protein level, benchmark results vary across scenarios. Notably, cTP-net tends to show superior performance primarily in scenarios without batch differences (Additional file 2: Fig. S7b, left), likely because it transfers networks learned in the training dataset to the test dataset without performing batch correction. Conversely, moETM and scMoGNN perform well in scenarios with batch differences (Additional file 2: Fig. S7b, left), highlighting the strengths of joint representations and graph neural networks in handling such complexities. Seurat-based methods consistently are the top three methods in all scenarios except for different samples (Additional file 2: Fig. S7b, left), with Seurat v4 (PCA) leading overall (Fig. 9b, left). At the cell level, Seurat-based methods consistently show superior performance (Fig. 9b, right), utilizing mutual nearest neighbor cells to achieve accurate protein abundances in individual cells. Among these methods, PCA-based dimensionality reduction yields better results than CCA (Fig. 9b, right). Notably, in scenarios with biological variation embedded in batch differences, such as different clinical states, scMoGNN performs comparably to Seurat-based methods (Additional file 2: Fig. S7b, right), underscoring the advantages of higher-order topological relationships in complex batch differences.
In terms of sensitivity to training data size, we find that at the protein level, cTP-net, Seurat v4 (PCA), and Seurat v4 (CCA) are the most effective (Fig. 9c, left). In Seurat-based methods, PCA-based dimensionality reduction exhibits greater variability to training data size compared to CCA (Fig. 9c, left). At the cell level, the most effective methods are Seurat v4 (PCA), Seurat v4 (CCA), and Seurat v3 (PCA) (Fig. 9c, right). Among these, Seurat v4 (PCA) consistently demonstrates excellent performance across various training dataset sizes (Fig.
Comments (0)