
Remember me

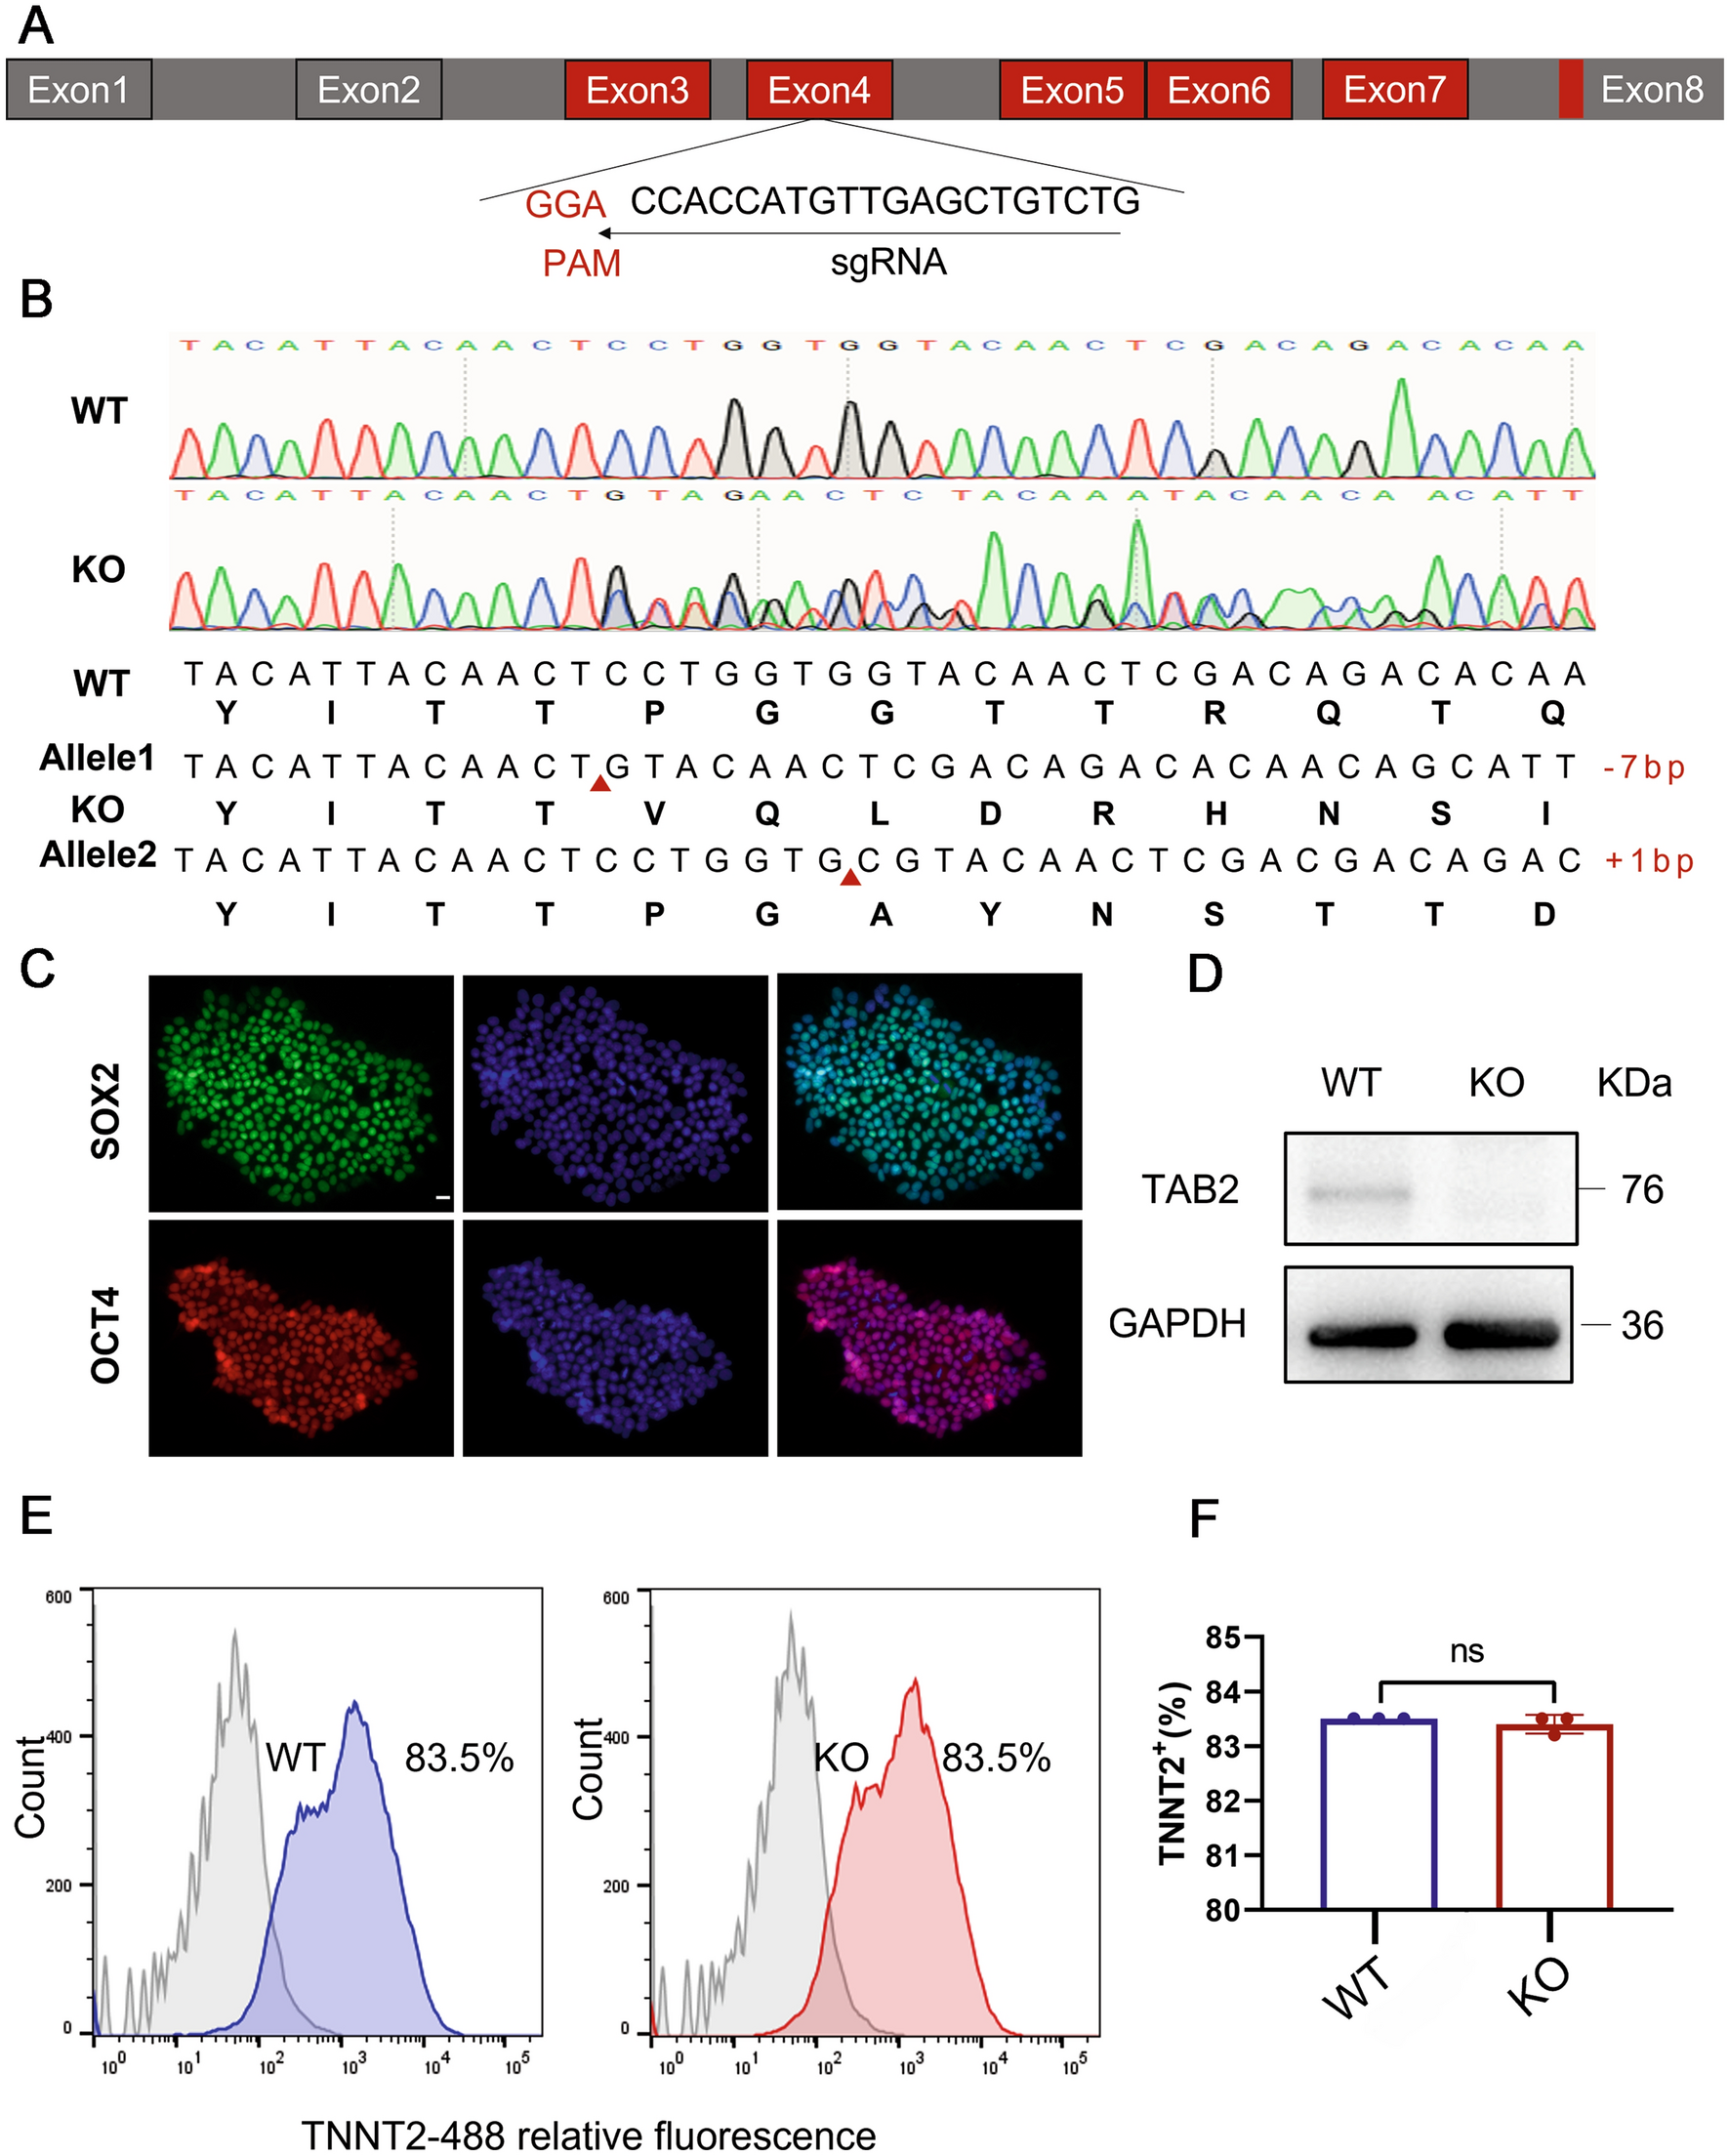


In order to knock out the TAB2 gene as effectively as possible, we designed a knockout gRNA targeting the fourth exon of the TAB2 gene (Fig. 1A). Plasmid vectors containing gRNA and CRISPR/Cas9 were electroporated into human induced pluripotent stem cells. After amplification, DNA was extracted from the positive puromycin clones, and Sanger sequencing was carried out to confirm the knockout. Among the 14 clones analyzed, a single clone was identified, exhibiting a compound heterozygous knockout of TAB2. This was characterized by the insert of 1 and absence of 7 nucleotides on the two alleles, respectively (Fig. 1B). We reveal that the TAB2 knockout cell line retained embryonic stem cell morphology, such as high nucleo-plasmic ratios and densely packed clones (Fig. S1A). We further confirmed that TAB2−/− cell lines expressed the human pluripotency-related genes (NANOG, OCT4, SOX-2 and REX1) as WT cells in RT-qPCR (Fig. S1B). Meanwhile, immunofluorescence staining revealed that the cell line exhibited the stemness markers OCT4 and SOX2 (Fig. 1C). Flow-cytometry analysis showed that there was no significant difference in SSEA4 positive rate between WT and KO cells (Fig. S1C, D). Moreover, we predicted the top three off-target sites for sgRNA using an online analysis software (crispr.mit.edu) and found no off-target mutations in TAB2−/− hiPSCs by DNA sequencing (Additional file 2). Additionally, we confirmed through PCR that the CRISPR/Cas9 plasmid did not undergo random integration into the genome (Supplementary File 1).
Fig. 1
TAB2 knockout does not affect the pluripotency of hiPSCs and differentiation into hiPSC-CMs with CHIR99021 and Wnt-C59. A Structure of the TAB2 locus showing localization of gRNA for epiCRISPR/Cas9 editing. B Sequence chromatograms demonstrate a homozygous TAB2 gene KO line in which 1 allele deleted 7 nucleotides (CCTGGTG) and another allele inserted 1 nucleotide (C). C Immunofluorescence staining of TAB2-KO colonies for the pluripotency markers SOX2 and OCT4. Scale bar, 20 μm. D Immunoblot analysis of TAB2 in WT and TAB2 KO CMs at day 20 (n = 3). E,F Flow cytometry analysis for TNNT2 from representative WT and TAB2 KO differentiation protocols prior to purification at day 13 (n = 3). The results are presented as means ± SEMs of 3 independent experiments. ns, not significant, unpaired 2-sided Student’s t test
TAB2-deficient hiPSCs can differentiate into CMsWe first added small molecule compounds to TAB2-knocked out hiPSCs to enhance the induction of cardiomyocyte differentiation due to the crucial role of TAB2 in myocardial development (Burridge et al. 2014; Thienpont et al. 2010; Woods et al. 2022). Following this, the deletion of TAB2 protein in knockout (KO) cardiomyocytes was confirmed through Western Blot analysis at day 20, showing the absence of TAB2 protein expression (Fig. 1D). Subsequently, the differentiation efficiency of cardiomyocytes was assessed using flow cytometry. Notably, on the 13th day of myocardial differentiation, both wild-type (WT) and TAB2 KO-derived cardiomyocytes exhibited a differentiation efficiency of 83.5% (Fig. 1E, F). The purity of both WT and KO cardiomyocytes reached 98% by the 17th day after sugar starvation purification, with no significant discrepancies observed (Fig. S1E, F). These findings collectively indicate that the knockout of TAB2 does not impede the differentiation of cardiomyocytes.
TAB2-deficient hiPSC-CMs replicate DCM characteristics in vitroFollowing the findings by Eschenhagen and Carrier (2019), which identified myotome disturbance as a prevalent phenotype of Dilated Cardiomyopathy (DCM), our study focuses on the structural alterations in TAB2-knockout cardiomyocytes. Our investigation revealed that at the 30-day mark post-myocardial differentiation, TAB2-deficient cardiomyocytes exhibited a noticeable increase in the occurrence of sarcomere disorganization compared to wild-type (WT) cells, as evidenced by a significant rise in CTNT and actinin immunofluorescence staining (Fig. 2A, B).
Fig. 2
Phenotyping dilated cardiomyopathy in TAB2-deficient hiPSC-CMs. A,B Immunostaining of sarcomeric α-actinin (green) and cTnT (red) demonstrates sarcomeric disarray in WT (n = 269) and TAB2 KO (n = 285) CMs at day 30. Scale bar, 20 μm. C Representative heatmaps and line scan images in WT, TAB2-KO hiPSC-CMs myocardial contractility at days 30, 40, and 50. D–F Quantification of total force tot, relaxation velocity, and contraction velocity in WT and TAB2-KO hiPSC-CMs (n = 10 cells per group). G,H Quantitative real-time-PCR analysis of HF-related genes in WT, TAB2-KO hiPSC-CMs at days 30, 40, and 50 (n = 9). The results are presented as means ± SEMs of 3 independent experiments. * P < 0.05; ** P < 0.01; *** P < 0.001; ns, not significant, unpaired 2-sided Student’s t test
Cardiomyocyte contraction plays a fundamental role in maintaining the heart’s essential function (Penefsky 1994), with one of the primary indicators of dilated cardiomyopathy (DCM) being the reduction in systolic function (Hinson et al. 2015). To assess the impact of TAB2 knockout on cardiomyocyte contractility, we conducted contractile force measurements on human induced pluripotent stem cell-derived cardiomyocytes (hiPSC-CMs) at 30, 40, and 50 days, and KO cells exhibit a phenotype of arrhythmia potential (Fig. 2C). The contractile amplitude of TAB2-KO cardiomyocytes exhibited a significant decrease compared to wild-type (WT) at the outset, and this decrease further amplified over time (Fig. 2D). Additionally, both the diastolic and contractile rates of TAB2-KO cardiomyocytes displayed noticeable declines as well (Fig. 2E, F). Furthermore, we also observe that other contractility parameters, such as mean contractility displacement, contractility time, and beating frequency, change with variations in culture time (Fig. S2A–H). From day 40 onwards, we observed a significant increase in the expression levels of ANP and BNP in TAB2 knockout cells, suggesting a progression towards heart failure (Fig. 2G, H).
TAB2 deficiency leads to abnormal cardiac calcium transientsCalcium transient abnormalities were often found in cardiomyocytes of dilated cardiomyopathy (Malkovskiy et al. 2020). Simultaneously, abnormal calcium processing is one of the primary causes of decreased contractility (Perreault et al. 1990). To investigate the impact of TAB2 knockout on the regulation of calcium in the heart, we integrated the calcium sensor Green fluorescent calmodulin 6 Rapid type (GCaMP6f) into the TAB2-KO cell line at the AAVS1 locus (Fig. S3A), aiming to detect any alterations in calcium transients at 30, 40 and 50 days (Fig. 3A). Initially, on day 30, there was no noticeable difference in calcium release amplitude (Fig. 3B) between wild-type (WT) and TAB2 knockout (KO) cardiomyocytes, which contradicted the observed change in contractility. However, by day 40, a decrease in calcium release amplitude was evident in KO hiPSC-CMs compared to the WT (Fig. 3C), accompanied by extended time to peak and decay time (Fig. 3D, E). Subsequently, by day 50, this trend became even more pronounced (Fig. 3C–E). In addition, we found that the calcium transient duration of the knockout cell line and the diastolic calcium ion concentration increased significantly on day 40 and continued to rise (Fig. 3F, G). These findings suggest that the abnormalities in calcium transients are likely not the primary cause of the reduced contractility observed in TAB2-knocked out hiPSC-CMs.
Fig. 3
TAB2-deficient hiPSC-CMs exhibit abnormal Ca2+ handling properties. A Representative line-scan images in WT-GCaMP and TAB2 KO-GCaMP hiPSC-CMs at days 30, 40, and 50. B Space-averaged calcium transients showing parameters measured for analysis of calcium handling. C–G Quantification of peak, decay time, time to peak, calcium transient duration and calcium diastolic concentration in WT-GCaMP and TAB2 KO-GCaMP hiPSC-CMs (n = 10 cells per group). H Representative Ca2+ transients induced with 10 mM caffeine in Ca2+-free conditions between WT-GCaMP and TAB2 KO-GCaMP hiPSC-CMs at days 30, 40, and 50. I,J Peak amplitude and decay time in caffeine-evoked Ca2+ transients WT-GCaMP and TAB2 KO-GCaMP hiPSC-CMs (n = 7 cells per group). K–M Quantification of ATP2A2, CACNA1C and RYR2 normalized by GAPDH in WT and TAB2 KO hiPSC-CMs (n = 9). Results are presented as means ± S.E.M. of three independent experiments. * P < 0.05; ** P < 0.01; *** P < 0.001; **** P < 0.0001; ns, not significant, unpaired two-sided Student’s t test
Since TAB2 knockouts lead to increased diastolic calcium concentrations, we conducted SR-caffeine-induced calcium release experiments on 30-, 40-, and 50-day-old wild-type (WT) and TAB2 KO-hiPSC CMs to further understand the properties of calcium handling (Fig. 3H). Consistent with the above calcium transient results, the calcium release amplitude and reuptake rate of KO cardiomyocytes began to decrease significantly at day 40 compared with WT (Fig. 3I, J). This indicates that TAB2 knockout in hiPSC-CMs reduced sarcoplasmic reticulum calcium storage and impaired membrane and SR Ca2+ pump function. Supporting this conclusion, there was increased gene expression of SERCA2a, CACNA1C and RYR2 (Fig. 3K–M). This provides further evidence of the impaired calcium handling in the TAB2 KO cells. However, it was confirmed once again that calcium ion homeostasis imbalance was not the priming cause of the development of dilated cardiomyopathy (DCM) resulting from TAB2 deficiency.
TAB2 deficiency leads to mitochondrial damage reduced energy metabolismTo gain insight into the molecular mechanism via which TAB2 wiped out the phenotype associated with dilated cardiomyopathy in cardiomyocytes, we employed RNA-Seq techniques to detect and analyze variations in gene expression profiles between groups of WT and KO cardiomyocytes (Fig. 4A). The results revealed significant differences between WT and KO cardiomyocytes (Fig. S3B), with 1381 genes altered in KO cells compared to WT, including 983 genes with significantly increased expression and 398 genes with dramatically decreased expression (Fig. S3C). Then, we conducted a Gene Ontology (GO) analysis on the sequencing results and found that the cardiomyocytes with TAB2 knockout exhibited significant pathological growth and remodeling (Fig. S3D). Subsequently, we performed KEGG (Kyoto encyclopedia of genes and genomes) analysis on the sequencing results gathered from WT and KO cells to explore the differences in the activity state of signaling pathways between the two groups (Fig. 4B). Cardiomyopathy and heart failure-related pathways were significantly enriched in KO cardiomyocytes compared to WT cardiomyocytes. Furthermore, KO cardiomyocytes were considerably enriched in calcium signal-related pathways, which was in line with the results of our previous calcium transient study (Fig. 4C). Perhaps more importantly, KO cardiomyocytes exhibited significantly elevated levels of mitochondria-associated pathways, such as PI3K-AKT, Apelin and TNF signaling pathways (Fig. 4D), as well as apoptosis and necroptosis (Fig. S3E, F), suggesting mitochondrial damage in TAB2-deficient cardiomyocytes. In addition, we also confirmed that the expression levels of signaling pathway-related proteins SERCA2a, P-AMPK and P-CAMKII altered significantly in knockout cell lines compared to wild type (Fig. 4E–H).
Fig. 4
Transcriptome analysis in TAB2 deficient and WT CMs. A RNA-Seq was used to detect differentially expressed genes in WT and KO hiPSC-CMs (n = 3). B KEGG analysis of pathway enrichment changes in KO hiPSC-CMs. C Heatmap shows expression changes of genes related to calcium signaling pathway in WT and KO CMs at days 40. D Heatmap shows expression changes of genes related to PI3K-Akt, Apelin TNF, TGF-beta, Hippo and AMPK signaling pathway in WT and KO CMs at days 40. E–H Western blot shows expression of SERCA2a, P-AMPK and P-CAMKII proteins in WT and KO CMs, respectively (n = 3). Results are presented as means ± S.E.M. of three independent experiments. * P < 0.05; ** P < 0.01; unpaired two-sided Student’s t test
The heart primarily depends on mitochondrial oxidative metabolism to fulfill approximately 95% of its energy requirements (Doenst et al. 2013). Therefore, insufficient cellular energy is also a significant reason for the notable reduction in contractile force. ATP, as a direct source of energy, is our primary detection index. We measured ATP levels in both groups of cells at day 30, 40 and 50 (Fig. 5A). These results indicate that TAB2 knockout cardiomyocytes have a reduced energy supply, which manifests as a heart failure phenotype.
Fig. 5
Mitochondrial damage and calcium overload in TAB2-deficient CMs. A ATP content measure in WT and KO cardiomyocytes at day 30, 40 and 50 (n = 3). B Immunostaining of Mitotracker Green in WT and KO hiPSC-CMs at day 30. C,D Quantification of Mitotracker Green intensity obtained by flow cytometry in TAB2-KO hiPSC-CMs at days 30, 40, and 50 as compared with WT hiPSC-CMs (n = 3). E,F Quantification of Cell ROS Green intensity obtained by flow cytometry in TAB2-KO hiPSC-CMs at days 30, 40 and 50 as compared with WT hiPSC-CMs (n = 3). G Immunostaining of Rhod-2, AM in WT and KO hiPSC-CMs at day 25. H Quantitative analysis of Rhod-2 AM immunofluorescence intensity (n = 13 cells per group). I–K Immunoblot analysis of RIPK1 and MCU in WT and TAB2 KO hiPSC-CMs (n = 3). Results are presented as means ± S.E.M. of three independent experiments. * P < 0.05; ** P < 0.01; *** P < 0.001; **** P < 0.0001; ns, not significant, unpaired two-sided Student’s t test
To accurately assess the mitochondrial density of cardiomyocytes, the 30-day-old cells were stained using immunofluorescence. The mitochondrial content of KO iPSC-CMs was significantly reduced compared to the control group (Fig. 5B). At the same time, the fluorescence intensity of WT and KO cardiomyocytes incubated with MitoTracker was detected using flow cytometry (Fig. 5C, D). We observed a significant decrease in the fluorescence intensity of mitochondria in the experimental group at 30 days, which continued to deteriorate over time. Next, we also measured the mitochondrial content of WT and KO iPSC-CMs by comparing the ratio of mitochondria-specific ND1 and ND2 genes to the housekeeping gene ACTB at 30, 40, and 50 days in the two sets of cells (Fig. S4A, B). Similar to flow cytometry, the mitochondrial DNA (mtDNA) to nuclear DNA (nDNA) ratio of KO cardiomyocytes was significantly lower than that of WT cells at 30 days.
TAB2 deficiency causes mitochondrial calcium overload through MCU activationMitochondria play a crucial role as the primary energy source of cells while also regulating intracellular Ca2+ homeostasis, intermediate metabolite/ROS production, and various cellular processes (Wang et al. 2018). ROS, generated by cardiomyocytes primarily from mitochondria during aerobic metabolism (Chouchani et al. 2014; Scialo et al. 2016), have been linked to several heart conditions. To assess ROS levels, we utilized DCFH-DA to measure ROS content in WT and KO cardiomyocytes (Fig. 5E, F). Notably, at day 30, there was no significant difference observed between WT and KO cells. However, at day 40, an evident increase in fluorescence intensity was noted in KO cells, suggesting that ROS may not be an initial factor in mitochondrial damage progression. In addition, the cells were immunofluorescently stained with DCFH-DA probes on day 40 to re-validate the flow cytometry results and confirm the increased ROS levels in the KO cells (Fig. S4C, D).
The pivotal transduction signals between the sarcoplasmic reticulum (SR) and mitochondria are Ca2+ and ROS (Li et al. 2015; Yan et al. 2008), with mitochondrial calcium levels governing various mitochondrial functions. Utilizing RHOD-2, AM fluorescence probes, we evaluated mitochondrial calcium ion levels in WT and KO cardiomyocytes on day 25. Immunofluorescence imaging revealed a considerable rise in mitochondrial calcium content in KO cells (Fig. 5G, H). Flow cytometry measurement of RHOD fluorescence intensity further confirmed the significant increase in KO cells on day 25 (Fig. S4E, F). These observations indicate that mitochondrial calcium overload in TAB2 gene knockout cardiomyocytes preceded the ROS increase.
Mitochondrial Ca2+ influx primarily occurs through the mitochondrial calcium uniporter (MCU), while the mitochondrial Na+–Ca2+–Li+ exchanger (mNCLX) facilitates calcium expulsion (Brown and O’Rourke 2010; Campanella et al. 2004; Palty et al. 2010). Notably, we observed a pronounced elevation in MCU protein content in the mitochondrial inner membrane of KO cardiomyocytes, indicating increased MCU expression (Fig. 5I, J). Previous studies have shown that RIPK1 enhances MCU expression by interacting with it (Zeng et al. 2018), and in TAB2 knockout mice, TAB2 deficiency promotes RIPK1-dependent apoptosis and necrotic apoptosis by upregulating RIPK1 expression and activation (Yin et al. 2022). Consistently, we found elevated RIPK1 expression in KO cells during our experiments (Fig. 5I, K).
To further confirm that the knockout of TAB2 results in impaired cardiomyocyte function independent of cell differentiation, we administered small interfering RNA to reduce TAB2 expression (Fig. S5A) on day 20 following cardiomyocyte differentiation. We assessed changes in contractility (Fig. S5B–E), calcium transients (Fig. S5F–I), mitochondrial content (Fig. S5J, K), and ROS levels (Fig. S5L, M) at day 40. Our findings indicate that the knockdown of TAB2 expression following cell differentiation still resulted in a phenotype characterized by impaired cardiac function.
RIPK1 inhibitors prevent TAB2-knocked out cardiomyocytes from developing DCM phenotypesConsidering that mitochondrial calcium overload triggered by RIPK1 activation precedes the DCM-associated phenotype, we explored whether RIPK1 inhibitors could potentially halt the progression of DCM and HF phenotypes in TAB2-knockout cardiomyocytes. Nec-1, an ATP-competitive allosteric inhibitor of RIPK1, is also known to significantly inhibit indoleamine 2,3-dioxygenase (IDO), which breaks down the essential amino acid tryptophan into kynurenine. The IDO-kynurenine pathway plays a critical role in regulating both the innate and adaptive immune systems and is also involved in neuroprotection (Liu et al. 2009). Nec-1s, also known as 7-Cl-O-Nec-1, is an optimized, more stable version of Nec-1 and was the inhibitor investigated in this study. Unlike Nec-1, Nec-1s specifically inhibits RIPK1 without affecting IDO activity (Yu et al. 2021). Considering that the cell phenotype is most stable on day 50, which aligns with clinical treatment practices, we selected day 50 for drug intervention. Cardiomyocytes were treated with a 10 μmol concentration of Nec-1s for 48 h on day 50 for both WT and KO groups. Post-intervention, we observed a decrease in the expression levels of RIPK1 and MCU in KO cardiomyocytes, with no significant difference compared to the WT group (Fig. 6A–C). Flow cytometry evaluation of mitochondrial content and ROS levels indicated that Nec-1s administration reduced mitochondrial damage and ROS production in TAB2-deficient hiPSC-CMs (Fig. 6D–G). At the same time, to further confirm that Nec-1s intervention can significantly improve the phenotype of TAB2-deficient cardiomyocytes, we performed qPCR experiments to detect the expression changes of mitochondrial genes ND1 and ND2. The results showed that after the intervention, the expression of ND1 and ND2 significantly increased (Fig. S6A, B). Additionally, Nec-1s intervention restored the calcium processing capacity of KO cardiomyocytes, manifesting in increased amplitudes of calcium (Fig. 6H, I), as well as an increase in the rate of calcium release and recovery, a decrease in calcium ion concentration during diastole (Fig. S6C–E). Furthermore, contractile force changes were detected in KO cardiomyocytes after the drug intervention (Fig. 6J, K), showing an increase in contractile and diastolic speed in KO cells treated with Nec-1s (Fig. S6F, G). Other parameters of contractile force were also significantly improved (Fig. S6H–N). These findings once again confirm that intervention with Nec-1s could potentially rescue TAB2 knockouts from DCM and HF phenotypes.
Fig. 6
Nec-1s rescued DCM phenotype in TAB2-deficient CMs. A–C Immunoblot analysis of RIPK1 and MCU in WT, TAB2-KO, WT + Nec-1s, and TAB2-KO + Nec-1s hiPSC-CMs at day 50 (n = 3). D,E Quantification of MitoTracker Green intensity obtained by flow cytometry fluorescence intensity in WT, TAB2-KO, WT + Nec-1s, and TAB2-KO + Nec-1s hiPSC CMs at day 50 (n = 3). F,G Quantification of Cell ROS (green) intensity obtained by flow cytometry fluorescence intensity in WT, TAB2-KO, WT + Nec-1s, and TAB2-KO + Nec-1s hiPSC CMs at day 50 (n = 3). H Representative line scan images in WT-GCaMP, TAB2 KO-GCaMP, WT-GCaMP + Nec-1s, and TAB2-KO-GCaMP + Nec-1s hiPSC-CMs at day 50. I Quantification of peak in WT-GCaMP, TAB2 KO-GCaMP, WT-GCaMP + Nec-1s, and TAB2-KO-GCaMP + Nec-1s hiPSC-CMs at day 50 (n = 10 cells per group). J Representative line scan images in WT, TAB2-KO, WT + Nec-1s, and TAB2-KO + Nec-1s hiPSC CMs myocardial contractility at day 50. K Quantification of total force tot in WT, TAB2-KO, WT + Nec-1s, and TAB2-KO + Nec-1s hiPSC CMs at day 50 (n = 10 cells per group). The results are presented as means ± SEMs of 3 independent experiments. * P < 0.05; ** P < 0.01; *** P < 0.001; ns, not significant, unpaired 2-sided Student’s t test. One-way ANOVA and least significant difference (LSD) test were used to compare the parameters between groups
Comments (0)