Cell culture
The Huh7 cell line was purchased from the Chinese Academy of Sciences Cell Bank (Shanghai, China), and the MHCC97-H cell line was purchased from Cellcook Biotech Co., Ltd. (Guangzhou, China). All cells were cultured at 37℃ using Dulbecco’s modified Eagle’s medium (DMEM, Gibco, USA) supplemented with 10% fetal bovine serum (FBS, Biological Industries, Israel) and 1% penicillin/streptomycin (Beijing Solarbio Science & Technology Co.,Ltd., China) in an incubator with 5% CO2.
Drug preparation
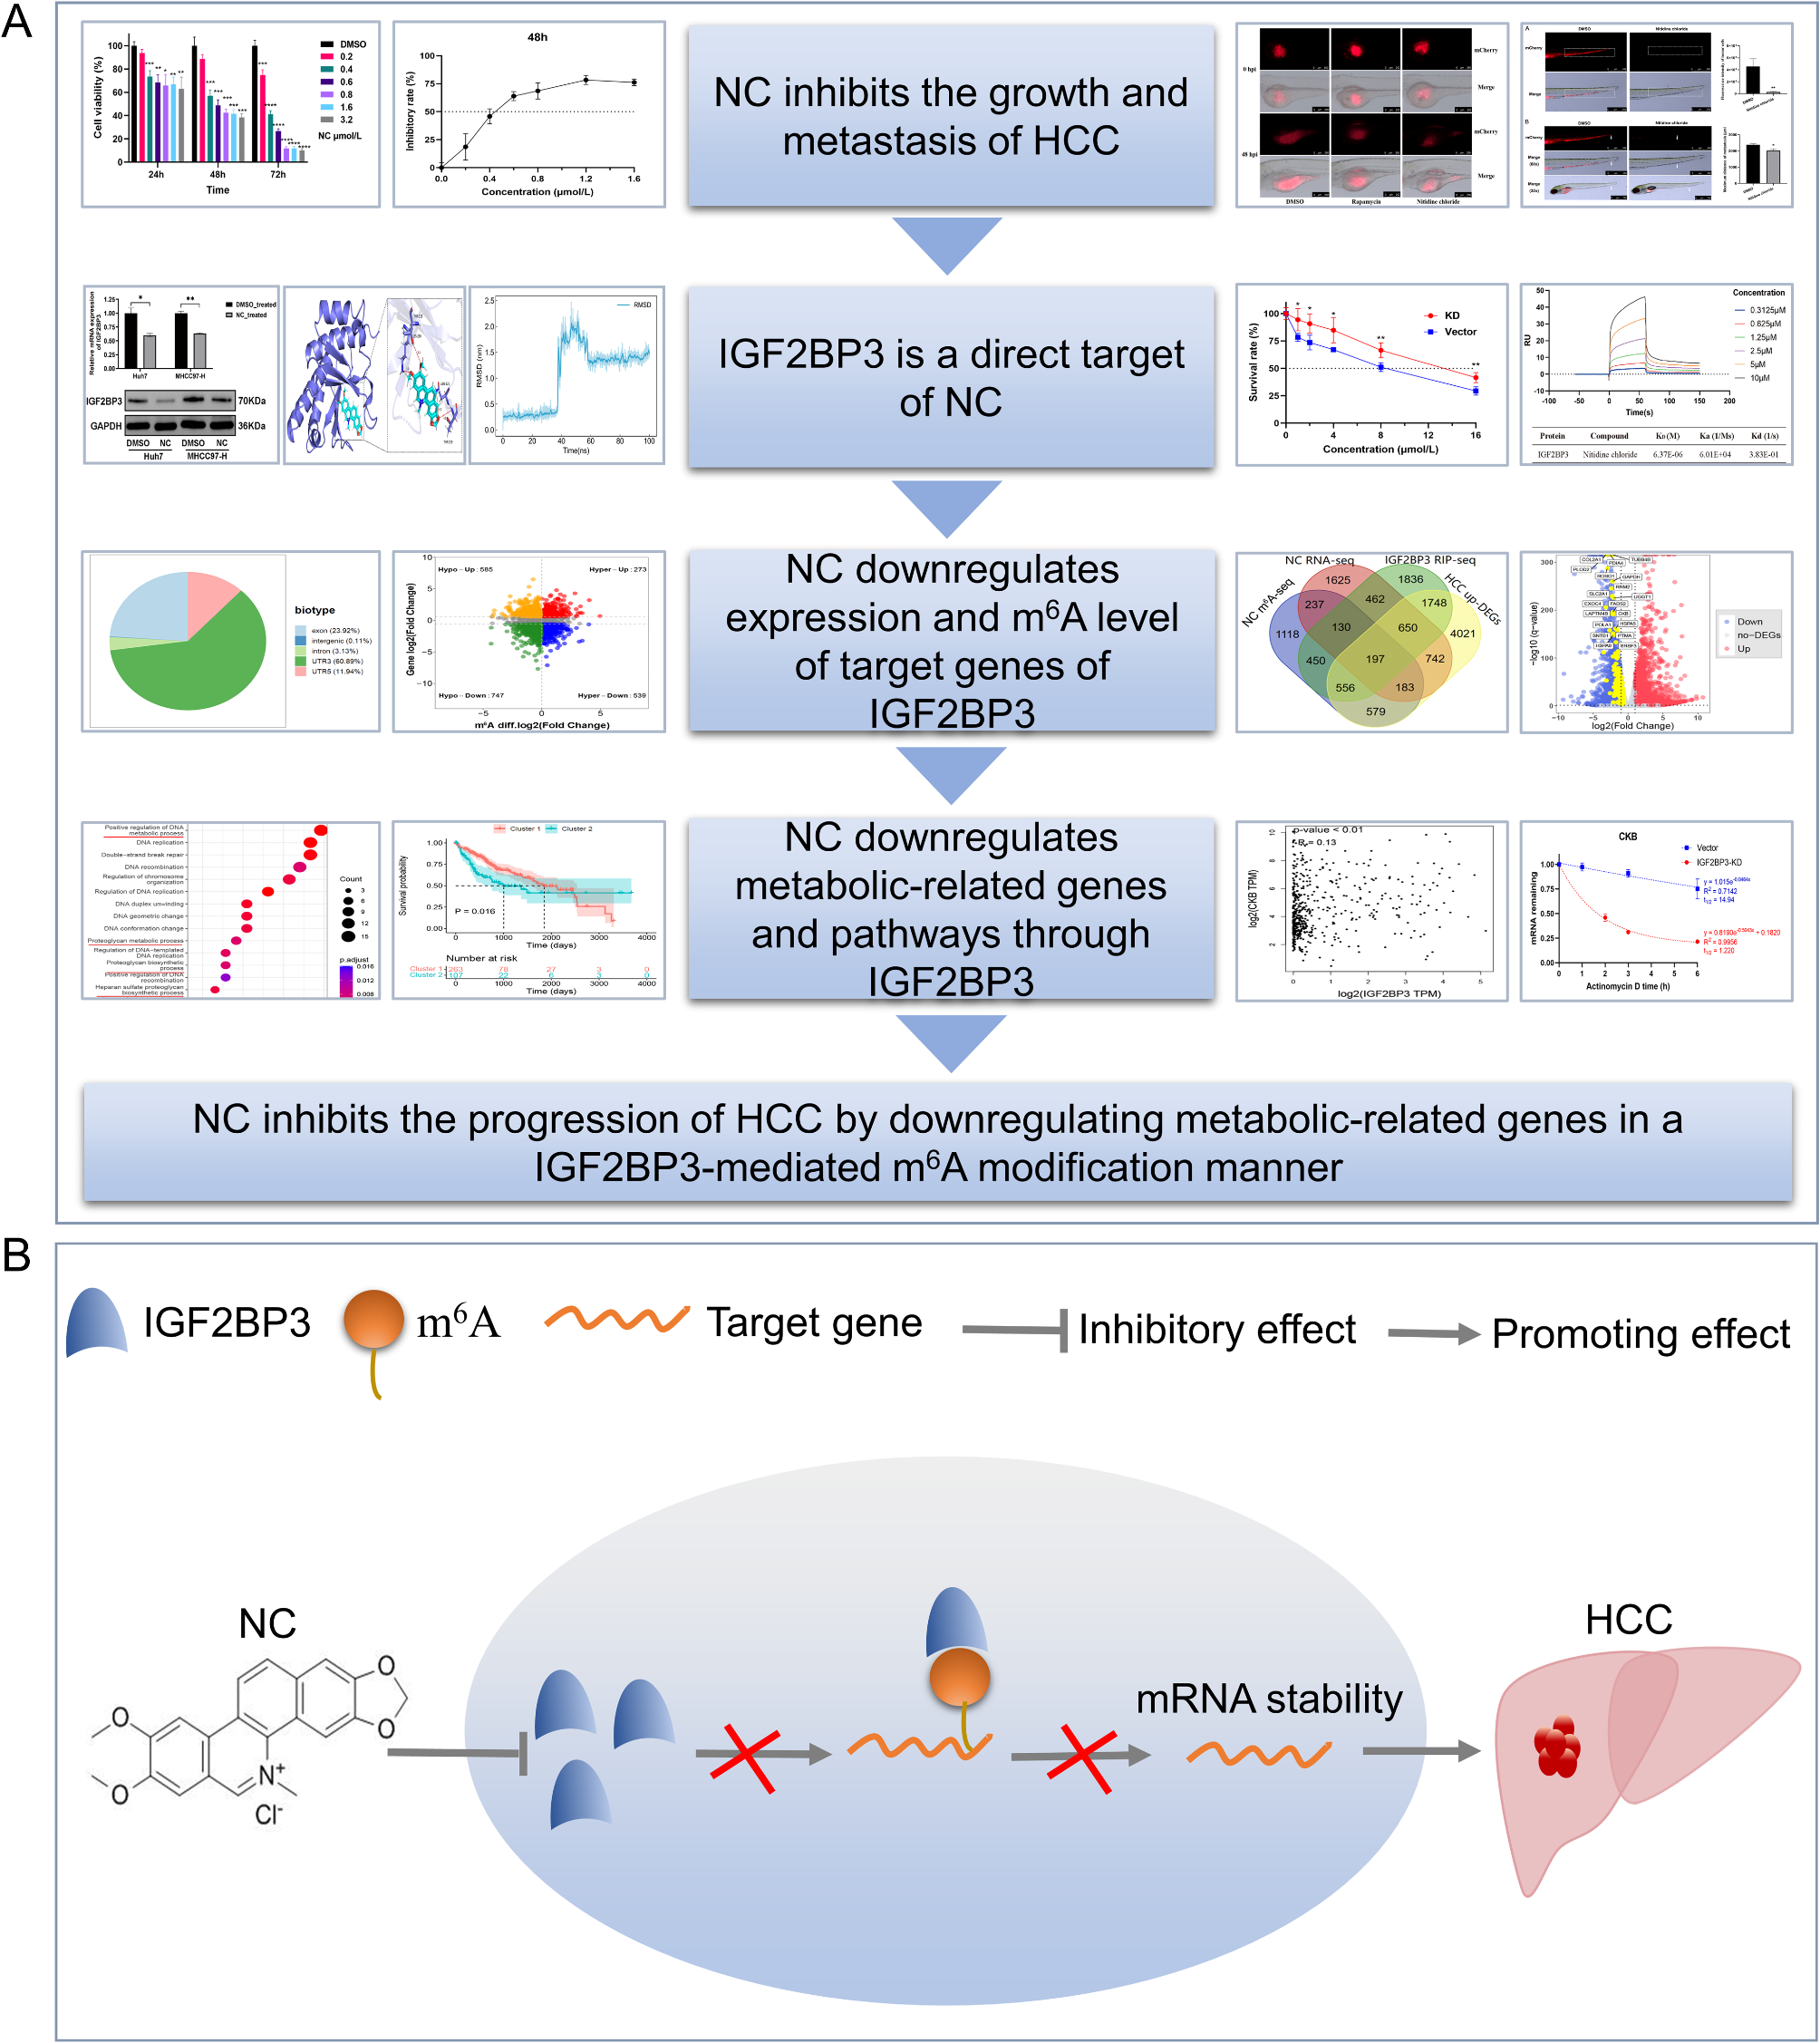
NC (96% purity) was obtained from Chengdu Herbpurify Co., LTD. (Chengdu, China). The NC was dissolved in dimethyl sulfoxide (DMSO), and then further diluted to the working concentration with medium.
In vivo studies in zebrafish
Zebrafish transplantation tumor models were established by microinjecting Huh7 and MHCC97-H cells, labeled with CM-DiI fluorescent dye, into the yolk sacs (for tumor growth studies) or yolk interstitials (for tumor angiogenesis and metastasis studies) of wild-type AB, Tg (kdrl: EGFP) and Tg (fli1a: EGFP) zebrafish embryos at 2 days post fertilization by microinjection, with 400–900 cells per embryo. All zebrafish were raised at 28℃ with specialized fish-culturing water. At 24 h after fertilization, 1-phenyl-2-thiourea (PTU) was added to inhibit melanogenesis. One day after tumor transplantation, drugs were administered via yolk sac injection at 24-hour intervals. Subsequently, the transplanted tumors before and after drug administration were photographed using in vivo fluorescence microscopy. The Fiji software was then utilized to analyze the effects of NC on the growth, angiogenesis, and metastasis of zebrafish transplanted tumors. After the experiment, zebrafish were anesthetized and humanely euthanized using tricaine methanesulfonate. All zebrafish experiments were approved by the Animal Research Committee of the First Affiliated Hospital of Guangxi Medical University and conducted in accordance with the National Research Council’s Guide for the Care and Use of Laboratory Animals.
Lentiviral transfection
Lentiviral vectors for IGF2BP3 knockdown and control vectors were purchased from Gikai (Shanghai, China). Cells were transfected with lentivirus at MOI = 20 and cell screening was performed in medium containing 2.5 µg/mL puromycin (Servicebio, China) to obtain IGF2BP3 knockdown cell lines with stable expression.
RT-qPCR
Total RNA was extracted from cells using the AxyPrep Total RNA Small Volume Preparation Kit (Axygen, USA). RNA concentration was determined using a NanoDrop 2000. Reverse transcription was performed using the HiScript III RT SuperMix (+ gDNA wiper) kit (Vazyme, Nanjing, China) according to the instructions. RT-qPCR was performed using the 2X Universal SYBR Green Fast qPCR Mix (ABclonal, Wuhan, China) on the LightCycler96 system. GAPDH and B2M were employed for result normalization, and quantification of relative mRNA expression was achieved using the 2–∆∆Ct method. The primer sequences used are provided in Table S1.
Western blotting (WB)
Cell protein extraction was carried out using Cell Lysis Buffer for Western and IP (Beyotime, China). Following protein quantification and denaturation, an equal amount of protein samples was loaded onto pre-prepared 10% PAGE gels, subjected to electrophoresis, and subsequently transferred onto 0.22 μm PVDF membranes (Biosharp, China). The membrane was then blocked with 5% skimmed milk for 1.5 h and incubated overnight at 4 °C with the relevant primary antibody. Following three TBST washes, secondary antibodies were introduced and incubated for 1 h at room temperature. Chemiluminescence-based imaging was conducted using an imaging system (CLiNX, China). The antibodies used are as follows: IGF2BP3 Rabbit mAb (ab179807, Abcam), GAPDH Rabbit pAb (AC001, ABclonal), and HRP Goat Anti-Rabbit IgG (H + L) (AS014, ABclonal).
Cell counting kit-8 (CCK8) assay
Cell viability was assessed using the Cell Counting Kit-8 reagent (Vazyme, China). HCC cells were seeded in 96-well plates at a density of 3000 cells per well. Depending on the experimental design, NC treatment was administered or omitted. At time points of 0 h, 24 h, 48 h, 72 h, and 96 h, 10 µL of CCK8 reagent (diluted in 100 µL of medium per well) was added and incubated with the cells at 37 °C in an incubator with 5% CO2 for 1 h. The absorbance at 450 nm of each well was measured using a microplate reader (Bio-Rad, USA).
Scratch assay
Cells were pre-seeded into 6-well plates. When reaching 90% confluence, scratches were manually created. The medium was refreshed every 24 h with DMEM containing 1% FBS, and microscopic images were captured. Each cell type was plated in triplicate, and at least six fields were randomly captured per well. The area of wound closure was quantified using Image J software.
Transwell migration and invasion assays
Cells were resuspended in serum-free medium and counted. 7 × 10⁴ cells suspended in 100 µL of serum-free medium were seeded into the upper compartment of the transwell chamber for migration assays. For invasion assays, 1 × 10⁵ cells/100 µL were seeded into the upper chamber pre-coated with 60 µL of Matrigel diluted 1:8 in serum-free medium. The lower chamber was filled with 500 µL of medium containing 10% FBS. After 24 h of incubation, the transwell chambers were removed, and the inner walls were gently wiped. The transwell chambers were then washed with PBS, fixed with 4% paraformaldehyde, and stained with 0.3% crystal violet. Finally, four random fields were captured per well under an inverted microscope.
RNA stability assay
Cells were seeded into six-well plates at an appropriate density, and once the cell confluence reached 70–80%, 5 µg/mL actinomycin D (Biotopped, China) was added to treat the cells for 0 h, 1 h, 2 h, 3 h, 4–6 h, respectively. Subsequently, total RNA extraction and RT-qPCR were performed. After obtaining the Ct values, the relative abundance of mRNA at each time point relative to 0 h were calculated and then plotted using GraphPad Prism. The mRNA decay rate was further determined through nonlinear regression curve fitting (single-phase decay model) (Ratnadiwakara and Änkö 2018).
RNA-seq and MeRIP-seq
Huh7 cells were subjected to a 48-hour treatment with 4 µmol/L of NC. Both NC-treated and DMSO control groups were established, each comprising three replicates. After the treatment using TRIzol Reagent (Sangon, China), cell samples were submitted to the company for RNA-seq and MeRIP-seq. Differential expression analysis was performed for both RNA-seq and MeRIP-seq results on R 4.2.1 using the “DESeq2” package. The criteria used to identify differentially expressed genes (DEGs) were|log2 (fold change)| > 0.6 and P < 0.05. For differentially m6A-modified peaks, the criteria were|log2 (fold change)| > 0 and P < 0.05.
Molecular docking
The PDB Fomat of IGF2BP3 (PDB ID, 6GQE) was downloaded from the PDB (http://www.rcsb.org/pdb/home/home.do) website. The 3D structure of NC was acquired from PubChem (https://pubchem.ncbi.nlm.nih.gov/). Structural preparations such as dehydrogenation and hydrogenation of the acquired protein 3D structures were performed using Pymol software. Blind docking was performed using the CB-DOCK2 online server, which performed cavity detection based on an artificial neural network and utilized Autodock Vina for docking (Liu et al. 2022). Upon completion of the docking, the one with the lowest binding energy was selected as the best conformation, and further analysis of intermolecular interactions and binding site evaluation was conducted to assess stability for subsequent dynamic validation. Interaction analysis between the ligand and receptor was carried out using the PLIP online server (https://plip-tool.biotec.tu-dresden.de/plip-web). The 3D conformations of the ligand-receptor complexes were visualized using Pymol software.
Molecular dynamics (MD) simulation
All-atom MD simulations were performed using the ligand-protein complexes obtained from the docking results as the initial structures. Simulations were conducted using Gromacs 2023.3 software. Both the ligand and protein were described using the AMBER protein force field (Maier et al. 2015; Wang et al. 2004). The system was prepared with the addition of hydrogen atoms via the pdb2gmx module, followed by the creation of a truncated cubic TIP3P solvent box (Mark and Nilsson 2001) at a distance of 10 Å. Na⁺ or Cl⁻ was added to neutralize the system’s charge. The topology and parameter files for simulation were then generated.
The MD simulations, lasting 100 ns, were performed using Gromacs 2023.3. Before the simulation, energy minimization was conducted using the steepest descent method with the initial step size set to 0.01 nm and a maximum force tolerance of 1000 kJ/mol•nm. After energy minimization, the system underwent a 100 ps NVT (constant volume and temperature) simulation to gradually heat the system from 0 K to 310.15 K, allowing solvent molecules to distribute uniformly. This was followed by a 100 ps NPT (constant pressure and temperature) simulation using the Berendsen barostat to equilibrate the system’s pressure at 1 bar. During the MD simulation, all hydrogen bonds were constrained using the LINCS algorithm with a 2 fs integration step. Electrostatic interactions were calculated using the Particle-mesh Ewald (PME) method with a cutoff of 1.2 nm, while non-bonded interactions used a cutoff distance of 10 Å, updated every 10 steps. Post-simulation, the trajectory was processed for periodic boundary condition removal, followed by analyses such as root mean square deviation (RMSD), root mean square fluctuation (RMSF), radius of gyration (Rg), and hydrogen bond counts.
Surface Plasmon Resonance (SPR)
Experiments were performed at 25 ℃ on a BIAcore T200 using CM5 sensor chips, and data were analyzed using BIAcore T200 Evaluation software (GE Healthcare) following the manufacturer’s instruction. In brief, a cell on the CM5 sensor chip was activated with a mixture of 200 µM 1-ethyl-3-(3-dimethylaminopropyl) carbodiimide (EDC, GE Healthcare) and 50 µM N-hydroxysuccinimide (NHS, GE Healthcare) at 10 µL/min for 420 s. The IGF2BP3 protein was diluted to 50 µg/mL with sodium acetate (pH 5.0) solution and immobilized on the surface of the cell at 10 µL/min for 420 s for two repetitive runs. The cell was then blocked with 1 M ethanolamine (10 µL/min for 420 s). A neighbouring aisle that served as a reference was similarly activated and blocked, except that protein-free sodium acetate solution was used for immobilization. Both of the aisles were then equilibrated with PBS. Nitidine chloride stock solution was diluted to a series of concentrations in PBS, and was flowed at 30 µL/min for 150 s in each run. At the end of each flow, cells were regenerated for 5 min with 10 mM glycine-HCl (pH 2.0) solution at 10 µL/min. Data from the sample cell were collected using BIAcore T200 Control software (v. 2.0, GE Healthcare), and were subtracted from those from the reference cell. Association and dissociation constants were obtained by global fitting of the data to a 1:1 Langmuir binding model using BIAcore T200 Evaluation software (v.2.0, GE Healthcare). Data were exported to Origin 7 software (v.7.0552, OriginLab) for generating the final figures.
Expression analysis and prognostic value of IGF2BP3 in HCC
Diverse global datasets related to HCC and normal liver tissues were collected from Gene Expression Omnibus (GEO) (Barrett et al. 2012), ArrayExpress (Sarkans et al. 2021), The Cancer Genome Atlas (TCGA) (Tomczak et al. 2015) and Genotype-Tissue Expression (GTEx) (Consortium 2013) databases. The databases from the same platform were then merged, de-batched using the ComBat function from the “sva” package (Leek et al. 2012), and normalized by log2(x + 1). Then DEGs were assessed by calculating the standardized mean difference (SMD). When the SMD value was above 0 and the 95% confidence interval (CI) didn’t encompass zero, it was identified as an upregulated gene. Conversely, if SMD was less than 0 and the 95% CI didn’t contain zero, it was classified as a downregulated gene.
IGF2BP3 mRNA expression was analyzed by integrating the included datasets by calculating SMD as described previously, and forest plots were plotted using the “meta” package. Then the summary receiver operating characteristic (SROC) curve was further plotted to evaluate the ability of IGF2BP3 expression to discriminate between HCC and non-HCC tissues. The IHC images of IGF2BP3 expression in HCC and normal liver tissues were downloaded from the Human Protein Atlas database (Uhlén et al. 2015). The prognostic role of IGF2BP3 in HCC was assessed based on the Kaplan-Meier plotter database (Győrffy 2021). When the hazard ratio (HR) value was greater than 1, the corresponding factor was considered to be a risk factor for patient survival.
Acquisition of IGF2BP3 related datasets
Genes capable of directly binding to IGF2BP3 were derived from GSE90639, a RIP-seq dataset of IGF2BP3. Genes differentially downregulated by IGF2BP3 knockdown were obtained from GSE90684, a dataset of RNA-seq performed on IGF2BP3 knockdown and control HepG2 cells, and analysis was conducted using GEO2R with screening criteria of |log2 (fold change)| > 0.7 and P < 0.05. 3463 metabolic-related genes derived from 114 metabolic pathways were identified by SR Rosario et al. (Rosario et al. 2018).
Enrichment analysis
Gene Ontology (GO) and Kyoto Encyclopedia of Genes and Genomes (KEGG) enrichment analyses were conducted using the “clusterProfiler” and “org.Hs.eg.db” packages. Following the acquisition of enriched pathway information, the “ggplot2” package was employed to create bubble plots or histograms for presentation.
Calculation of metabolic scores of HCC patients
Single-sample gene set enrichment analysis (ssGSEA) of 374 HCC samples from TCGA was conducted with the GSVA package in R, and the metabolic score for each HCC patient was calculated (Hänzelmann et al. 2013). Based on the metabolic scores, patients were categorized into high and low metabolic groups. Further investigations were performed to examine the correlation between metabolic scores/groups and IGF2BP3 expression, in addition to their relationship with various clinicopathologic parameters such as age, race, survival status, T stage, TNM stage, and histologic grade. Additionally, the prognostic significance of the metabolic scores was assessed using Kaplan-Meier plots and both univariate and multivariate Cox regression analyses.
Statistical analysis
Statistical analysis and plotting were conducted utilizing GraphPad Prism 9 and R v.4.2.3. Student’s t-test or Mann–Whitney U-test was employed to assess differences between two groups of data. P values less than 0.05 were statistically significant.


Comments (0)