
Remember me
In total, 19 publications between 1997 and 2023 reporting PK data after psilocybin administration were included (see Fig. 2) [14,20,21,27,28,29,30,31,32,33,34,35,36,37,38,39,40,41,42]. The reported results originate from 12 distinct clinical datasets. An overview of the included publications and data is presented in Table 1 and Figs. 3 and 4.
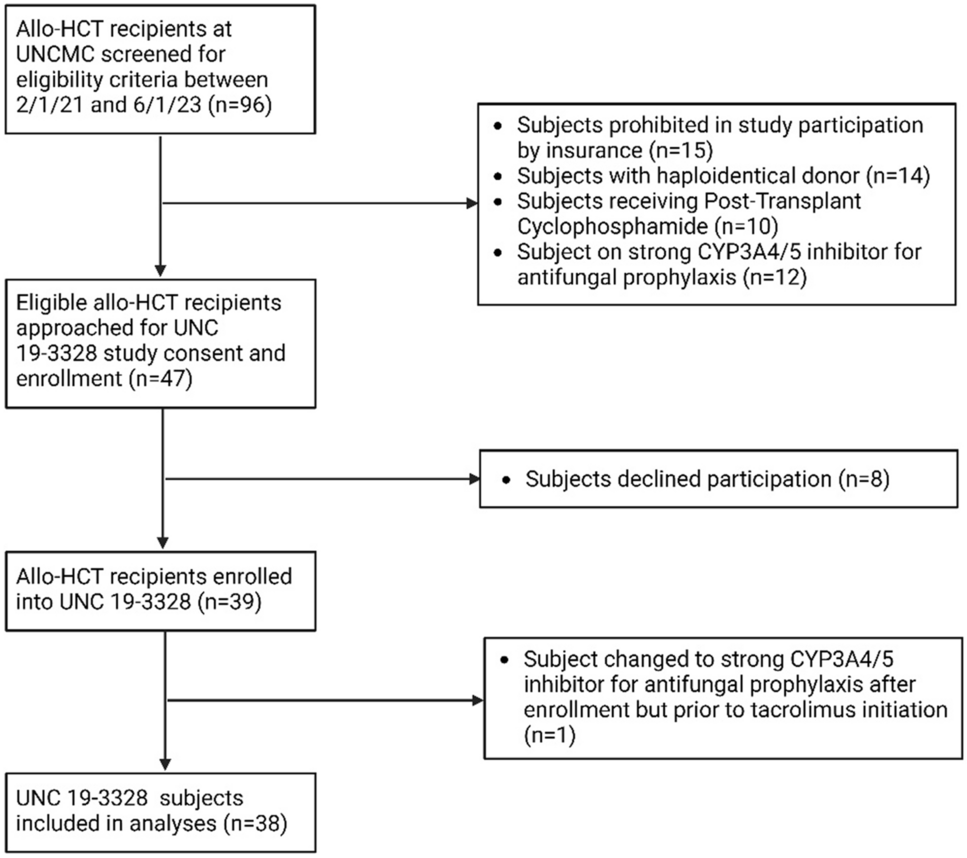
Fig. 2
Flowchart for selection of the included literature. PK pharmacokinetic
Table 1 Overview of reported and recalculated PK parameters of psilocybinFig. 3
Mean psilocin concentrations over time as reported or calculated from extracted or acquired individual-level data. Error bars represent the standard deviation, which were recalculated based on population size and standard error of the mean if not available. Data are coloured based on the average administered psilocybin dose. CIMBI Center for Integrated Molecular Brain Imaging, h hours, IV intravenous, PO per os (oral)
Fig. 4
Reported and recalculated pharmacokinetic parameters for psilocin (unconjugated) per clinical dataset. The reference refers to the publication with the most detailed description of the pharmacokinetic dataset or original database. Recalculated parameters are based on individual data that have either been extracted from the literature or received upon request to authors. Dose normalisation of maximum concentration (Cmax) and area under the concentration–time curve (AUC) parameters was not flagged as ‘recalculated’ and was based on the absolute dose if reported as a weight-based dose. This absolute dose was based on (1) the mean of individual absolute doses, (2) the mean weight of the study population or (3) an average weight of 70 kg. Squares, circles and triangles represent mean values, with the exception of Holze et al. [40] and Ley et al. [32], which show geometric mean values, for all parameters. Squares, circles and triangles shown for Tmax depict the median or the mean if no median was reported (see Table 1), solid lines are standard deviations and dashed lines are minimum and maximum values. For the data of Holze et al. [40], the reported apparent clearance (CL/F) and apparent volume of distribution after oral administration (Vz/F) were actually retrieved from Holze et al. [39], as they were not also reported in Holze et al.40 even though they are determined from the same dataset. AUCinf AUC from time zero extrapolated to time infinity, AUClast AUC from time zero to time of last measurable concentration, CIMBI Center for Integrated Molecular Brain Imaging, t1/2 terminal elimination half life
3.1 Study Design CharacteristicsPsilocybin was administered orally in all but one study, where it was administered orally and intravenously to six male healthy subjects [14]. Available specifics on oral formulations included the mention of capsules [14,20,32,36,39,40,41], powder [29,31], purity [27,28,32,36,38,39,40,42], excipients [14,20,27,37,38,42] or administration as psilocybin dihydrate [36,39,40]. Oral doses ranged from 7 to 59.2 mg and doses were often individualised within treatment groups, sometimes as the result of predefined weight-based doses [21,27,37,38,41,42]. In other cases, the mean administered weight-based dose was reported, which was not pre-defined, but calculated from administered individual absolute doses a posteriori [14,20]. This is likely to be the result of fixed capsule contents [29,33]. In case of weight-based dosing, the administered absolute doses could not always be retrieved because of missing weight demographics and an average weight of 70 kg was assumed [21,29,34,41].
Population size ranged from 3 to 32 subjects per dose level. Population weights (mean or median) were reported between 59.5 and 89.9 kg per studied dose level (minimum–maximum: 50–122 kg) [14,20,33,34,35,36,37,38,39,40], yet body mass index was reported less, between 23 and 24 kg/m2 (19–34 kg/m2) [37,39,40]. Population age was reported between 23 and 43 years (19–61 years) [14,20,29,31,32,33,34,35,36,37,39,40,41,42]. If reported, included sex was distributed fairly between both sexes with a median of 60% male individuals included [14,20,29,31,32,33,34,35,36,37,39,40,42]. Information on fasting status was reported in eight distinct clinical datasets, where participants were administered psilocybin while fasted in three studies [14,27,31,32,36,37,38,39,40]. All studies reported data on healthy volunteers, except for the Center for Integrated Molecular Brain Imaging database, which also included patients with cluster headache (10 out of 47 subjects).
3.2 Bio-Analytical MeasurementsPharmacokinetic sampling frequency ranged from 3 to 18 samples per individual, up to 24 h after dosing. Almost all studies measured unconjugated psilocin, the pharmacologically active metabolite of psilocybin that is formed first upon absorption (see Fig. 1). Exceptions are one study that only measured total psilocin after deconjugation of the samples [41] and another study, which did not provide information with regard to the sample matrix nor analyte (i.e. conjugated, unconjugated or total psilocin) [30]. Additionally, four studies performed separate analyses to measure both unconjugated psilocin and total psilocin concentration, thereby allowing an additional calculation of conjugated psilocin concentrations [28,
Comments (0)