Cell lines and cell culture
The following cell lines were used in this study: human embryonic kidney cell line 293T (ATCC, Manassas, USA), mouse B cell lymphoma line A20 (ATCC), mouse metastatic lung cancer cell line 344SQ (University of Texas M.D. Anderson Cancer Center, provided by Jonathan M. Kurie), human pancreatic adenocarcinoma HupT3 (harboring the R282W mutation in the p53 gene, obtained from Sigma-Aldrich), and mouse colon adenocarcinoma cell line MC38 (Sigma-Aldrich, St-Louis, MO, USA). The MC38-p53KO/R282W cell line, which stably overexpresses human p53R282W following endogenous p53 knockout (p53KO), was generated by knocking out the endogenous p53 mutant alleles (G242V & S238I) and introducing the human p53 gene with the R282W mutation. 293T, MC38, and MC38-p53KO/R282W cells were cultured in DMEM (Gibco, Grand Island, NY, USA) supplemented with 10% Fetal Bovine Serum (FBS, Gibco) and 1 × anti-anti solution (Gibco). A20 cells were cultured in RPMI-1640 Medium (Gibco) supplemented with 10% FBS, 0.05 mM 2-mercaptoethanol (Gibco, 21985023), and 1 × anti-anti solution. 344SQ cells were cultured in RPMI 1640 medium supplemented with 10% FBS and 1 × anti-anti solution. HupT3 cells were cultured in DMEM (Gibco) supplemented with 2 mM Glutamine (Cytiva, Marlborough, MA, USA; SH30034.01), 1% non-essential amino acids (NEAA, Cytiva, SH30238.01), 1% sodium pyruvate (Cytiva, SH30239.01), 10% FBS, and 1 × anti-anti solution.
Plasmid preparation
The following plasmids were used in this study: pmaxGFP (Lonza), gWIZ-Luc, gWIZ-p53-R172H, gWIZ-PD-L1 (Twist Bioscience, South San Francisco, CA, USA), and pαH-Spike (SARS-CoV-2 HexaPro Spike with two Strep-Tag II and a His-Tag; Addgene, Cambridge, MA, USA; 154754). To construct plasmids expressing monoclonal antibodies (mAbs), the heavy chain (HC) and light chain (LC) of the mouse PD1-mAb (RMP1-14) were fused to the Fc region of mouse IgG2a and cloned into the gWIZ vector (Twist Bioscience). Mouse R282W-mAb was generated using hybridoma screening [18]; its HC and LC were fused to the Fc region of human IgG1 and cloned into the pTwist vector (Twist Bioscience). Plasmids were purified using the endotoxin-free ZymoPURE™ II Plasmid Maxiprep Kit (Zymo Research, Irvine, CA, USA; D4203), as previously described [18].
LNP/DNA formulation
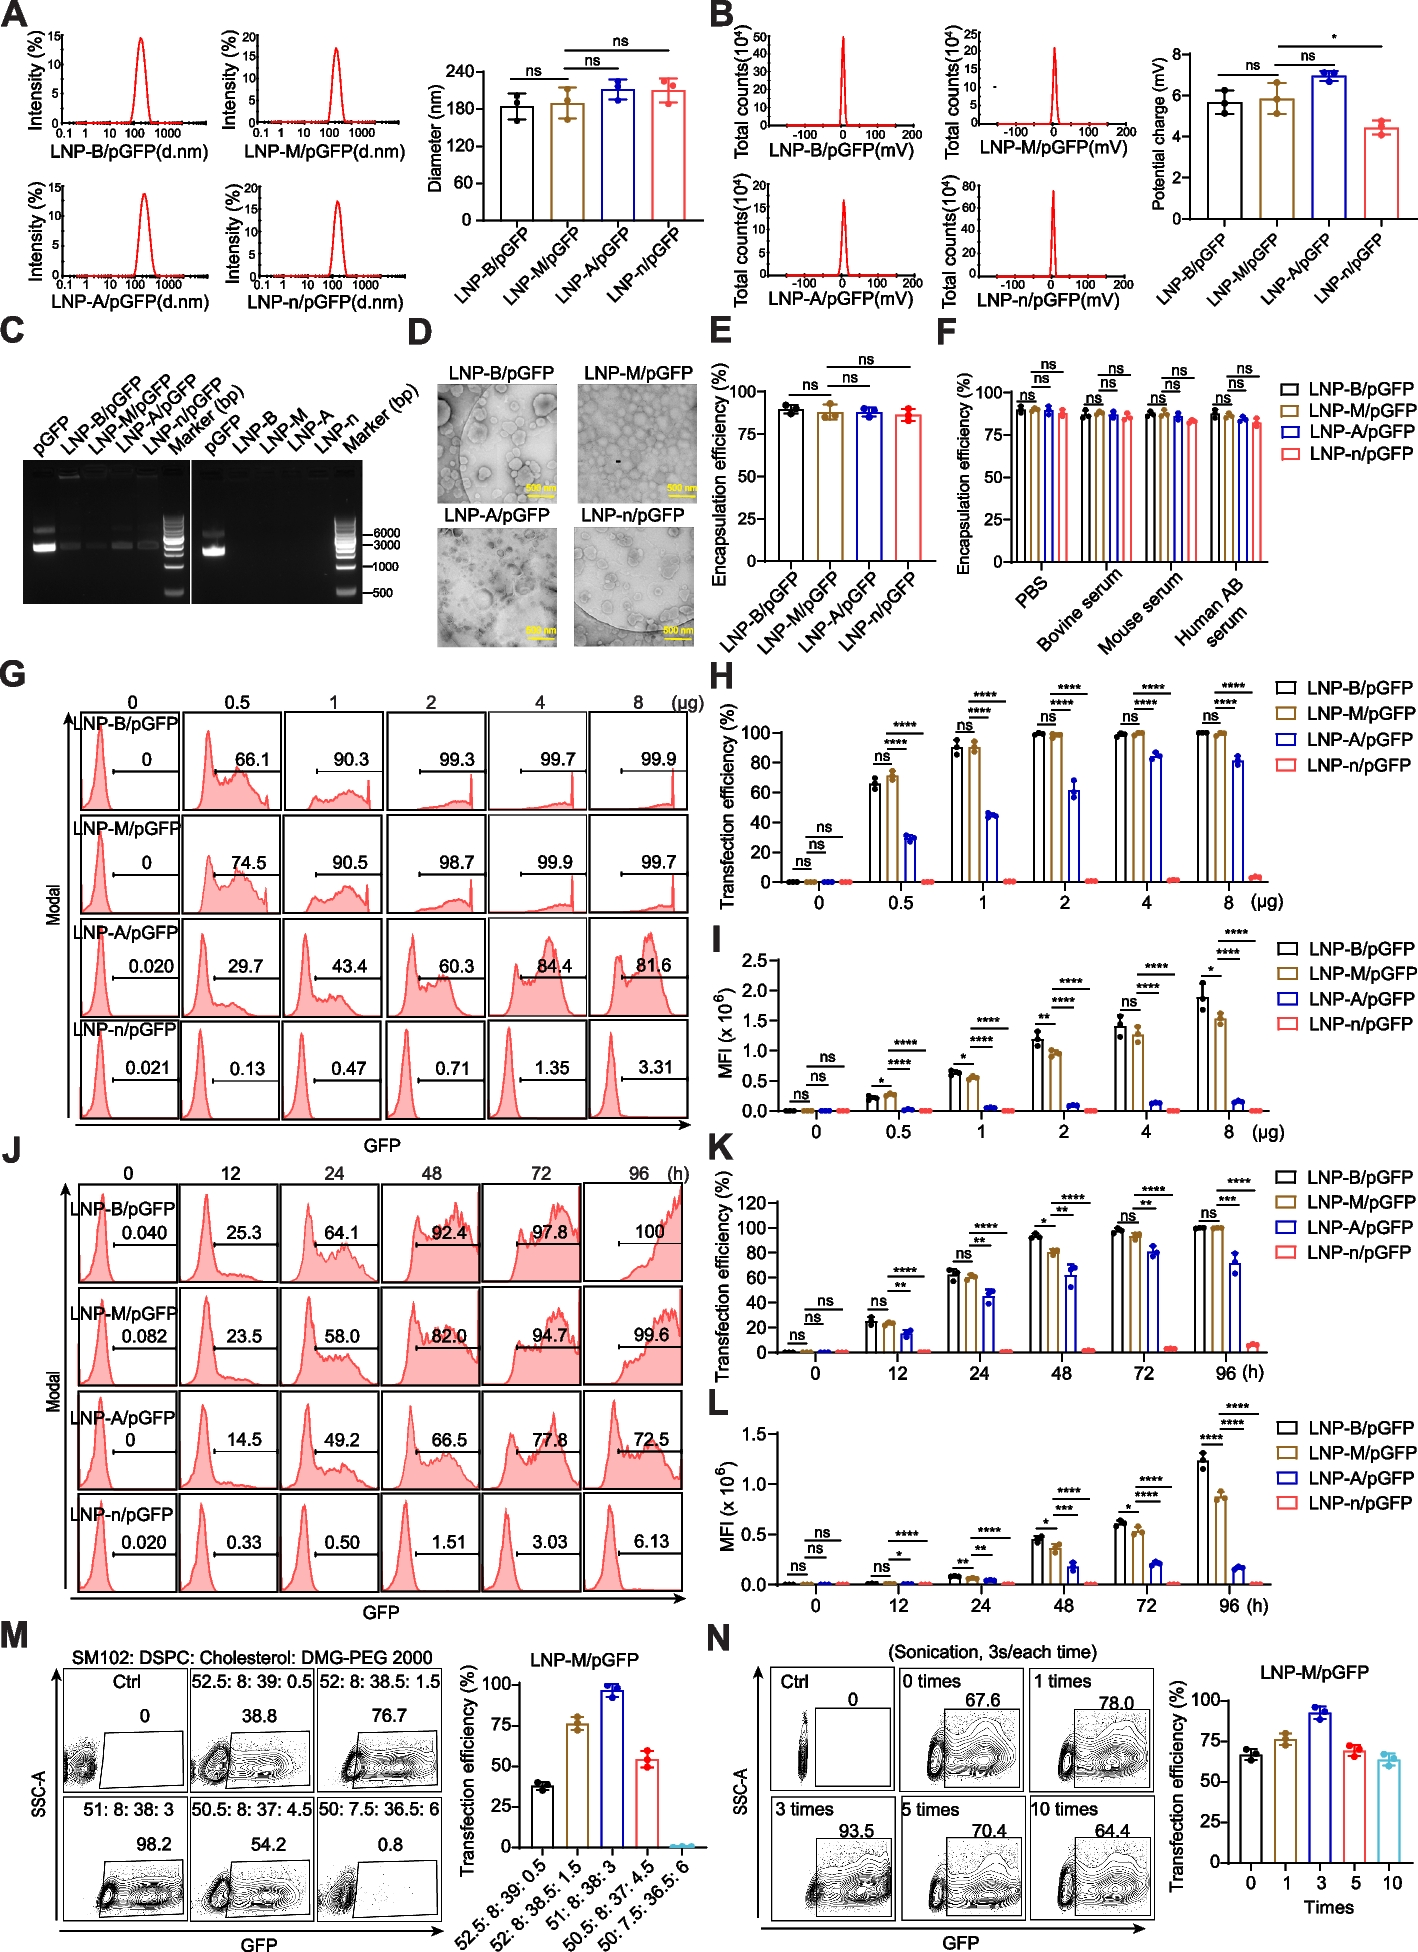
Four LNP formulations were used: LNP-B, composed of ALC-0315 (MedChemExpress, Monmouth Junction, NJ, USA; HY-138170), ALC-0159 (MedChemExpress, HY-138300), DSPC (Sigma-Aldrich, P1138), and Cholesterol (Sigma-Aldrich, C3045); LNP-M, comprising SM-102 (Cayman Chemical, Ann Arbor, MI, USA; 33474), DMG-PEG 2000 (Avanti Polar Lipids, Alabaster, AL, USA; 880151), DSPC, and Cholesterol; LNP-P containing DLin-MC3-DMA (Cayman Chemical, 34364), DMG-PEG 2000, DSPC, and Cholesterol; and LNP-n, consisting of DLin-MC3-DMA, PEG-DSPE (Avanti Polar Lipids, NC0668213), DSPC, and cholesterol. These formulations were prepared by diluting the respective lipid components in 40 μl ethanol (Fisher Scientific, Fair Lawn, NJ, USA; A4094) at a molar ratio of cationic lipid: DSPC: Cholesterol: DMG-PEG 2000 = 51: 8: 38: 3 for four components in all LNPs. When needed, NLS (MedChemExpress, HY-P1876B) and/or histones (Sigma-Aldrich, H5505) were incubated with DNA or DSPC for 2 h at room temperature. The preparation of LNP/DNA nanoparticles follow the same standard method as described below.
For DNA encapsulation, 40 μg of DNA vector or antibody-expressing plasmids with HC and LC in a 1:1 ratio, was diluted with water and citrate buffer (pH 3.5; final concentration 25 mM; bioWORLD, Dublin, Ohio, USA; 40320053–1) for a final volume is 80 μl. The lipid and DNA phases were loaded into the Spark Cartridge (Precision Nanosystems, South San Francisco, CA, USA; NIS0013) and formulated using a NanoAssemblr Spark Formulation Device (Precision Nanosystems) according to the manufacturer’s instructions. The resulting LNP/DNA nanoparticles were purified by dialyzing against PBS with free Ca2+ and Mg2+ at pH 7.4 using a Pur-A-Lyzer Maxi Dialysis Kit (Sigma-Aldrich, PURX60005) overnight and then concentrated to a final pDNA concentration of 0.8 mg/mL using 50 KDa Amicon Ultra-0.5 mL Centrifugal Filters (Merck Millipore, Billerica, MA, USA; UFC505024). The encapsulated efficiency of LNP/DNA was quantified using a Quant-iT Pico-Green dsDNA assay kit (Thermo Fisher Scientific, Waltham, MA, USA; P11496) following the manufacturer’s instructions. Before the experiment, the LNP/DNA nanoparticles were sonicated for 3 s, three times.
Particle size and zeta potential analysis
LNP nanoparticles were diluted with ddH2O at a 1:100 ratio. Size measurements were taken at 25 °C with a 173° scattering angle using dynamic light scattering (DLS) on the Zetasizer Nano ZS90 (Malvern, UK). Zeta potential determinations, based on the electrophoretic mobility of the nanoparticles in the aqueous medium, were performed using folded capillary cells in automatic mode.
For morphology assessment, LNP nanoparticles were resuspended in ddH2O and deposited onto a glow-discharged carbon‐coated 400-mesh copper grid for 5 min. Subsequently, the films were negatively stained with 1 wt% uranyl acetate at room temperature for 1 min. After staining, the copper mesh was dried with filter paper and examined using transmission electron microscopy (TEM).
Gel retardation assay
The integrity of LNP/DNA complexes was assessed to investigate the stability of the encapsulated plasmid. Naked plasmid pmaxGFP and LNPs served as controls, while the LNP/DNA complexes were tested in experimental wells, each containing 1 μg of DNA. All samples were loaded onto a gel containing 1% agarose and run in l × Tris–EDTA buffer (pH 8.3) using a gel electrophoresis system (Bio-Rad, Hercules, CA, USA). The gel was then visualized using a gel imaging system (Bio-Rad).
Transfection
293T cells were seeded on a 24-well plate at a density of 2 × 10⁵ cells per well. After overnight cultured, the cells were treated with various transfection reagents, including LNP, lipofectamine™ 2000 (Invitrogen, Carlsbad, CA, USA; 11668019), PEI (Polysciences, Warrington, PA, USA; 23966), TansIT-LT1(Mirus Bio, Madison, WI, USA, MIR 2305), and lentivirus, each containing 2 μg of plasmid DNA per well in Opti-MEM medium (Gibco). This dosage is typical for lipoplexes, resulting in high transfection efficiency with minimal impact on cell viability. After a 3 h incubation at 37 °C and 5% CO2, DMEM supplemented 20% FBS was added to each well. After various time points post-transfection, 293T cells were harvested, washed, and resuspended in PBS for analysis using a fluorescence activated cell sorter (FACS).
Western blot
Samples were collected and lysed in cold lysis buffer (Invitrogen, 89901) supplemented with Protease and Phosphatase Inhibitor (Invitrogen, 78443). Equal amounts of protein were loaded onto 10% SDS-PAGE gels for each sample, separated by electrophoresis, and transferred onto a polyvinylidene difluoride (PVDF) membrane (Millipore). Subsequently, the membrane was then blocked with a 5% BSA solution and probed with primary antibodies against His-tag (Sigma-Aldrich, SAB1306084) or β-actin (Sigma-Aldrich, A5316) at 4 °C overnight. The membranes were then washed with phosphate-buffered saline containing 0.1% Tween 20 (PBST) and incubated with horseradish peroxidase (HRP)‐linked secondary antibodies at room temperature for 2 h. After additional washing, immunoreactive bands were visualized using enhanced chemiluminescence (ECL, Thermo Fisher Scientific, 34076) and detected with an automatic chemiluminescence system (Bio-Rad).
Animal experiments
Six- to eight-week-old female BALB/c, 129S1/SvImJ, C57BL/6J and NOD.Cg-Prkdc (scid) Il2rg (tm1Wjl)/SzJ (NSG) mice were obtained from Jackson Laboratory and the Center for Comparative Medicine (CCM) of Baylor College of Medicine and housed in pathogen-free conditions. All animal procedures and protocols were approved by the Institutional Animal Care and Use Committee (IACUC) of Baylor College of Medicine.
For intramuscular experiments, BALB/c mice were injected with LNP-M/pLuc (40 μg/mouse), After five days, tissues expressing detectable levels of luciferase were observed. Anesthesia was induced using isoflurane, and 200 μl of substrates at a concentration of 15 mg/ml was injected into the intraperitoneal cavity. Photon emission from the region of interest (ROI) was measured using the Caliper in vivo imaging system (IVIS Lumina II, Caliper LifeSciences, Hopkinton, MA, USA).
For preventive spike vaccine immunization, mice were intramuscularly administered with LNP-M/Ctrl (LNP-M/gWIZ vector), LNP-M/Spike-mRNA (mRNA-1273), or LNP-M/pSpike. Some mice received electroporation (EP) immunization with pSpike (EP/pSpike) using ICHOR medical systems. Each group was immunized three times biweekly with 40 μg of DNA/mouse or 5 μg of mRNA/mouse. For therapeutic vaccine immunization, subcutaneous tumor models were established by inoculating A20 (1 × 10⁶ cells/mouse), 344SQ (2 × 10⁶ cells/mouse), MC38 (3 × 10⁵ cells/mouse), and MC38-p53KO/R282W (5 × 10⁵ cells/mouse). Tumor models were intramuscularly immunized with LNP-M/pPD-L1 or LNP-M/pR172H on days 7 and 17 and intratumorally on day 24 after tumor inoculation.
For the MC38 or MC38-p53KO/R282W subcutaneous tumor model, intratumoral injections of LNP-M/pPD1-mAb, LNP-M/pR282W-mAb, or LNP-M/Ctrl (LNP-M/gWIZ or LNP-M/pTwist vector) (40 μg/mouse) were administered on days 14 and 21. Additionally, combination therapy with 500 μg/mouse of αCD4 (BioXcell, West Lebanon, NH, USA; BE0119), αCD8 (BioXcell, BP0117), or αNK1.1 (BioXcell, BE0036) was administered twice weekly following the first intratumoral injection.
For the lung metastasis model, MC38-p53KO/R282W cells (1 × 10⁶ /mouse) were injected into the tail vein on day 0. Mice received intravenous injections of LNP-pR282W-mAb (40 μg/mouse) on days 7 and 12. On day 22, the mice were sacrificed, and metastatic nodules in the lungs were quantified. To establish intestinal tumors, mice were intraperitoneally administered 2 × 10⁶ MC38-p53KO/R282W cells suspended in 100 μl of PBS. Mice were then treated intraperitoneally with LNP-M/pR282W-mAb on days 7 and 14 after tumor inoculation. Tumor growth and survival were evaluated at the end of treatment.
NSG mice were subcutaneously inoculated with HupT3 cells (3 × 10⁶/mouse) resuspended in a mixture of serum-free medium and Matrigel (1:1 volume ratio, Corning, New York, NY, USA; 354230) into the right flank on day 0. On day 10, tumor-bearing mice received an intravenous injection of human PBMCs (1 × 10⁷/mouse). Fourteen days post-tumor inoculation, mice were intratumorally injected with LNP-M/pR282W-mAb (40 μg/mouse) on days 14, 19, and 24. For subcutaneous tumors, the tumor volume was calculated using the formula: V = (length × width2)/2. The tumor inhibition rate was calculated using the following formula: (C − T)/C × 100%, where C represents the volume of the largest tumor in the control group, and T is the tumor volume of each treated mouse.
FACS analysis
A single-cell suspension of spleen or tumor-infiltrating leukocytes (TILs) was prepared by gently homogenizing spleen or digested tumor tissues using a mouse Tumor Dissociation Kit (Miltenyi Biotec, Auburn, CA, USA; 130–096-730). After FcR blocking and removing dead cells with a Zombie Aqua Fixable Viability Kit (BioLegend, San Diego, CA, USA), cell surface staining was performed by incubating with the following antibodies for 30 min at 4 °C, followed by intracellular staining. Mouse antibodies used included CD16/32 (BioLegend, 101302), APC-BrdU (BioLegend, 364114), APC/Cy7-CD45 (BioLegend, 103116), Brilliant Violet 750-CD45 (BioLegend, 103157), PE/Cyanine7-CD45 (BioLegend, 103114), Percp/cy5.5-CD19 (BioLegend, 152406), PE-CD3 (BioLegend, 100206), Pacific Blue CD4 (BioLegend, 100531), PerCP/Cyanine5.5 CD8α (BioLegend, 100734), APC-CD49b (BioLegend, 108910), APC-NK1.1 (BioLegend, 156506), APC-IFN-γ (BioLegend, 505810), Alexa Fluor 488-IFN-γ (BioLegend, 505813), Alexa Fluor 488-TNF-α (BioLegend, 506313), PE-IL-2 (Biolegend, 503808), APC-CD11c (BioLegend, 117310), FITC-CD11b (BioLegend, 101206), PE-CD103 (BioLegend, 121406), PerCP-F4/80 (BioLegend, 123126), Alexa Fluor 647-FOXP3 (BioLegend, 126408), APC-Cyanine7-Ly-6G/Ly-6C (BioLegend, 108424), FITC-CD279 (BioLegend, 135214), FITC-CD107a (BioLegend, 121606), PE-CD44 (BioLegend, 103024), FITC-CD62L (BioLegend, 104406), PE-CD80 (BioLegend, 104708), FITC-CD86 (BioLegend, 105006), Pacific Blue-I-A/I-E (BioLegend, 107620), PerCP/Cyanine5.5-H-2Kd/H-2Dd (BioLegend, 114716). Human antibodies used included TruStain FcX™ (BioLegend, 422302), APC-IgG Fc (BioLegend, 410712), Brilliant Violet 421-CD45 (BioLegend, 304032), APC-CD56 (BioLegend, 362504). Isotype-matched immunoglobulin served as control. Data were acquired on a Cytek® NL-3000 FACS system (Cytek Biosciences, Fremont, CA, USA) and analyzed using FlowJo V10 software (Tree Star Inc, Ashland, OR, USA).
Antibody titers
Enzyme-linked immunosorbent assay (ELISA) Plates were coated with 5 μg/ml of antigen and incubated at 4 °C overnight. The plates were then washed with 0.05% Tween 20 in PBS and blocked with 1% BSA in 0.05% Tween 20/PBS at room temperature for 2 h. Ten-fold serially diluted serum samples were added in duplicate and incubated at 37 °C for 2 h. HRP-conjugated anti-mouse IgG (Cell Signaling Technology, Danvers, MA, USA; 7076), IgG1 (Abcam, Cambridge, MA, USA; ab97240), IgG2c (Cell Signaling Technology, 56970S), and IgG2b (Abcam, ab97250) antibodies were then added for 1 h at room temperature, followed by the addition of TMB substrate. Absorbance at 490 nm was measured using a CLARIOstar Plus microplate reader (BMG LABTECH, Ortenberg, Germany).
T lymphocyte proliferation assay
Splenocytes from vaccine-immunized mice were plated onto 96-well tissue culture plates at a density of 1 × 10⁵ cells per well. The culture medium contained IL-2 (100 U/ml) and recombinant spike peptide pool (10 μg/ml; STEMCELL, Cambridge, MA, USA; 100–0676). Plates were incubated at 37 °C in a humidified incubator with 5% CO2 for 5 days, with medium changed on day 3. The cells were then incubated with 10 μM BrdU (Sigma-Aldrich, 19–160) for 2 h at 37 °C. After this, cells were collected and subjected to surface staining with anti-CD8α or CD4 antibodies for 30 min. After fixation, permeabilization, and washing, intracellular staining was performed using APC-BrdU antibody (BioLegend, 364114) for an additional 30 min. After intracellular staining, cells were washed three times with a permeabilization buffer. The percentage of BrdU+ cells within CD4+ or CD8+ T cell populations was analyzed by FACS, with this proportion defined as the proliferation rate.
Measurement of cytokines
Protein levels of IFN-γ, IL-10, IL-4, IL-6, and TNF-α were measured in the culture supernatants of stimulated splenocytes or in serum using ELISA kits from R&D Systems (Minneapolis, MN, USA), according to the manufacturer’s instructions.
Enzyme-linked immunospot (ELISPOT)
The assay was conducted using the Mouse IFN-γ/TNF-α Double-Color ELISPOT Kit (Cellular Technology Limited (CTL), Cleveland, OH, USA), following the manufacturer’s instructions. Initially, splenocytes isolated from immunized mice were plated at a density of 1 × 10⁶ cells/well and stimulated with a spike peptide pool (10 μg/ml) for 60 h at 37 °C with 5% CO2. After incubation, cells were washed and incubated with detection antibodies, including biotinylated-TNF-α and FITC-IFN-γ. Subsequently, after another round of washing, streptavidin-AP conjugate or FITC-HRP (1:1000 dilution) was added. The visualization of spots was developed on plates. Spot-forming colonies (SFC) per well were scanned and quantified using a CTL reader. IFN-γ spots appeared as red spots, while TNF-α spots were blue.
Cytotoxic T lymphocyte (CTL) assay
Splenocytes were suspended in RPMI 1640 medium supplemented with 100 U/ml IL-2 and 10 μg/ml spike peptide pool, cultured in a 37 °C humidified incubator with 5% CO2 for 7 days. Subsequently, the splenocytes were washed and resuspended in a medium to be used as effector.
cells. Target cells, over-expressing spike-293T cells, were prepared. Effector and target cells were then titrated in U-bottom 96-well plates at effector-to-target cell ratios of 50:1, 25:1, and 12.5:1. Following this, 1 × 10⁴ target cells were added and incubated at 37 °C for 72 h. Cytotoxicity was assessed using the Cytotoxicity Detection Kit PLUS (Roche, Palo Alto, CA, USA; 4744926001), according to the manufacturer’s instructions.
Pathological analyses
The tissue samples were fixed in 10% formalin and embedded in paraffin. The paraffin-embedded tissues were then sectioned into 5 μm slices and stained with hematoxylin and eosin (H&E) according to the manufacturer's instructions. Photographs of the stained tissues were taken using an Olympus IX51 microscope (Olympus America Inc., Center Valley, PA, USA).
scRNA-seq experiment
A single-cell suspension from the spleens of mice immunized three times with the vaccine was prepared. CD45+ cells were purified using the EasySep™ Mouse TIL (CD45) Positive Selection Kit (STEMCELL, 100–0350) according to the manufacturer’s instructions. Mice-bearing subcutaneous tumors were treated intratumorally with either LNP-M/pR282W-mAb or a control. Fourteen days after treatment, tumors were harvested and minced in RPMI-1640 medium supplemented with 10% FBS. The single-cell suspension from the dissected tumor samples was prepared using a mouse Tumor Dissociation Kit with a gentleMACS Octo Dissociator with Heaters (Miltenyi Biotech). CD45+ cells were sorted from each tumor sample using a FACSAria II instrument. Cells were collected using a 40 μm cell strainer (Corning, 431750) and centrifuged at 300 g for 10 min. The spleen or tumor cells were resuspended in RPMI1640 with 5% FBS. To create the scRNA-seq libraries, equivalent numbers of single cells from three mice per group were combined at a density of 1 × 10³ cells/μl in RPMI1640 medium with 10% FBS. Approximately 10,000 cells in each group were converted into barcoded scRNA-seq libraries using the Chromium™ Next GEM Single Cell 5′ Kit v2 (10 × Genomics, Pleasanton, CA, USA; 1000263) following the manufacturer’s protocol. For preparing full-length T-cell Receptor (TCR) and B-cell Receptor (BCR)V(D)J libraries, the Chromium Single Cell Mouse TCR Amplification Kit (10 × Genomics, 1000254) and Chromium Single Cell Mouse BCR Amplification Kit (10 × Genomics, 1000255) was used to enrich amplified cDNA from the 5′ libraries. The libraries were completed at the Single Cell Genomics Core at Baylor College of Medicine (BCM), following the manufacturer’s protocol. Sequencing was performed on a NovaSeq 6000 by the BCM Genomic and RNA Profiling (GARP) Core.
scRNA-seq data preprocessing
The CellRanger Count v7.1.0 pipeline (https://cloud.10xgenomics.com) was used to process raw sequence data in FASTQ format. The data were aligned to the mouse reference genome using default barcode assignment and Unique Molecular Identifier (UMI) counting with a 2020-A version of the mouse (mm10) genome reference. Default parameters were used with the mouse mm10 genome reference. For obtaining raw gene expression matrices for TCR and BCR, the pipeline used default parameters with the mm10 reference genome. Further processing, including doublet removal and data filtering, was conducted using the R package scDblFinder (v1.14.0) [19] and the R package Seurat (v4.4.0) [20]. In term of tumors, cells with mitochondrial content greater than 15%, nFeature RNA greater than 7,000, or fewer than 200, nCounts greater than 50,000 identified cells were removed from CD45+ cells. Following the workflow of the R package Seurat, we utilized the NormalizeData function to standardize the data and selected the initial 2000 variable genes by using FindVariableFeatures for subsequent analysis. Following the linear transformation of single-cell data via the ScaleData function, we utilize RunPCA funtion and select the top 30 principal components for linear dimensionality reduction. The FastMNN function from the R package SeuratWrappers (v0.3.19) (https://github.com/satijalab/seurat-wrappers) was employed for multi-sample integration to eliminate batch effects. The FindNeighbors and FindClusters functions were employed to delineate neighbors and clusters. Next, dimensionality reduction was executed via the unified manifold approximation and projection (UMAP) through the RunUMAP function, with the dimension parameter configured to 30 and the dimension reduction parameter set to mnn. Subsequently, we employed the FindNeighbors and FindClusters functions to ascertain the edge weights between any two cells and cell clusters. For the analysis of T cells, T cells were subset from the integrated data based on the annotated cell clusters. The R packages STACAS (2.1.3) [21] and ProjecTILs (3.2.0) [22] as well as annotation of cell type database [23] were used to assist with the annotation process.
Downstream analysis of scRNA-seq data
To identify differentially expressed genes (DEGs) within clusters, the FindAllMarkers function in the Seurat package was used with a Wilcoxon test and Bonferroni correction for multiple testing. The DEGs of each cell cluster were determined by comparing them to all other cell clusters, using |log2 fold change|≥ 1 and adjusted p-value < 0.05. The top 100 genes were then selected for enrichment analysis. Gene Ontology (GO) and Kyoto Encyclopedia of Genes and Genomes (KEGG) enrichment analysis for DEGs within cell clusters were performed using Clusterprofiler (v4.8.3) [24]. UMAP and heatmap visualizations were adjusted using the scRNAtoolVis (v0.0.7) (https://github.com/junjunlab/scRNAtoolVis) and pheatmap (v1.012) (https://github.com/raivokolde/pheatmap) packages. Additionally, single cell Gene Set Variation Analysis (scGSVA) was conducted using the R package scGSVA (0.0.16) (https://github.com/guokai8/scGSVA) to identify pathway activity score of each cell types [25]. Cytokine activity was analyzed using the Python implementation of CytoSig [26].
Receptor and ligand interaction analysis
Cellular interactions were investigated using the CellChatR toolkit (2.2) [27]. The CellChatDB database, which includes ligand-receptor interactions supported by literature and protein–protein interaction (PPI) data from mouse datasets, was used to calculate communication probabilities. Initially, the incoming and outgoing parameters for each sample were filtered using the selectK function. The data from the four cell groups were then merged using the mergeCellChat function. The merged data items were analyzed following the Cellchat protocol “Comparison analysis of multiple datasets”.
Processing scVDJ sequence data
For processing single-cell VDJ sequencing data, the Seurat and scRepertoire (1.11.0) [28] packages were used for scVDJ and scRNA-seq analysis. Within the scRepertoire framework, total abundance of clonotypes was visualized using the cloneAbundance function. The relative abundance of clonotypes was determined by calculating their percentage in the sample. Clonotype distribution of CDR3 nucleotide or amino acid sequences was visualized using the cloneLength function. Clonal homeostasis, reflecting the clonal space occupied by specific proportions of clonotypes, was visualized with the clonalHomeostasis function. The clonalProportion function identified the proportion of clonal space occupied by specific clonotypes. Clonal diversity across groups was quantified using the clonalDiversity function.
Statistical analyses
Statistical analyses were performed using GraphPad Prism 8.0 (GraphPad Software). Data were presented as the mean ± standard deviation (SD). An unpaired students’ t-test was used to compare two groups, while one-way analysis of variance (ANOVA) was used for comparisons among multiple groups. Survival differences were assessed using the log-rank test (Mantel-Cox). A p value < 0.05 was considered statistically significant, with *p < 0.05, **p < 0.01, ***p < 0.001, ****p < 0.0001.


Comments (0)