
Remember me
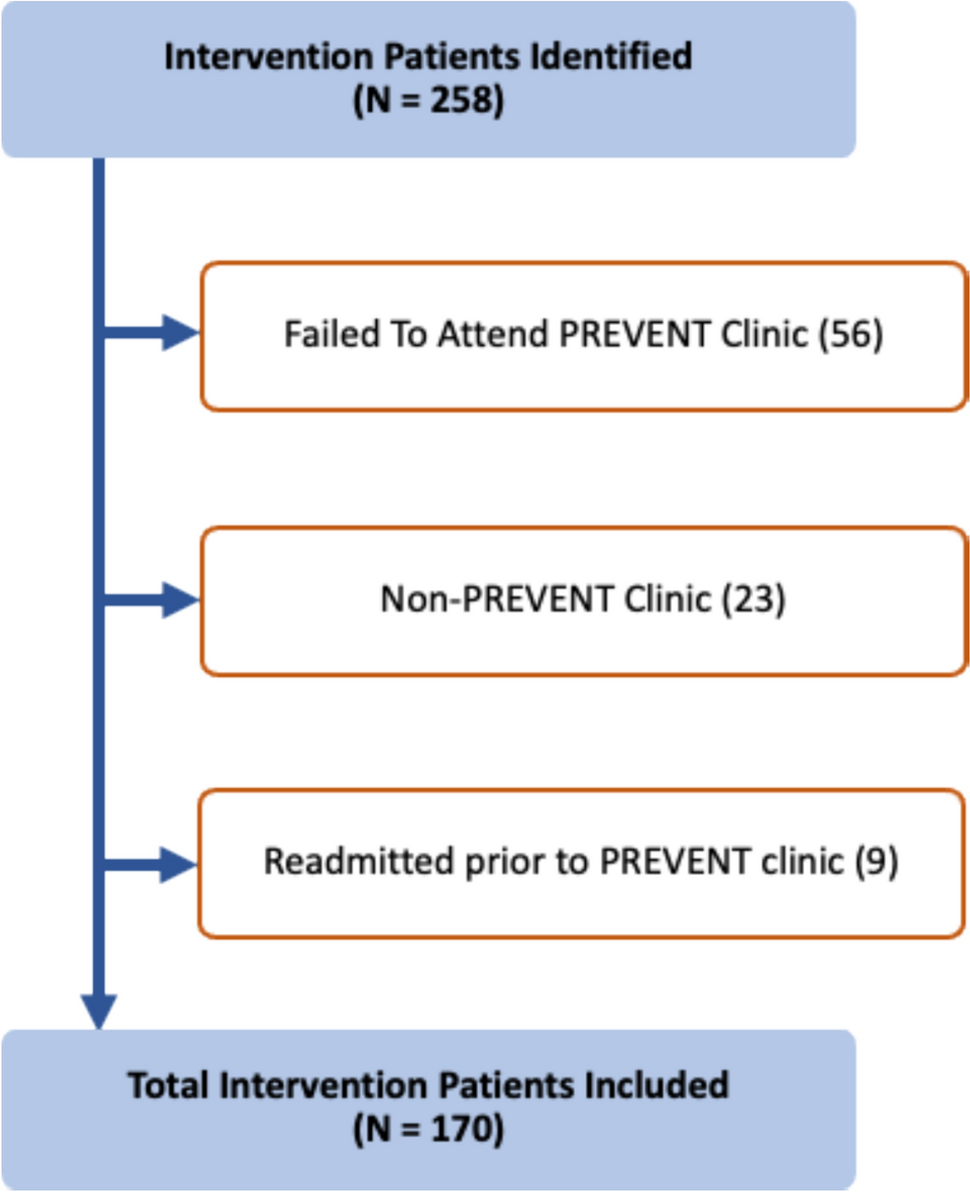
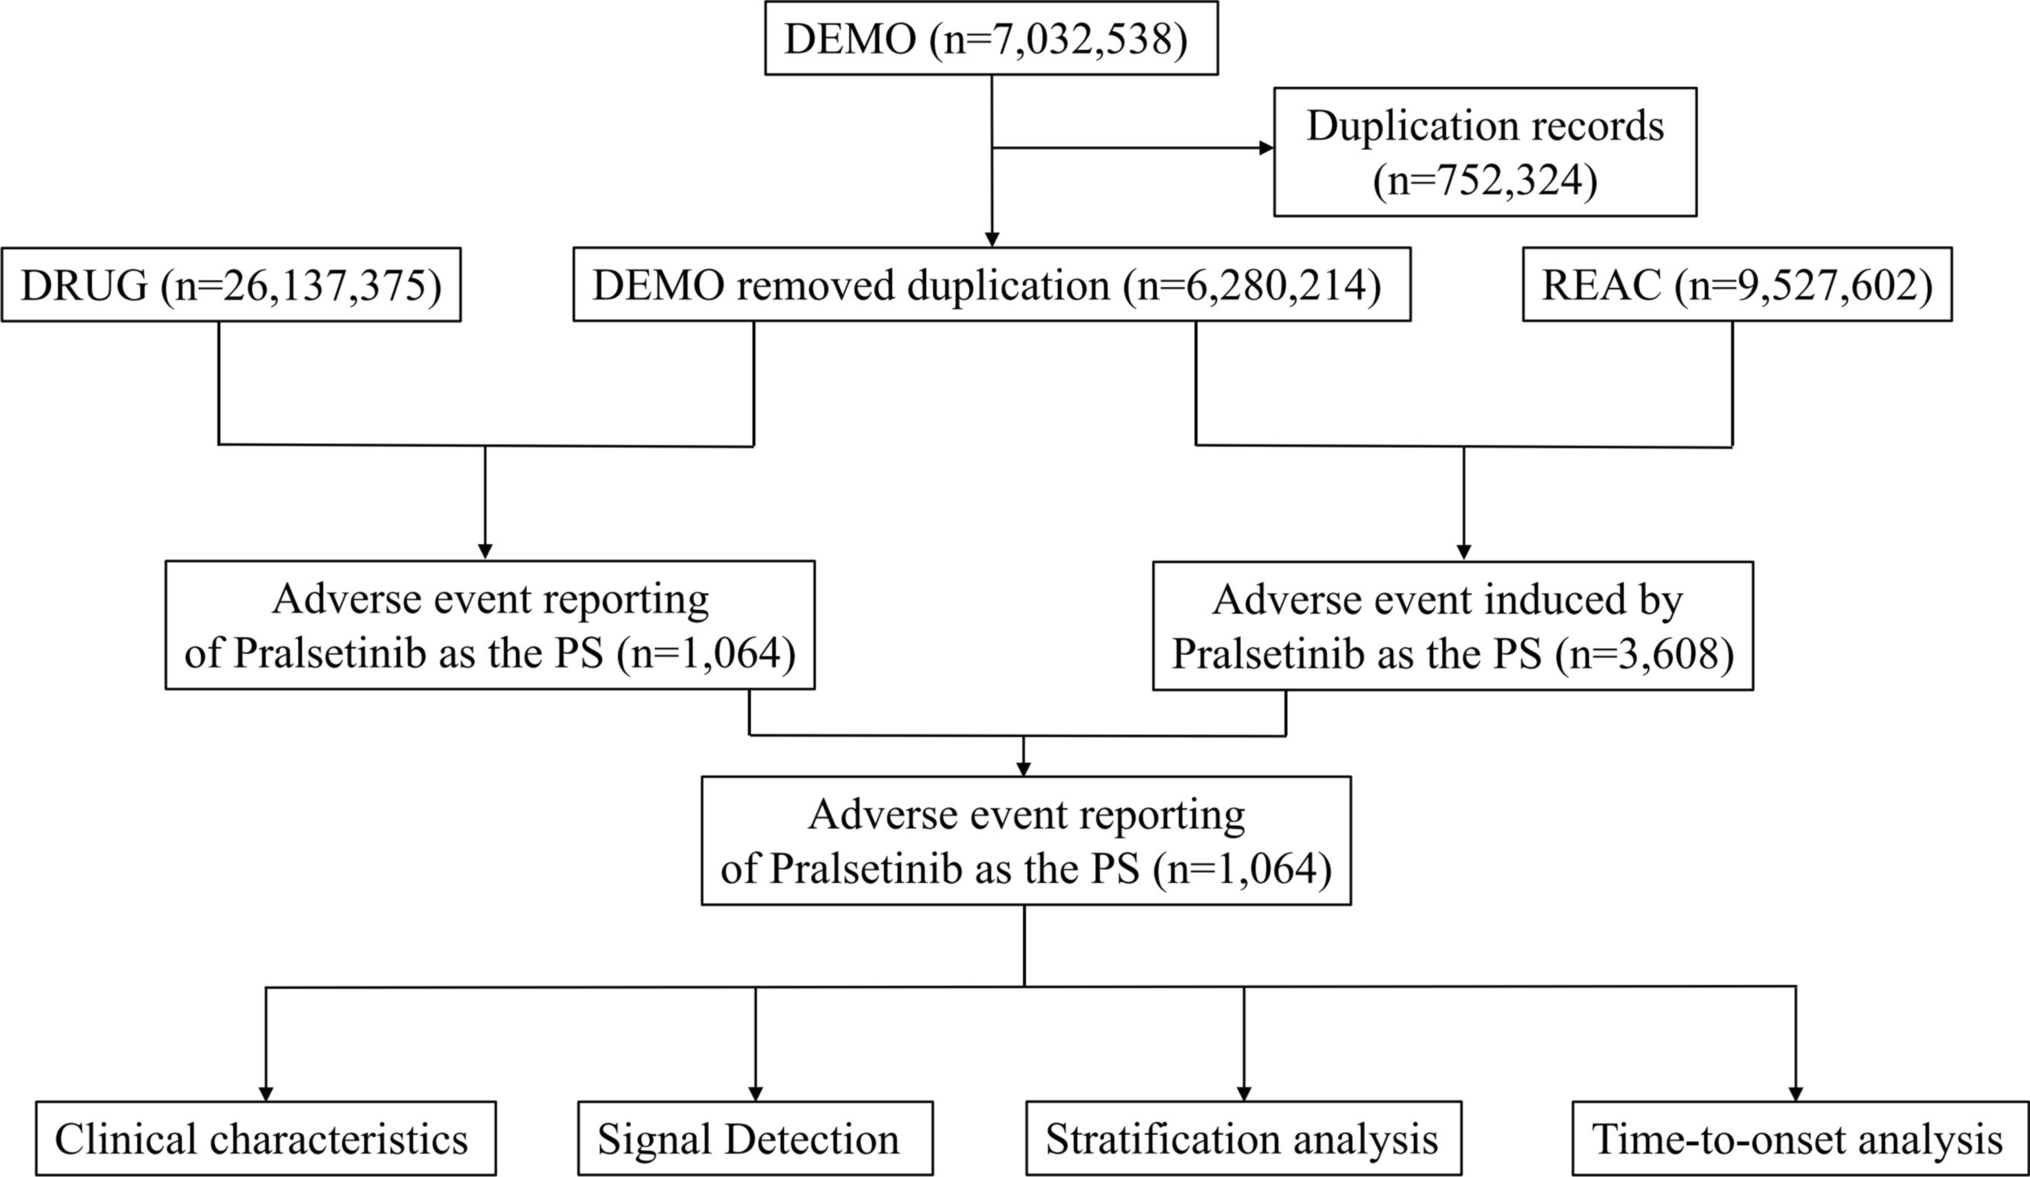
The CONSORT diagram for the overall study is presented in Fig. 1. Between the 8th October 2018 and the 17th August 2020, 204 consecutive adult women of childbearing age with a history of gastrointestinal intolerance to oral iron were screened in Cork, Ireland. Of these, almost two in three had low iron stores or iron deficiency (ferritin < 30 µg/L, n = 128, 62.7%). A total of 33 (16.2%) had anaemia (haemoglobin < 12 g/dL). Moderate to severe iron deficiency (ferritin cut-off 12 µg/L) affected 65 (31.9%) women and 24 of these also had anaemia. Details of the screened population according to ferritin levels ≥ or < 30 µg/L are presented in Table 1. Complete blood counts were available in 123 (60.3%) of the screened population and this subgroup showed similar levels of low iron stores (n = 82, 66.7%), associated with abnormal red blood cell indices (haemoglobin, haematocrit, mean corpuscular haemoglobin, mean corpuscular haemoglobin concentration and higher red blood cell distribution width). Only 17 (8.3%) of those with ferritin < 30 µg/L self-reported a history of iron deficiency and 26 (16.9%) reported a history of iron deficiency and/or anaemia.
Fig. 1
CONSORT Flow Diagram for the PRECISION study. A total of 52 women were not included in the prospective treatment study because they had iron deficiency without anaemia and the stratified quota of 30 women had already been reached. A further 8 were excluded because of severe anaemia and 9 did not want to participate in the prospective study for personal reasons. Participants in the prospective study were also more likely to have a history of iron deficiency and anaemia than the original screened cohort.
Table 1 Demographic, anthropomorphic, iron, haemoglobin and full blood count profile of adult women of childbearing age with a self-reported gastrointestinal intolerance to oral iron screened for our studyRecruitment to the prospective treatment study was stratified by anaemia status (maximum 30 participants with Hb < or ≥ 12 g/dL). Excluded (n = 145) were 76 women with normal ferritin levels (> 30 µg/L), 8 with severe anaemia and 52 with iron deficiency and normal haemoglobin (due to stratified randomisation). In addition, a further 9 women were not willing to participate in the prospective study for personal reasons. Randomisation was carried out by a statistician employed by Atlantia CRO and none of the study team or investigators had access to the randomisation code. Further details of the investigational product and blinding is provided in the Supplemental File. Three people were lost to follow up and 2 discontinued the intervention. However, the primary endpoint was analysed for all 59 participants on the assumption that those lost to follow up and those who discontinued were non-adherent (assumed medication possession ratio = 0). Due to the onset of COVID-19 pandemic and subsequent lockdowns, only 40 participants were able to attend the clinic for follow-up blood assessments. The study completed when the last participant was followed up. Last participant last visit was 10th November 2020.
Baseline characteristics of the prospectively studied populationThe baseline characteristics of the randomised, controlled, trial population and profile of adverse GI effects of prior iron products are presented in Table 2. The prior iron products and dose groupings are detailed in Supplemental File Table S1. Most participants (7 in 10) were taking high dose ferrous iron products and the most common oral iron adverse GI effect reported at baseline was constipation (affecting 3 in 4 women), followed by abdominal pain (affecting 1 in 2 women) and nausea (affecting 1 in 3 women). Following an average washout period of 9.8 ± 3.9 days, the overall GSRS score was significantly reduced in the cohort at the prospective study baseline (19.4 ± 7.05) compared with the previous iron product (30.6 ± 9.71, T-test P < 0.001 vs baseline).
Table 2 Demographic, anthropomorphic, iron, haemoglobin and full blood count profile of participants with ferritin < 30 µg/L and self-reported gastrointestinal intolerance to oral iron who were randomised to three different daily elemental iron doses of IWP (14 mg, 25 mg, 50 mg)Adherence/persistenceIn the 12-week interventional study, 3 participants stopped treatment due to possible (not probable) adverse effects, 1 participant withdrew for personal reasons (related to menorrhagia) and one participant was lost to follow-up following the baseline visit. For the purpose of the primary analysis, it was assumed that these 5 participants were non-adherent and non-persistent. A total of 48 (81.4%) participants were classified as adherent/persistent with therapy using IWP compared to 12 (20.3%) taking the prior oral iron (Fisher’s Exact test, P < 0.001). A total of 16 (88.9%), 17 (80.1%) and 15 (75.0%) participants taking 14 mg, 25 mg and 50 mg respectively were adherent/persistent with the therapy. These were significantly higher than the 4 (22.2%), 5 (23.8%) and 3 (15.0%) participants who persisted taking the previous oral iron in the respective 14 mg, 25 mg and 50 mg groups (Fisher’s Exact test, all P < 0.001 versus IWP) (Fig. 2). Overall, patients taking IWP were more likely (OR 4.0 (95% CI 2.4 to 6.7) to be adherent/persistent with IWP than with the previous oral iron (Fisher’s Exact Test, P < 0.001).
Fig. 2
Overall adherence/persistence with IWP amongst 59 women with a history of intolerance to oral iron and with low iron, moderate to severe iron deficiency or iron deficiency anaemia. The odds ratio (OR) for improvement in adherence/persistence was consistent across the three dose groups: 4.0 (95% CI 1.7 to 9.6) for IWP 14 mg (Fig. 2A); 3.4 (95% CI 1.5 to 7.5) for IWP 25 mg (Fig. 2B); 5.0 (95% CI 1.7 to 14.6) for IWP 50 mg (Fig. 2C), Logistic regression, all P < 0.05)
Median adherence with IWP was 96.4% (IQR 83.6, 100.6) over the course of 12 weeks and did not differ across the three dose groups (Supplemental File Figure S1). This includes a medication possession ratio expressed as % using pill-counts of 0 attributed to 5 women who withdrew from the study following randomisation. Of the remaining 54 women who persisted with therapy, 48 demonstrated good average adherence (≥ 80% medication possession ratio, based on pill counts). There was no association between IWP dose and average medication-possession-ratio (OR 0.99 (95%CI 0.61 1.58), P = 0.67) or overall adherence > 85% (OR 1.00 (95%CI 0.99 1.01), P = 0.81) when adjusted for baseline age, SBP, BMI using linear and logistic regression.
Elicited adverse gastrointestinal effects and gastrointestinal symptom rating scaleParticipants in the prospective study attributed an average of 4.0 ± 2.2 adverse GI effects to the prior oral iron product. Participants reported six times fewer adverse events that were possibly or probably associated with IWP (0.59 ± 0.91, T-test P < 0.001 versus prior oral iron product, Fig. 3). In accordance with these data, the overall GSRS score did not change from baseline (19.4 ± 7.1) to 6 weeks (21.6 ± 8.7) and 12 weeks (21.2 ± 7.5) post randomisation for the entire cohort (ANOVA, P = 0.33, Supplemental File Figure S2). Average GSRS on treatment with IWP was the same across the three dose groups: 20.2 ± 6.6 in the 14 mg daily dose group, 22.0 ± 6.6 in the 25 mg daily dose group and 21.1 ± 9.1 in the 50 mg daily dose group (ANOVA, P = 0.78). The average GSRS on treatment was strongly associated with the GSRS reported on prior iron products (OR 1.35 (95%CI 1.13 1.61)), but not with IWP dose group (OR 0.99 (95%CI 0.88 1.11)) using linear regression with adjustment for baseline age, SBP, BMI. A total of 44 (74.6%) and 29 (49.2%) women had reported constipation and abdominal pain respectively attributed to the previous oral iron product. This was reduced to 11 (18.6%) and 9 (15.3%) respectively with IWP. Four women reported diarrhoea with the previous oral iron product compared with 2 women taking IWP.
Fig. 3
Number of elicited adverse GI events reported with previous oral iron product in comparison with IWP amongst 59 women with a history of intolerance to oral iron with low iron, moderate to severe iron deficiency or iron deficiency anaemia. Overall, using logistic regression, women were 4.0 (95%CI 2.3 to 7.0, P < 0.001) more likely to experience constipation and 3.2 (95%CI 1.7 to 6.2, P < 0.001) more likely to experience abdominal pain with the prior oral iron product than with IWP. IWP Iron-whey-protein formulation
Effects on ferritin, transferrin saturation, haemoglobin and energy/fatigue levelsMedian ferritin levels overall increased from 8.00 (IQR 6.00; 13.0) to 15.5 (IQR 9.00;24.2) µg/L at 12 weeks over the study (Kruskal–Wallis test, P < 0.001, Fig. 4A). More detailed analysis of iron parameters in the IWP dose group is presented in Table 3, where within-group changes in ferritin and haemoglobin levels at 12 weeks were significant in the 25 mg and 50 mg dose groups only.
Fig. 4
Median ferritin A levels in women with iron deficiency (n = 40) and mean haemoglobin B levels over time in women with iron deficiency anaemia (n = 21). The mean ferritin increases within dose groups over 12 weeks using T-test were: 14 mg daily dose group 1.6 (95% CI − 1.4 to 4.6, P = 0.33) µg/L; the 25 mg daily dose group 6.6 (95% CI 2.5 to 10.7, P = 0.004) µg/L and 50 mg daily dose group 9.3 (95% CI 3.8 to 14.8, P = 0.002) µg/L. The mean increases in haemoglobin over 12 weeks within dose groups using T-tests were: IWP 14 mg daily dose group, 0.66 g/dL (95% CI -0.84 to 2.16, P = 0.43); IWP 25 mg daily dose group (0.86 g/dL (95% CI 0.38 to 1.33, P = 0.004); IWP 50 mg daily dose group, 1.35 g/dL (95% CI 0.54 to 2.16, P = 0.006). IWP Iron-whey-protein formulation, Hb Haemoglobin
Table 3 Detailed serum iron, transferrin saturation and ferritin in the overall cohort and in the three dose groupsThe within-group increases in ferritin (all T-tests) were 1.6 µg/L (95% CI − 1.4 to 1.4, P = 0.26) in the 14 mg dose group, 6.6 µg/L (IQR 2.5 to 10.7, P = 0.0042) in the 25 mg dose group and 9.3 µg/L (IQR 3.8 to 14.8, P = 0.0028) in the 50 mg dose group. Multivariable linear regression showed that changes in ferritin levels over 12 weeks were independently associated with IWP doses (OR 1.29 (95%CI 1.11, 1.51) and baseline ferritin level (OR 0.67 (95%CI 0.51, 0.89) with adjustment for baseline age, SBP and BMI. Transferrin saturation values increased during the study period within all dose groups, but were not significantly different across the three dose groups (Table 3). In participants with anaemia, haemoglobin levels increased from 11.36 g/dL (95% CI 10.95 to 11.77) to 12.40 g/dL (95% CI 12.03 to 12.76, T-test, P < 0.001, Fig. 4B). The within-group increases (all T-tests) were 0.56 g/dL (95% CI − 0.61 to 1.73, P = 0.26) in the 14 mg dose group, 0.84 g/dL (95% CI 0.27 to 1.42, P = 0.016) in the 25 mg dose group and 1.35 g/dL (95% CI 0.54 to 2.16, T-test, P < 0.01) in the 50 mg dose group (Table 3). Multivariable linear regression showed that change in haemoglobin levels over 12 weeks was not independently associated with IWP doses (OR 1.02 (95% CI 1.00, 1.03, P = 0.08) with adjustment for baseline age, SBP, BMI and baseline haemoglobin level (Supplemental File Table S2).
The SF-36 Energy/Fatigue domain scores in the population at baseline (60.9 ± 3.4%) were significantly impaired compared to all the other domain scores at baseline (T-test, all P < 0.001, Supplemental File Figure S3) and were similar in participants with low iron stores (ferritin 12–30 µg/L, SF-36 Energy/Fatigue 61.1 ± 5.1%) and those with moderate to severe iron deficiency (ferritin < 12 µg/L, SF-36 Energy/Fatigue 60.9 ± 4.5%). These scores increased significantly in the overall group over the study period reaching scores of 71.2 ± 2.6% (T-test, P < 0.001) and significant within group changes were observed in the 25 mg and 50 mg daily dose groups (Supplemental File Figure S4).
Comments (0)