
Remember me

Data acquisition, blood sampling, quantification of CMRGlu [10, 14, 16] and estimation of BOLD signal changes [17] were conducted analogous to our previous work, unless otherwise specified.
Experimental designIn this cross-sectional study 35 participants underwent either a simultaneous fPET/fMRI (n = 19) or separate fPET and fMRI scans (n = 16, 5.2 ± 5.8 days between scans) with the radiotracer [18F]FDG. During each of the scans an established working memory task was completed in a conventional block design. fPET started with an initial resting period of 8 min, which was followed by 12 min of task performance. The initial baseline was omitted for the MRI-only scan, but the task was otherwise identical. MRI acquisitions included a T1-weighted structural image and a BOLD sequence.
Cognitive taskThe established n-back working memory task [18] was implemented in Psychtoolbox for Matlab. In this task letters were presented on a screen for 0.5 s, followed by an interstimulus interval of 1.9 s. During the 0-back control condition, a button press was required when the letter “X” appeared on the screen. For the 2-back condition, a button press was required when the current letter was the same as the one shown two letters before. Before each task block the corresponding instructions were shown for 2 s. The two conditions were shown in blocks of 36 s, each comprising 15 stimuli and 5 button presses (pseudo-randomized order). Resting periods were included at the beginning of the task (14 s), after each instruction (2 s) and after each task block (32 s). For each condition 5 blocks were presented in pseudo-randomized order, resulting in a total task duration of 12 min. The letters used in the task were phonologically similar in the German alphabet to avoid learning strategies [19, 20]. Small as well as capital letters were used equally (b, c, d, g, p, t, w). During all periods of rest, participants were instructed to look at a crosshair, relax and not to focus on anything in particular. Before data acquisition, participants completed a training session of each task condition inside the scanner to familiarize themselves with the task and the controls.
ParticipantsFor this study 42 healthy participants were initially recruited, and data from 35 were used in the final analysis (mean age ± sd = 24.5 ± 4.4 years, 19 women). Dropout reasons included: blood sampling failures (n = 3), problems with the tracer administration (n = 3) and gross anatomical abnormalities (n = 1). Additionally, BOLD data could not be used for two participants due to technical reasons, blood glucose levels were not available for one subject and working memory performance data for another one due to failure of the response box. As no studies with such a high temporal resolution of fPET data are available (previously 6–12 s [14] and 16 s [13]), we aimed for a sample size that exceeds previous work with robust task activation by at least 50%. Each participant underwent an initial screening visit, where general health was ensured. Routine medical examinations included blood tests, electrocardiography, neurological testing and the structural clinical interview for DSM-IV. Female participants underwent pregnancy tests at the screening visit and before the PET and/or MRI scans. Further exclusion criteria were current and previous severe somatic, neurological and psychiatric conditions, substance abuse or medication, pregnancy or breastfeeding, MRI contraindications and previous study-related radiation exposure. At the screening visit, all participants provided written informed consent after detailed explanation of the study protocol. Participants were reimbursed and insured during the study. The study was approved by the ethics committee of the Medical University of Vienna (ethics numbers 1479/2015 and 2054/2020) and all procedures were carried out according to the Declaration of Helsinki.
Data acquisitionSimultaneous acquisition of fPET and fMRI data was done with a mMR scanner system. Separate acquisition was carried out with a Biograph Vision PET/CT and a Prisma MRI scanner (all Siemens Healthineers, Erlangen, Germany).
Participants had to fast at least 5.5 h before the start of the fPET scan (except for unsweetened water) [21]. The radiotracer [18F]FDG was administered in a bolus (816 ml/h for 1 min) plus constant infusion protocol (114.9 ml/h for 19 min, total of 50 ml) for the entire fPET scan using a perfusion pump (Syramed µSP6000, Arcomed, Regensdorf, Switzerland), which was kept in an MR-shield (UniQUE, Arcomed).
With the PET/MR scanner, BOLD fMRI was acquired simultaneously with fPET (EPI sequence, TE/TR = 30/2000 ms, flip angle = 90°, matrix size = 80 × 80, 34 slices, voxel size = 2.5 × 2.5 × 3.325 mm, 12 min). Furthermore, a structural MRI was recorded before fPET acquisition, to rule out gross anatomical abnormalities and for spatial normalization (T1-weighted MPRAGE sequence, TE/TR = 4.21/2200 ms, TI = 900 ms, flip angle = 9°, matrix size = 240 × 256, 160 slices, voxel size 1 × 1 × 1.1 mm, 7.72 min).
For the separate MRI acquisition, corresponding imaging data were acquired (EPI sequence: TE/TR = 30/2050 ms, flip angle = 78°, matrix size = 100 × 100, 35 slices, voxel size = 2.1 × 2.1 × 3.5 mm, 12 min; T1-weighted MPRAGE sequence: TE/TR = 2.91/2000 ms, TI = 900 ms, flip angle = 9°, matrix size = 240 × 256, 192 slices, voxel size 1 × 1 × 1 mm, 8 min).
Blood samplingBefore the fPET scans, blood glucose levels were determined using the average of 3 sequential measurements (Gluplasma). During the fPET scans, arterial blood samples were taken manually from the left radial artery. This included sampling every 20 s for the first three minutes, and thereafter at 4, 5, 8, 12, 16 and 20 min. We aimed to minimize the effects of blood sampling on task performance in several ways. First, samples after 5 min were taken remotely (outside 20 mT line) with a VAMP Plus system (Edwards Lifesciences), which enables continuous and gentle blood drawing and subsequent flushing with NaCl. This sampling technique allowed for minimal interaction with the participant, avoiding manipulation and movement of the participant’s arm for blood drawing. Second, it was carried out cautiously by an experienced and carefully trained physician to minimize the ability of subjects to recognize the sampling. Third, to minimize biasing task effects, the sampling was done on the left arm during baseline, whereas the task was executed with the right hand. Notably, none of the subjects reported that blood sampling was distracting them from task performance. Whole-blood activity was measured in a gamma counter (Wizard2, Perkin Elmer). Samples obtained after 3 min were centrifuged and the plasma activity was measured. Whole-blood data were linearly interpolated to match fPET frames and multiplied with the average plasma-to-whole-blood ratio to obtain the arterial input function.
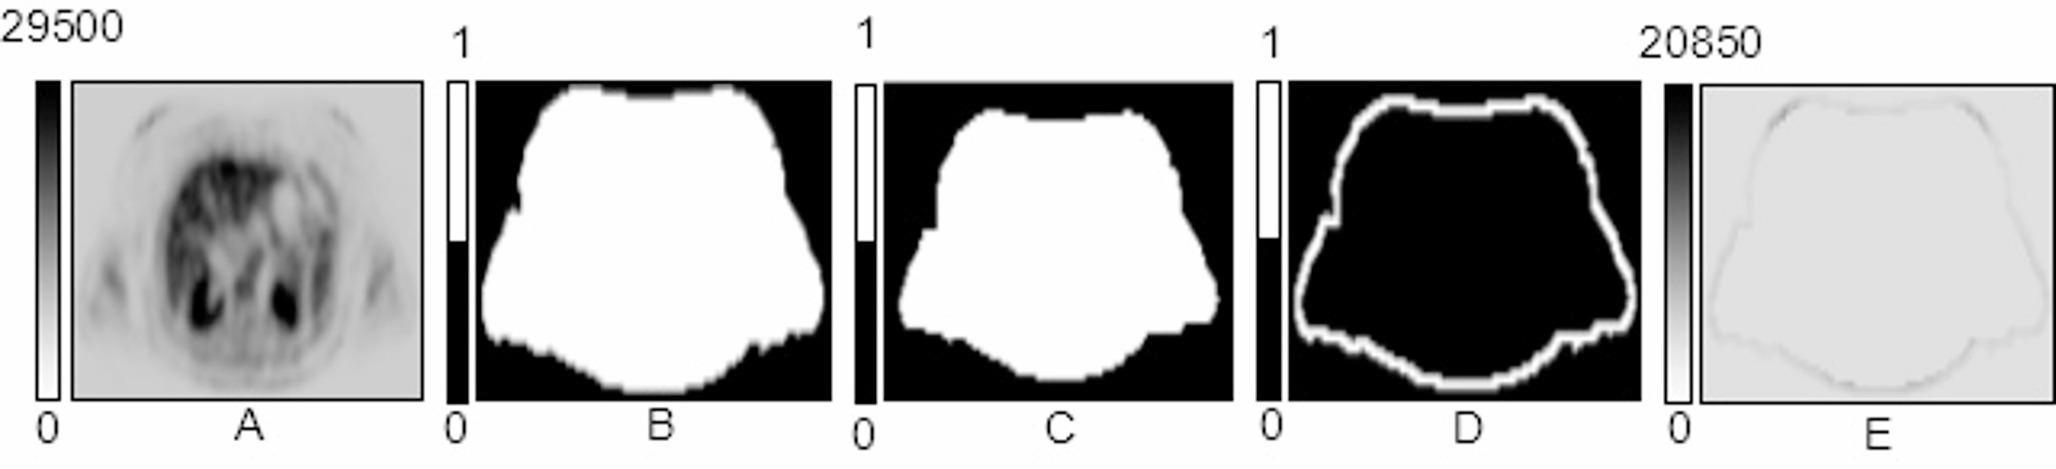
fPET preprocessingfPET data recorded at the PET/MR were corrected for attenuation using a database approach based on the T1-weighted structural image [22] and reconstructed to frames of 3, 6 and 12 s (matrix size = 344 × 344, 127 slices). PET/CT data were attenuation-corrected with an ultra low-dose CT scan obtained in the beginning of the fPET session (voltage: 120 kV, tube current 20 mA, Care-Dose4D, CarekV). Data were reconstructed to the same time frames as for the PET/MR scans (matrix size = 220 × 220, 159 slices). Preprocessing was carried out in SPM12 (https://www.fil.ion.ucl.ac.uk/spm/), which included motion correction (quality = 1, register to mean) and spatial normalization to MNI space with the T1-weighted structural image.
We implemented a novel filtering technique in Matlab to increase the low SNR inherent to high-temporal resolution PET data since short frames contain less radioactive counts. The filter represents a dynamic non-local means (NLM) filter [15] with a modified local patch selection. Generally, NLM filters create a weighted average of neighbouring voxels within a given search window in the spatial and temporal domain. These types of filters have been shown to provide an improved contrast-to-noise ratio in dynamic PET images compared with other more conventional denoising approaches [23]. The novel aspect implemented here is a sliding-window approach, instead of using the entire PET time course [15]. This confines the denoising of each voxel both temporally and spatially, preventing the baseline [18F]FDG uptake to drive the signal and thereby specifically strengthening task-specific effects. The local neighbourhood was selected with a sliding-window approach for each voxel using a spatiotemporal patch of 3 × 3 × 3 voxels in a search window of 11 × 11 × 11 voxels. The temporal patch comprised 15, 18 and 12 s for the 3, 6 and 12 s reconstructions, respectively. The weight is given by the similarity between voxels (i.e., Gaussian distance from centre voxel) as in the original description [15]. Data were subsequently smoothed with a 5 mm Gaussian kernel in SPM12. Together with the NLM filter, this corresponds approximately to a total kernel of 8 mm, which facilitates comparison with BOLD data and previous work.
Cerebral metabolic rate of glucose (CMRGlu)Quantification of CMRGlu was carried out voxel-wise. Data were masked to include only gray matter by using a binarized gray matter segment of the SPM12 tissue probability map, thresholded at 0.1. To further improve the SNR in the temporal domain, a low pass filter (12-order finite impulse response filter) was used with a cutoff frequency of 1/18 s. This was selected in analogy to our previous work [9, 10, 14] as it represents half the task block duration. To separate task-specific effects from baseline metabolism, the general linear model (GLM) was used, which included one regressor for the baseline, one for each task condition and motion regressors. The baseline regressor was defined individually for each participant as the average fPET signal across all gray matter voxels, excluding a union of voxels activated during each participant’s individual BOLD fMRI response (2-back vs. rest, p < 0.001 uncorrected) and those identified in a meta-analysis [18]. This combination of a meta-analytical ground and individual activation ensures that task effects do not contaminate the baseline and yields an optimal model fit [14]. The task regressors were defined as a ramp function with slope = 1 kBq/frame. For the motion regressors, the realignment parameters obtained from SPM12 were subject to a principal component analysis and a variable amount of regressors were included using the elbow method, to ensure that the majority of explained variance is covered. Using the GLM output of the different conditions and the arterial input function, the Patlak plot was employed for absolute quantification of glucose metabolism. This yields the influx constant Ki, which reflects the combination of the individual rate constants K1-k3
$$K_i=_k_3/(k_2+k_3)$$
(1)
Ki was then converted to the cerebral metabolic rate of glucose (CMRGlu)
$$CMRGlu=_}/LC\ast100$$
(2)
with LC being the lumped constant, which was set to 0.89 [24]. This results in task-specific maps of Ki and CMRGlu, which were used for subsequent analysis.
Blood-oxygen level dependent (BOLD) signal changesBOLD data were processed in SPM12 [17]. Images were corrected for slice timing effects (reference = middle slice) and head motion (quality = 1, register to mean), followed by spatial normalization to MNI space and spatial smoothing with an 8 mm Gaussian kernel. Task-related changes in the BOLD signal were computed with the GLM, including one regressor for each condition (0-back, 2-back) as well as potentially confounding signals (instructions, 24 motion parameters [25], white matter and cerebrospinal fluid). The autocorrelation option was set to FAST [26]. The contrast of interest was 2-back vs. rest to facilitate comparison with fPET data.
Statistical analysesFor statistical analyses data from n = 35 participants were used for [18F]FDG glucose metabolism and n = 33 for BOLD signal analyses (n = 2 missing due to technical reasons). For correlation between the signals in the temporal domain and association with task performance, n = 17 with simultaneous PET/MRI acquisition were used.
Spatial conjunction of task-specific neuronal activationTo assess the spatial overlap between changes in the BOLD signal and metabolic demands as induced by the 2-back working memory task, a statistical conjunction analysis was carried out in SPM12 [27]. BOLD and Ki maps were individually z-scored and included in a one-way ANOVA with each modality representing a “group” and an additional factor accounting for the different scanners (i.e., PET/MR vs. separate PET/CT and MRI). Ki was used instead of CMRGlu as blood glucose data was missing for one subject. The conjunction was corrected for multiple comparisons using family-wise error rate (FWE) at the voxel level (p < 0.05) and clusters with less than 5 voxels were removed. This was carried out for the three different fPET reconstructions of 3, 6 and 12 s. The Dice coefficient was used to assess the spatial agreement between the three resulting conjunction maps. For completeness and comparison with previous work [12, 27], inference was also computed at p < 0.05 FWE-corrected cluster level after an initial voxel threshold of p < 0.001 uncorrected.
Time-domain analysesTask-specific signals were obtained as GLM residuals after removing all effects except those of the task. The resulting BOLD signal and [18F]FDG time series were extracted from significant voxels of the above spatial conjunction (p < 0.05 FWE-corrected voxel-level). For visualization, these were averaged across 2-back blocks, participants and voxels for a time window starting 12 s before the task began until 36 s after the task (total of 84 s). Next, the BOLD and metabolic signals were correlated within each subject to evaluate the individual coupling between the two imaging modalities. These correlation values were further associated with the working memory performance, specifically the average reaction time of correct responses during the 2-back condition. This was done separately for each brain region (three clusters of the right DLPFC, left primary motor cortex, right insula, left and right intraparietal sulcus). Spearman’s rho was used to account for an outlier with substantially slower reaction time (> 3*sd of the group) and corrected for the seven brain regions using the Bonferroni method. To assess the robustness of the brain-behaviour association, the time window was also constrained to -12… + 24 s, -6… + 12 s and -6… + 6 s, followed by re-calculation of the correlation. To rule out that individual associations between metabolic and BOLD signals are driven by motion, these values were correlated with framewise displacement as obtained from the BOLD realignment parameters [28].
Analyses of the posterior cingulate cortex (PCC)We further investigated a previously reported spatial dissociation of glucose metabolism and BOLD responses in the PCC [12]. First, separate maps with a negative BOLD response and a positive metabolic response during the 2-back working memory task were computed (p < 0.05 FWE-corrected cluster level following p < 0.001 uncorrected voxel level). Specific attention was given to the PCC, as we recently showed an opposite influence of the FPN and DAN metabolism onto the PCC [27]. Thus, the difference in task-specific Ki between FPN and DAN during the 2-back working memory condition was computed. Percent signal change was used to enable better comparison between the different networks. Based on this difference, participants were split into three groups comprising those where metabolism of FPN < DAN (lower quartile, low group), FPN = DAN (interquartile range, balanced group) and FPN > DAN (upper quartile, high group). [18F]FDG metabolic time series were then extracted for the PCC region [27] and the three groups, which were compared using a repeated measures ANOVA, where the interaction between groups by time served as the relevant outcome parameter. Similarly, BOLD signal time courses were extracted from the PCC and compared in a repeated measures ANOVA.
Scanner comparisonThe secondary aim was to investigate differences between PET scanners, here we compared a widely used mMR PET/MR to a new generation Vision PET/CT with time-of-flight (both Siemens) in the feasibility to compute high-temporal resolution fPET. For the subsequent analyses, data were extracted from regions with significant activation during the 2-back condition (p < 0.05 FWE corrected voxel-level, Fig. 1a). In the temporal domain the identifiability of task-specific changes in glucose metabolism is given by t-values of the GLM analysis, i.e., the estimated effect size divided by the standard error [14]. A two-sample t-test between the scanners was performed. Next, Ki percent signal change was compared between the scanners, again with a two-sample t-test.
Fig. 1
Spatial correspondence of BOLD fMRI changes and [18F]FDG fPET glucose metabolism induced by the 2-back task condition. Statistical conjunction analysis between the two signals yields robust task effects in several brain regions involved in working memory [18], such as the right dorsolateral prefrontal cortex, left primary motor cortex and bilateral anterior insula (blue: p < 0.05 FWE-corrected voxel level, yellow: p < 0.05 FWE-corrected cluster level following p < 0.001 uncorrected voxel level). The effects were stable for different temporal resolutions of the fPET data, namely 3s (a), 6s (b) and 12s (c). Dice coefficients between the activation patterns obtained with the three temporal resolutions were between 0.71 and 0.78. Voxel-level corrected regions of the 3s data (i.e., blue regions in a) were used for subsequent temporal assessment. MNI coordinates for slices are z = -1, 17 and 35 mm. Left is left
SimulationsSimulations were carried out to assess whether the observed time course of the [18F]FDG metabolic signal matches theoretical calculations. The two-tissue compartment model was implemented in Matlab with an average arterial input function and rate constants as observed in our previous work at resting state (K1 = 0.0827 ml/cm3/min, k2 = 0.0771 min−1, k3 = 0.0629 min−1, k4 = 0 min−1) [14, 16]. Task-specific changes in rate constants were introduced to simulate physiologically plausible increases in Ki (see Eq. 1). Previous work showed task-induced changes in Ki around 22% [9, 10], but for completeness also increases of 12 and 33% were introduced. These values were obtained by the following changes in rate constants i) K1 = 10% and k3 = 10%, ii) K1 = 12% and k3 = 5%, iii) K1 = 8% and k3 = 15%, iv) K1 = 15% and k3 = 12%, v) K1 = 5% and k3 = 8%. In all cases k2 = -K1 [29,30,31,32]. Please see discussion for a neurophysiological rationale of these parameter variations. In addition, the simulation was repeated with baseline rate constants of previous work (K1 = 0.1 ml/cm3/min, k2 = 0.15 min−1, k3 = 0.08 min−1, k4 = 0 min−1) [8].
Comments (0)