
Remember me
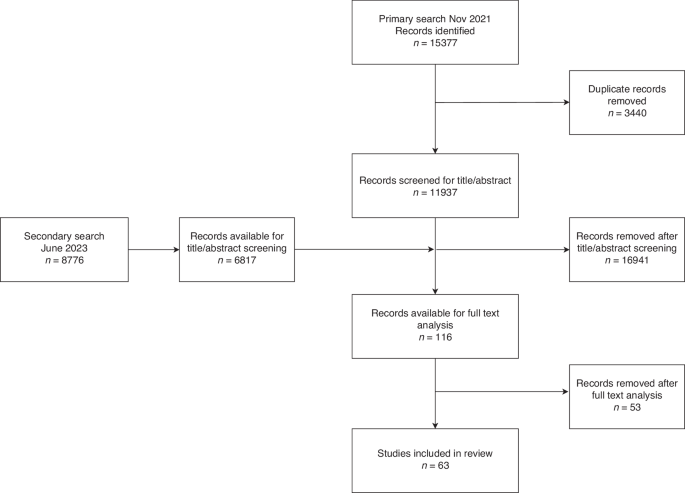

The search strategy yielded 3114 unique titles (Fig. 1). We excluded 2932 records after titles or abstract screening, leaving 182 papers for full-text screen. After full-text screen we excluded 116 publications that did not meet the inclusion criteria. Sixty-six papers were deemed potentially eligible for inclusion. An additional 35 were excluded because data was not stratified for 75 years and older to enable data extraction. Searches of reference lists and additional sources identified 5 additional papers, resulting in a total of 36 studies included in this review [4, 16,17,18,19,20,21,22,23,24,25,26,27,28,29,30,31,32,33,34,35,36,37,38,39,40,41,42,43,44,45,46,47,48,49,50].
Fig. 1
Study identification and selection.
Table 1 summarises study characteristics. All included studies contained either observational (n = 27) or modelled/simulated data (n = 9). No RCTs which evaluated mammography screening in women 75 years and older were identified. As such, all included observational studies were subject to potential selection bias, confounding and lead time bias, with the vast majority of observational studies deemed at critical or serious risk of bias and only two studies at moderate risk of bias. Of the modelling studies, most did not report the assumptions made within the model, and a few failed to describe the validation process (Supplementary Appendix 2). As such, two were deemed low risk of bias, six at moderate risk, and one at high risk of bias.
Of the 27 observational studies, 18 studies followed up women after screening and/or diagnosis; [4, 16, 21, 23, 26, 32, 33, 35,36,37, 40,41,42,43, 45, 48,49,50] follow-up times in these studies ranged from 4 months to 20 years. Three studies did not include any comparison group and provided only descriptive statistics [22, 24, 27] and three studies compared groups by detection methods in those with breast cancer [32, 33, 36]. One study had multiple comparisons (by age and screening history) [35]; the remaining studies compared mammography screening outcomes in women aged 75 years and older with screening outcomes in women: of other ages (ten studies) [4, 16, 18, 20, 21, 23, 25, 38, 43, 48]; differing screening histories (three studies) [44,45,46]; differing screening intervals (three studies) [37, 40, 41] or historical unscreened women (one study) [49]; women who did not screen (one study) [42] and women who stopped screening (two studies) [26, 50]. (Table 1).
Of the nine modelling studies included, comparisons and screening histories varied: no comparisons (two studies) [28, 29], comparison of different screening recommendations (one study) [17], comparing with women who have stopped screening (four studies) [30, 34, 39, 47], and comparing screening women of different ages (two studies) [19, 31]. (Table 1).
Outcomes reported in each study varied widely. We have therefore classified outcomes across studies into five groups: measures of health benefits (Table 2); measures of screening harms (Table 3); screening detection measures (Table 4); cancer characteristics (Table 5); and treatment patterns (Table 6). Not all studies presented outcomes in each of these categories.
Table 2 Measures of health benefit.Table 4 Screening detection measuresa.Table 5 Cancer characteristics.Table 6 Treatment patterns.Measures of health benefitThe health benefits of screening in women over 75 years were reported using heterogeneous outcome measures that included breast cancer mortality, all cause/other cause mortality, survival, life years gained, and measures of quality-adjusted life years and cost effectiveness (Table 2).
Of the 14 studies that reported breast cancer mortality, two studies showed a significant decrease in breast cancer mortality among women who had screen-detected breast cancer compared to women who had their cancer detected by other means including those detected clinically; (HR: 0.50 (0.31–0.82) p < 0.001, and HR: 0.38 (0.24–0.61), p < 0.001) [32, 33]; Simon (2013 and 2014) [40, 41] also demonstrated an increased hazard ratio (HR) as the mammography screen interval increased in women who screen (2–5 years screen interval HR: 1.87 (1.10–3.19), 5+ years screen interval or no mammography HR: 3.17 (1.68–5.96); and 2–5 years screen interval HR: 1.62 (1.03–2.54), 5+ years screen interval or none HR: 2.80 (1.57–5.00). McCarthy [35] showed an increased HR in non-users compared to regular users of mammography screening (HR 75–84 yrs: 2.47 (1.70–3.58)). Schousboe [39] demonstrated a decrease in the number of breast cancer deaths by continuing screening beyond the age of 75, with various estimates stratified by Charlson Comorbidity score (CCS) and age for continuing screening (CCS0: Compared to stopping at 75 yrs, deaths averted per 1000 screens, 80 y: 1.7 (1.2–2.2); 85 y: 2.8 (2.0–3.6); 90 y: 3.5 (2.5–4.4)) .
In contrast, four studies [23, 37, 44, 45] showed no significant differences in breast cancer mortality between screen-detected cancers in women aged 75 years and older and their comparator, comprising younger women (66–74 vs 75–84 years: 0.24% (0.21–0.27%) vs 0.29% (0.25–0.34%)) [23], those who did not attend their last screen (RR: 2.87 (95%CI 0.62–13.2)) [44], those who had not participated (Rate ratio: 1.05 (0.27–4.14)) [45], and those who had never/less frequently attended screening (HR: 0.67 (0.31–1.44)) [37]. One study showed similar estimates for breast cancer deaths averted for those screened annually from 40 to 75 years vs those screened annually from 40 to 85 years (6.9 v 7.2 per 1000 women) [30].
Only two cohort studies compared the risk of breast cancer death between women who stopped screening at 75 years and those who continued [26, 50], both of which reported a non-significant difference in breast cancer mortality. Garcia-Albeniz (2020) reported the 8-year risk of breast cancer death of 0.07 per 1000 women [26] and Richman reported a breast cancer mortality hazard ratio of 0.87 (95% CI 0.55–1.37) [50]. Two microsimulation modelling studies [34, 47] however indicated benefits (in terms of life-years gained (LYG)) for continuing screening into older age (difference in LYG per 1000 women—stopping at 79 vs 69: 23.5 [34], 4.8–7.8LYG per 1000 screens (screening a woman at age 80) [47], as well as a reduction in breast cancer mortality (7% reduction in BC mortality) [34].
All four studies that reported survival showed that screening increased survival (Table 2) [32, 35, 36, 49].
Demb et al. [23] showed that across age-groups (66–74 vs 75–84 vs 85–94) of women who had at least one screen, breast cancer mortality modestly increased (0.24% (0.21–0.27%) vs 0.29% (0.25–0.34%) vs 0.31% (0.21–0.43%), whereas mortality from other causes substantially increased (14.5% (14.3–14.8%) vs 35.7% (35.3–36.1%) vs 65.4% (64.3–66.5%)). Additional outcomes data, including by co-morbidity where reported, are shown in Table 2.
Measures of screening harmsMeasures that were considered screening harms included rates of false positives and recalls, biopsy, and overdiagnosis (Table 3).
In the seven studies that reported on false positives and recalls [17, 18, 21, 30,
Comments (0)