
Remember me
In total, 419 samples from 310 patients (166 patients in the proven/probable IA group, 144 patients in the non-IA group) were tested, including 332 serum samples and 87 BALF samples.
The patient characteristics and underlying diseases in this study are summarized in Table 1. Compared with the non-IA group, the number of males in the IA group was higher, but the difference was not statistically significant (P > 0.01). The non-IA group was older than the IA group (P < 0.01). The common underlying diseases in IA patients were diabetes mellitus, sepsis, and acute myeloid leukemia. The most common symptoms in IA patients were cough, sputum, and fever. Chest pain, dyspnea, and hemoptysis were not common in IA patients.
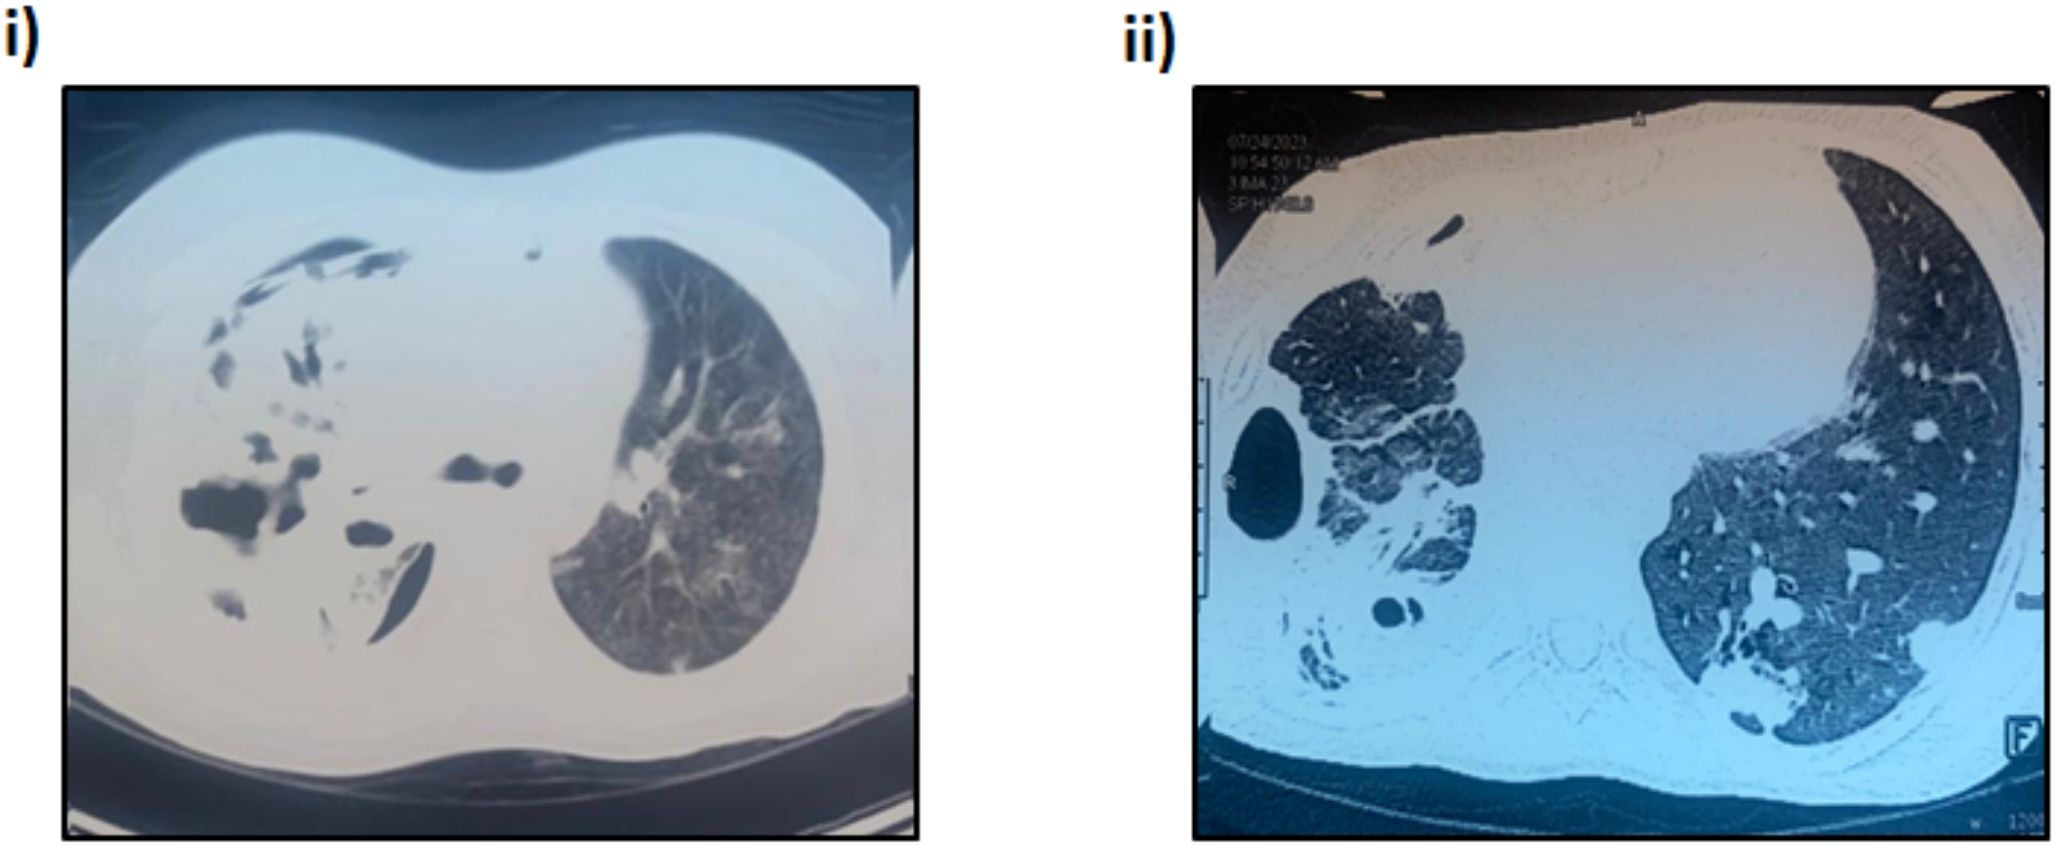
Table 1 Characteristics of the IA group and non-IA groupFig. 2 shows representative chest computed tomography (CT) images of some cases. In these IA patients, specific chest CT findings, such as the air crescent sign and halo sign, were rare. The chest CT findings showed that the incidence of single or multiple nodules was consistent with other reports [11].
Fig. 2
Representative examples of chest CT findings in IA patients. A Aspergillus nodules in the right upper and lower lobes and left lower lobe. B An Aspergillus nodule with pleural effusion in the left lobe. C Consolidation in the right middle lobe and left upper lobe. D Bronchiectasis in the right lower and middle lobes. E An Aspergillus nodule with cavitary lesions in the right middle lobe.
Aspergillus spp. were isolated from eight patients. One of the patients was infected with both A. terreus and A. nidulans. Aspergillus spp. were tested in seven patients by mNGS. One of the patients was infected with A. fumigatus, A. terreus, and A. flavus. The differences in the median GM I value in the serum and BALF samples between the IA group and the non-IA group were significant (P < 0.0001 and 0.0022).
There was no significant difference in the C-reactive protein (CRP) concentration in peripheral blood between the IA group and the non-IA group (P > 0.05). The IA group showed significantly higher levels of interleukin-6 (IL-6) and procalcitonin (PCT) in peripheral blood than the non-IA group (P < 0.05, Fig. 3). Previous studies confirmed that IL-6 and PCT concentrations were positively correlated with galactomannan levels. This result suggests that the diagnostic potential of more cytokines for IA should be tested, and their binding with other IA biomarkers should be evaluated [12,13,14].
Fig. 3
Comparisons of CRP concentration (A), IL-6 concentration (B), and PCT concentration (C) in peripheral blood between IA and non-IA patients. The mean and standard error are shown in the figures.
Percent agreement of LFA and ELISAIn serum sample, BALF samples, and total samples, the total percent agreement (TPA) between LFA and ELISA was 92.47%, 94.25%, and 92.84%, respectively, representing good agreement.
The positive percent agreement (PPA) and negative percent agreement (NPA) for serum samples were 95.11% and 89.19%, respectively, with most of the discordance arising due to samples that were negative by LFA but positive by ELISA. The PPA and NPA for BALF samples were 93.33% and 96.30% (Table 2), respectively.
Table 2 Observed qualitative sample agreement between LFA and ELISAConcordance between LFA and ELISAThe semiquantitative correlation between the GM I values calculated by LFA and ELISA was excellent (Spearman’s coefficient, r = 0.9022). For serum samples, the semiquantitative correlation between the GM I values for LFA and ELISA was better than that for BALF samples (Spearman’s coefficient, r = 0.9064 vs. r = 0.8805, Fig. 4).
Fig. 4
Linear correlation between the GM I value generated by LFA and ELISA when testing all samples (A), serum samples (B), and BALF samples (C).
Analysis of detection levelsThe median levels detected by LFA in serum samples from the IA group were significantly higher than those detected by ELISA (P = 0.006), but there was no significant difference in BALF samples between LFA and ELISA (P = 0.081). In the non-IA patient samples, there was no significant difference in serum and BALF samples between LFA and ELISA (P = 0.3232 and 0.7567). The detection levels of the two assays are summarized in Fig. 5.
Fig. 5
Comparisons of GM I values between LFA and ELISA in IA patients and non-IA patients. The mean and standard error are shown.
Lymphopenia, neutropenia, and CD4 T cells are essential factors in immunocompromised patients. In the study by Cordonnier et al., there was a significant difference in GM levels between neutropenic patients and nonneutropenic patients [15]. According to some studies, neutropenia is a considerable risk factor for fungal infections.
In the study by Susianti et al., there were no significant differences in the total leucocyte count and neutrophil count in the fungal-infected group and nonfungal-infected group [16]. Our results are consistent with the literature in that there were no significant differences in GM I values among IA patients with and without neutropenia (P > 0.05). There were no significant differences in the GM I values in IA patients with and without leukopenia (P > 0.05, Fig. 6).
Fig. 6
Comparisons of LFA GM I values among IA patients with and without neutropenia (A). Comparisons of LFA GM I values among IA patients with and without leukopenia (B). The mean and standard error are shown.
Performance of LFA and ELISAAt the manufacturer’s recommended GM I value of 0.5, the sensitivity and specificity of LFA were 82.57% and 90.76% in serum samples and 89.47% and 92.00% in BALF samples, respectively. The sensitivity and specificity of ELISA in serum samples and BALF samples were greater, as shown in Table 3. ROC analysis confirmed the best LFA I values to be 0.4 and 0.5 in serum and BALF samples, respectively (Fig. 7). ROC analysis confirmed the best ELISA optimal positivity threshold to be 0.51 and 0.50 in serum and BALF samples, respectively. The performances of GM (LFA/ELISA) for diagnosing IA at the best I value in different samples are shown in Table 4.
Table 3 Performance parameters of LFA and ELISA for diagnosing IA at I value = 0.5 in serum and BALFFig. 7
Receiver operating characteristic curves of LFA and ELISA in IA patients and non-IA patients. The AUCs of serum LFA, BALF LFA, serum ELISA, and BALF ELISA were 0.872 (95% CI, 82.14–92.34), 0.882 (95% CI, 79.27–97.08), 0.901 (95% CI, 85.56–94.73), and 0.924 (95% CI, 84.87–99.90), respectively.
Table 4 Performance parameters of LFA and ELISA for diagnosing IA at the best optical density index in serum and BALFKinetic profile analysis of LFA and ELISAWe selected three patients and analyzed all of their GM test results. At an I value of 0.5, LFA and ELISA could monitor the GM levels in the serum of IA patients and non-IA patients (Fig. 8). Continuous dynamic monitoring of high-risk patients has value in early diagnosis and confirms that monitoring the dynamic change in serum GM content is also conducive to the judgment of the treatment effect and the development of the disease.
Fig. 8
Representative galactomannan (GM) kinetic trends over time for IA patients (A) and non-IA patients (B) as determined by LFA and ELISA. The red-dotted lines indicate the manufacturer’s recommended optical density index for LFA (I value = 0.5) and ELISA (I value = 0.5).
Comments (0)