
Remember me

The study was approved by the Veterans Affairs Institutional Review Board. VCTE was introduced to the VA Greater Los Angeles Healthcare System (VAGLAHS) in 03/2016 for assessment of hepatic fibrosis. In 01/2017, the CAP was introduced for HS measurement. We queried the Corporate Data Warehouse, a repository of all clinical health data at VAGLAHS, from 01/2017 to 0/62020.
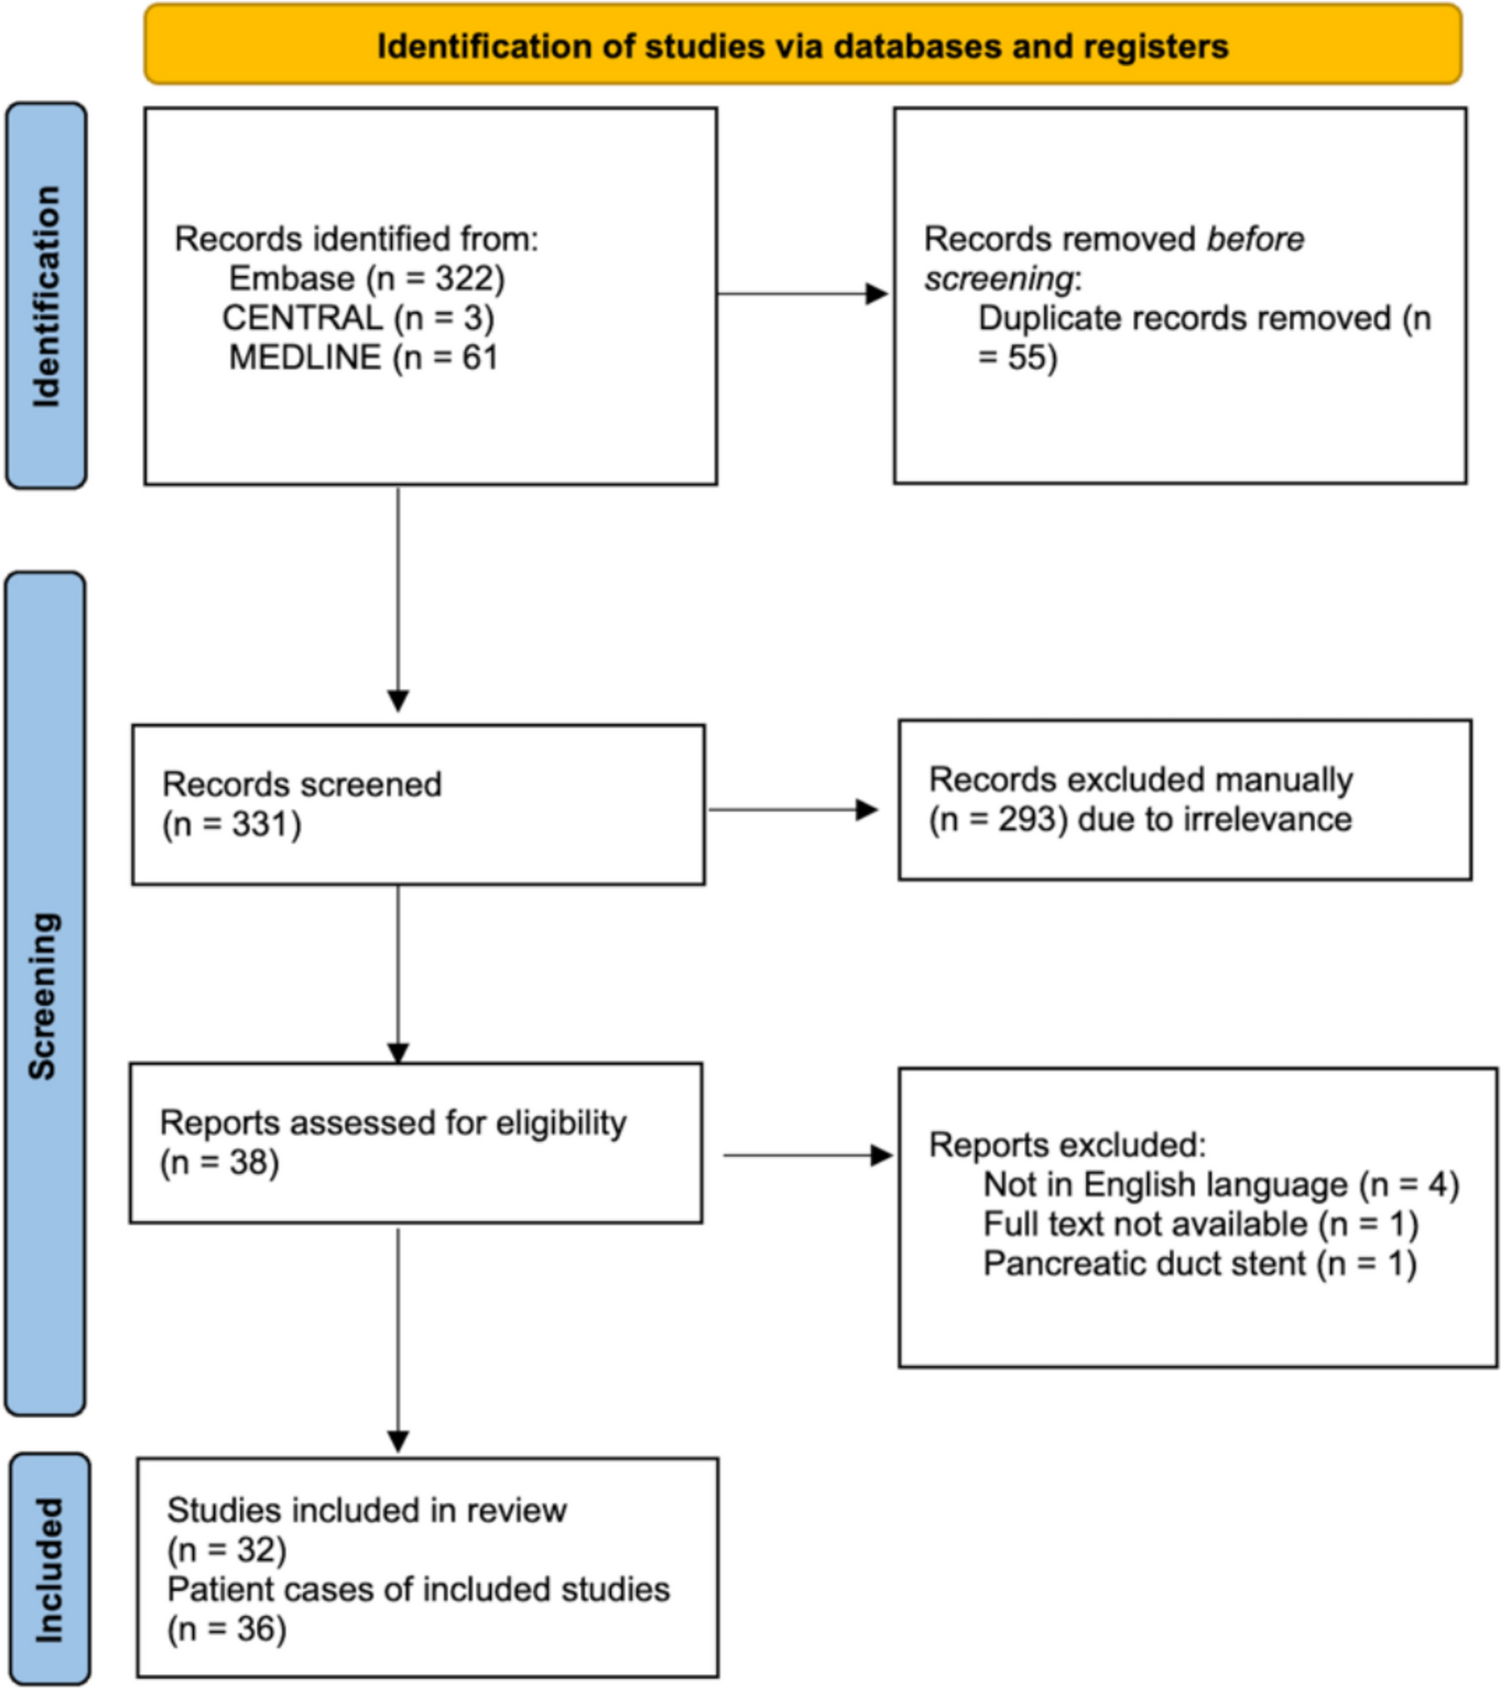
Discovery CohortAt VAGLAHS, 1,767 VCTE records were available between 01/2016 and 06/2020, of which 1,403 had a CAP score. As VCTE is operator dependent and requires training for proficiency [22], we selected cases from 2018 to 2020 to allow enough time for operators to become proficient. Three trained navigators (S.B., R.S., A.L.) abstracted clinical data from the EHR using a common data abstraction form after being trained by the same person (S.B). Near the end of data abstraction, one primary clinician abstractor (S.B.) reviewed a 20% random sample from each abstractor’s data sample to assure accuracy of data. The study team discussed and resolved any discrepancies by consensus. This resulted in 740 unique patients with VCTE reports. Exclusion criteria were as follows: high-risk ethanol use (any AUDIT-C > 3 in women or > 4 for men [20] or with a diagnosis of alcohol-associated liver disease (ALD) made by a hepatologist); chronic HCV genotype 3 (n = 4), given its competing cause of HS; patients with a history of primary or secondary liver malignancy or who had a liver transplantation were also excluded; and VCTE reports with poor technical quality (liver stiffness measurement interquartile range (IQR) > 30% [23]), resulting in 434 patients. Patients lacking any radiographic or LB data were also excluded, yielding a final discovery cohort of 403 patients (Fig. 1).
Fig. 1 Data Collection
Socio-demographic and clinical information were collected from the EHR including age, sex, race, ethnicity, hepatitis B surface antigen, hepatitis C antibody, hepatitis C RNA, human immunodeficiency virus (HIV) antibody, and antiviral treatment history (hepatitis B and C); body mass index (BMI) and systolic and diastolic blood pressures on the date of VCTE; and whether patients had active prescriptions for anti-hypertensives, statins, or for diabetes medications at the time of VCTE. Laboratory parameters including white blood cell count, platelet count, ALT, aspartate aminotransferase (AST), alkaline phosphatase (AP), total bilirubin, lipid panel, hemoglobin A1c, random glucose, and lipid panel were also obtained. All laboratory parameters were collected on dates closest to the VCTE date and no more than 1 year from the VCTE date. All VCTE (Fibroscan® 502 touch) reports were reviewed. CAP score, LSM with IQR, and probe size (M or XL) were obtained from each VCTE report.
Selection of CovariablesCovariables were selected a priori based on previous NAFLD algorithms, considering both biological plausibility and clinical availability. We included age, sex, and race, and ethnicity due to prior studies describing their associations [24]. Given that many of the clinical and laboratory variables were part of the metabolic syndrome, multicollinearity was evaluated prior to final covariable selection (Supplementary Fig. 2). Patients who were prescribed statin medications exhibited a significantly lower low-density lipoprotein (LDL) (p < 0.001; Supplementary Fig. 3), so we avoided inclusion of both LDL and use of statin because of the anticipated causal relationship. We assessed the effect of anti-hypertensive medication prescription rather than blood pressure measurement, given that single random blood pressure on the day of the VCTE may not accurately capture a clinical diagnosis of hypertension. For diabetes, because having an active prescription for diabetes medication did not have the predicted relationship with hemoglobin A1c (being on treatment for was associated with higher hemoglobin A1c, p < 0.001; Supplementary Fig. 4), we defined diabetes as a hemoglobin A1c > 6.5% or having a diabetes medication prescription. We considered including HDL, triglycerides and BMI as components of metabolic syndrome, consistent with the National Heart, Lung, and Blood Institute (NHLBI) definition and given the AGA Clinical Care Pathway guidance statement (see Introduction). Given that triglycerides are commonly defined in the NHLBI metabolic syndrome definition, they were selected for inclusion over HDL. ALT and AST demonstrated a high correlation (r = 0.81), and given the association between ALT and NAFLD in previous work [20], ALT alone was selected for inclusion.
Validation CohortTo validate the predicted NAFLD clinical definition and CAP score, we identified 40 unique Veterans in 2017–2021. VCTE reports and either imaging (US or MRI) or LB were available for all 40 patients (see Statistical Analysis for power calculation).
Imaging DataUS and MRI abdomen were reviewed centrally for the presence or absence of HS, by a single expert abdominal radiologist (F.H.) who was blinded to the remainder of the data and statistical analysis. Of note, only 7 MRI with elastography with PDFF to quantitate HS were available and included in our cohort (MRE was introduced after VCTE at GLA). HS on MRI was identified using T1-weighted gradient-echo in-phase and out-of-phase sequences. If there was signal drop out in the out-of-phase sequence compared to in-phase, then HS was diagnosed. Computerized tomography imaging data were excluded because of its limited accuracy in HS diagnosis [25]. All imaging data were obtained at the time closest to the VCTE date, with median time of 8.2 weeks for US and 2.1 weeks for MRI. Of note, 3 abdominal USs were conducted outside our local VA including through community care, which were not able to be reviewed locally.
Liver BiopsyLB pathology reports were reviewed when available. The presence or absence of HS was recorded as a binary variable and included any grade of steatosis. Of note, NAFLD activity score was not clinically utilized.
Statistical AnalysisCovariable DescriptionsPatient demographics and clinical parameters were summarized by mean ± standard deviation (SD) for continuous variables and frequency (%) for categorical variables.
Power Calculation for Validation CohortTo test the fit of our 6-predictor regression, assuming the tests for total regression with R2 = 0.35 (F2 = 0.55), n = 29 patients were needed for a power of 80% and a significance of 0.05.
Development and Performance of NAFLD DefinitionMultivariable linear regression modeling using CAP score as a continuous variable and backward elimination of covariables to determine significant predictors of HS. Specifically, the “caret” library in R was used to implement the leave-one-out, cross-validation approach, which offers more stable estimates in high-dimension, small sample data. To evaluate the performance of our NAFLD definition, we determined the sensitivity, specificity, positive predictive value (PPV), and negative predictive value (NPV). We calculated the correlation between predicted and actual CAP scores.
Determination of CAP ThresholdGiven the heterogeneity in steatosis thresholds across different populations [26], we developed an internally validated CAP threshold that distinguishes presence or absence HS in Veterans. We defined the HS using a hierarchical composite algorithm where all available LBs were selected first (classified as positive or negative for any grade of HS), followed by all unique MRIs (classified as positive or negative for HS), and finally unique US (classified as positive or negative HS). Agreement between the test results for LB, MRI, and US were explored using Cohen’s kappa. Associations between CAP score and each of LB, MRI, and US were explored using unpaired t tests. Receiver operating characteristic (ROC) analysis was used to determine the Veteran-specific CAP cut-off using our HS definition as a binary variable. When results occasionally conflicted, the result from the more accurate test was used, as defined by LB, followed by MRI, and then US. Each patient was only counted once. We identified 31 patients without a LB, MRI, or US. Since CAP scores of the 31 patients ranged from no HS to severe steatosis [27] (Supplementary Fig. 1), they were excluded from our final cohort (Fig. 1). The optimal CAP threshold for HS detection was selected using the Youden method. The ROC curve was plotted using R 4.1 library pROC. The optimal cut-off was identified using library cutpointr function “oc_youden_kernel,” which maximizes both sensitivity and specificity on the ROC curve after smoothing of the predictor by a binned kernel density estimate. p values are from 2-sided tests with p < 0.05 considered statistically significant. Analyses was completed in R 4.1.2.
Comments (0)