Study population
This study is based on data from the 10 K study, a large-scale prospective cohort study conducted as part of the Human Phenotype Project (HPP) cohort. Launched in Israel in 2018, the 10 K study included individuals aged between 40 and 70 years. Individuals with certain predefined conditions were excluded: persons with cardiovascular disease, chronic neurologic or psychiatric diagnoses, chronic respiratory disease, chronic kidney disease, chronic gastrointestinal disease, chronic metabolic disease, and subjects with previous or active malignancy [13]. Thus, data from 4690 participants could be used for the analyses [14].
The 10 K cohort study was conducted according to the principles of the Declaration of Helsinki and was approved by the Institutional Review Board (IRB) of the Weizmann Institute of Science. All participants signed an informed consent form.
At baseline, the study collected sociodemographic data, information on lifestyle factors, health status, environment, and psychological aspects. Self-administered questionnaires were used. The questions followed the structure and content of the questions from the UK BioBank. The lifestyle questions included information on smoking status, alcohol consumption, and physical activity. Questions were also asked about sleep behavior, among other things. When registering for the 10 K study, participants completed an online questionnaire on medical diagnoses (direct questions about specific diseases and previously diagnosed diseases). At the baseline examination at the study center, research staff asked participants about known medical diagnoses and the approximate dates of their onset. The questions and self-reported medical diagnoses were coded according to ICD-11 and defined as prevalent diagnoses.
As part of a physical examination, anthropometric measurements such as height, weight, BMI, and waist and hip circumference were recorded. Height was measured without shoes using a Shekel stadiometer model H150-01–5, weight by Shekel, model H150-01–5. One blood pressure measurement was obtained after five minutes of chair-seated rest using an OMRON blood pressure monitoring device.
Exposures
At baseline participants underwent continuous sleep monitoring over three nights. Sleep characteristics were measured using a home sleep apnea-monitoring device (WatchPAT 300 by Itamar Medical) that included an actigraph, a pulse oximeter, and acoustic sensors [15]. The WatchPAT 300 comprised a WatchPAT device that is worn around the wrist to measure hand movements, a chest movement and snoring sensor positioned on the chest, and a photoplethysmography (PPG) built onto a sleeve worn on the finger that measures pulse rate and digit blood flow (the PAT signal). The PPG also measures oxygen saturation. Based on these sensors, proprietary software calculated several parameters that measured oxygen saturation, respiratory events, heart rate, snoring, total sleep time, and sleep architecture. The WatchPAT device has been validated against polysomnography for estimation of sleep parameters including total sleep time, demonstrating moderate to good agreement across multiple populations [16,17,18].
In this study, the following objectively measured sleeping parameters served as exposures: the total sleep time accurate to the second, the mean oxygen saturation (%), and the sleep efficiency defined as the percentage of sleep duration relative to the time a person spent in bed, and thus
$$\text= 100\cdot \frac}}$$
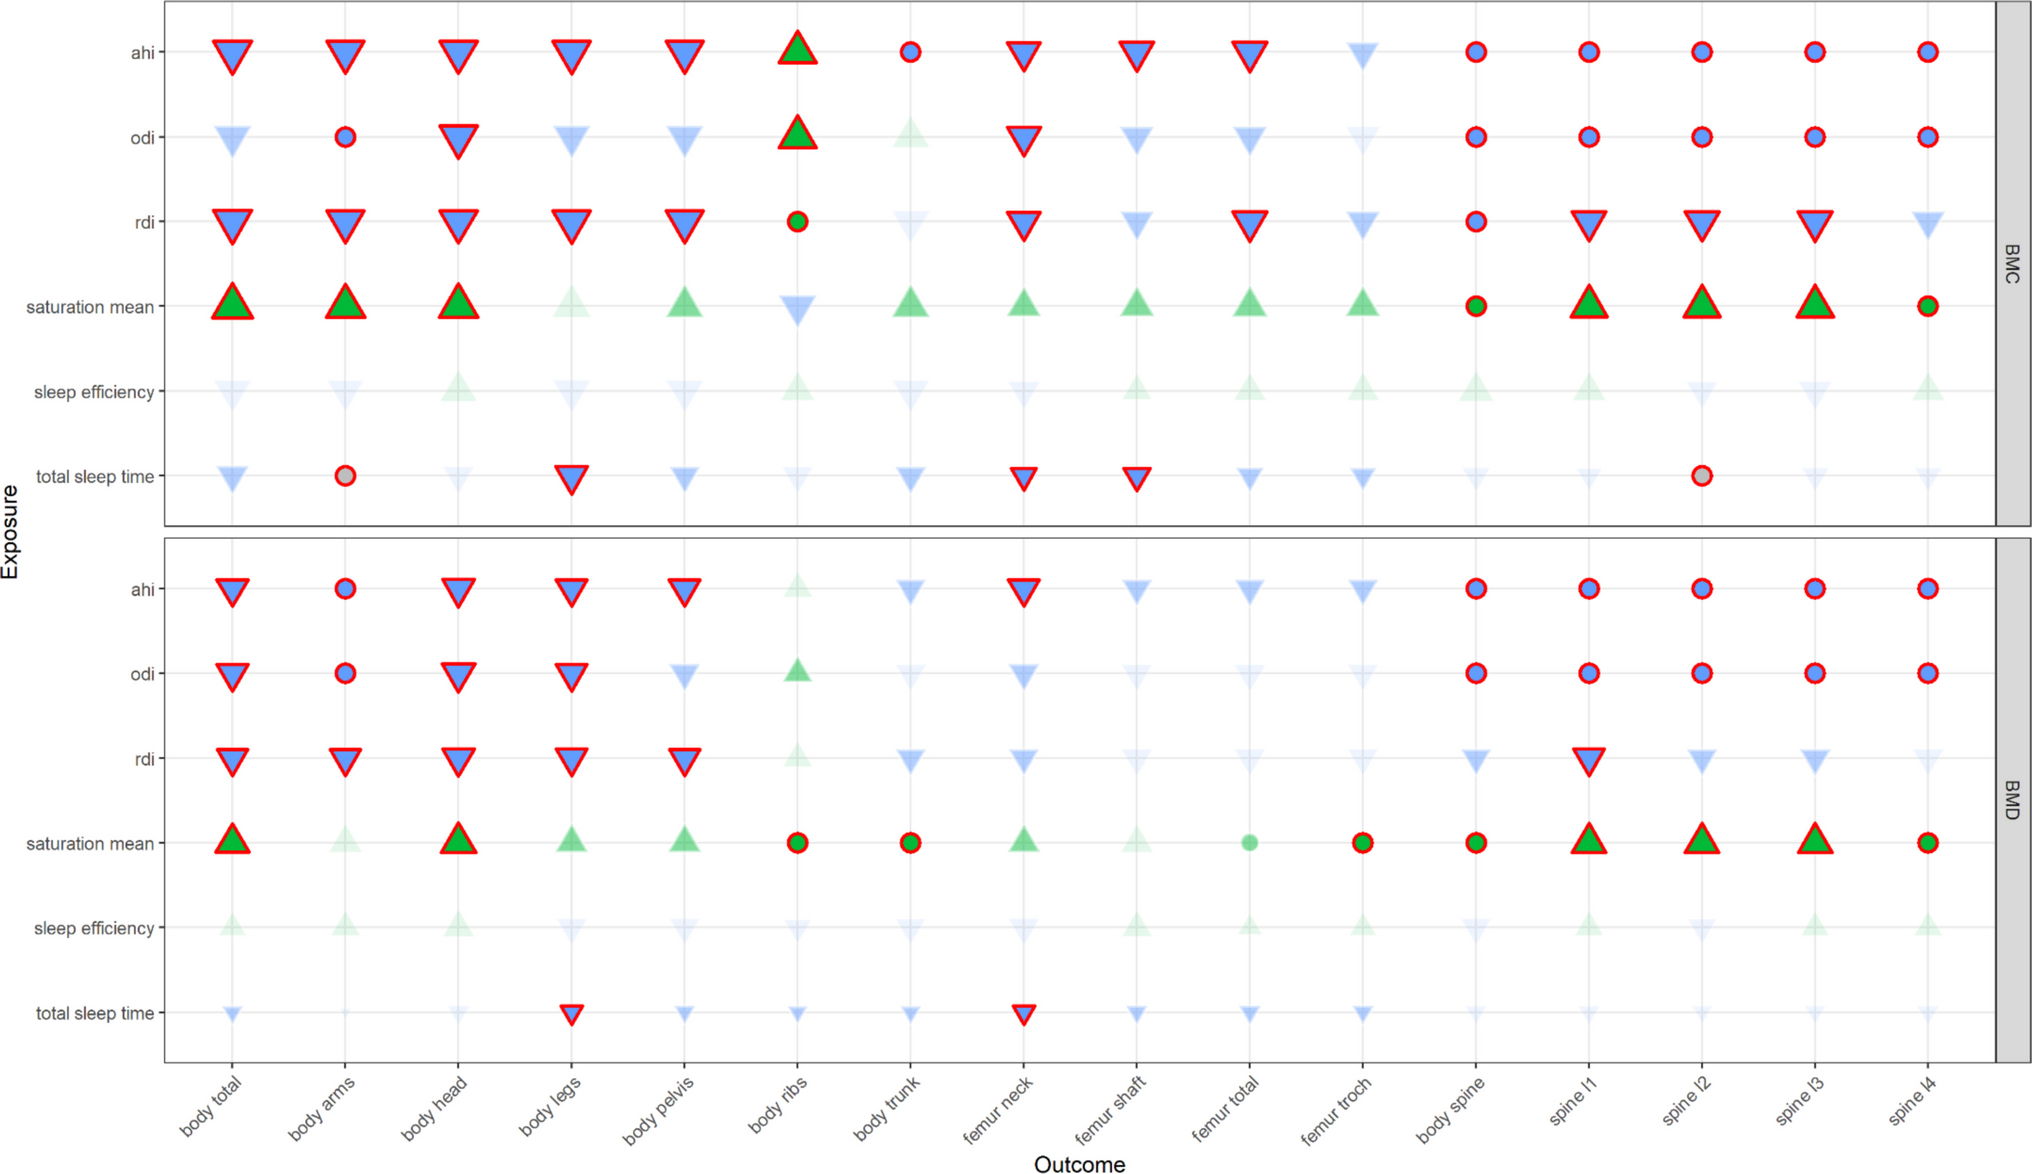
Furthermore, the following three main indices, which are used for the diagnosis of obstructive sleep apnea (OSA), were considered in the analyses: the respiratory disturbance index (RDI)—as the hourly rate of respiratory apnea and hypopnea, the apnea-hypopnea index (AHI)—describing the hourly rate of apnea and hypopnea events during sleep, and the oxygen desaturation index (ODI)—indicating the hourly rate of oxygen desaturation events.
All sleeping parameters in the analyses represent the mean values of measurements over three nights.
Outcomes
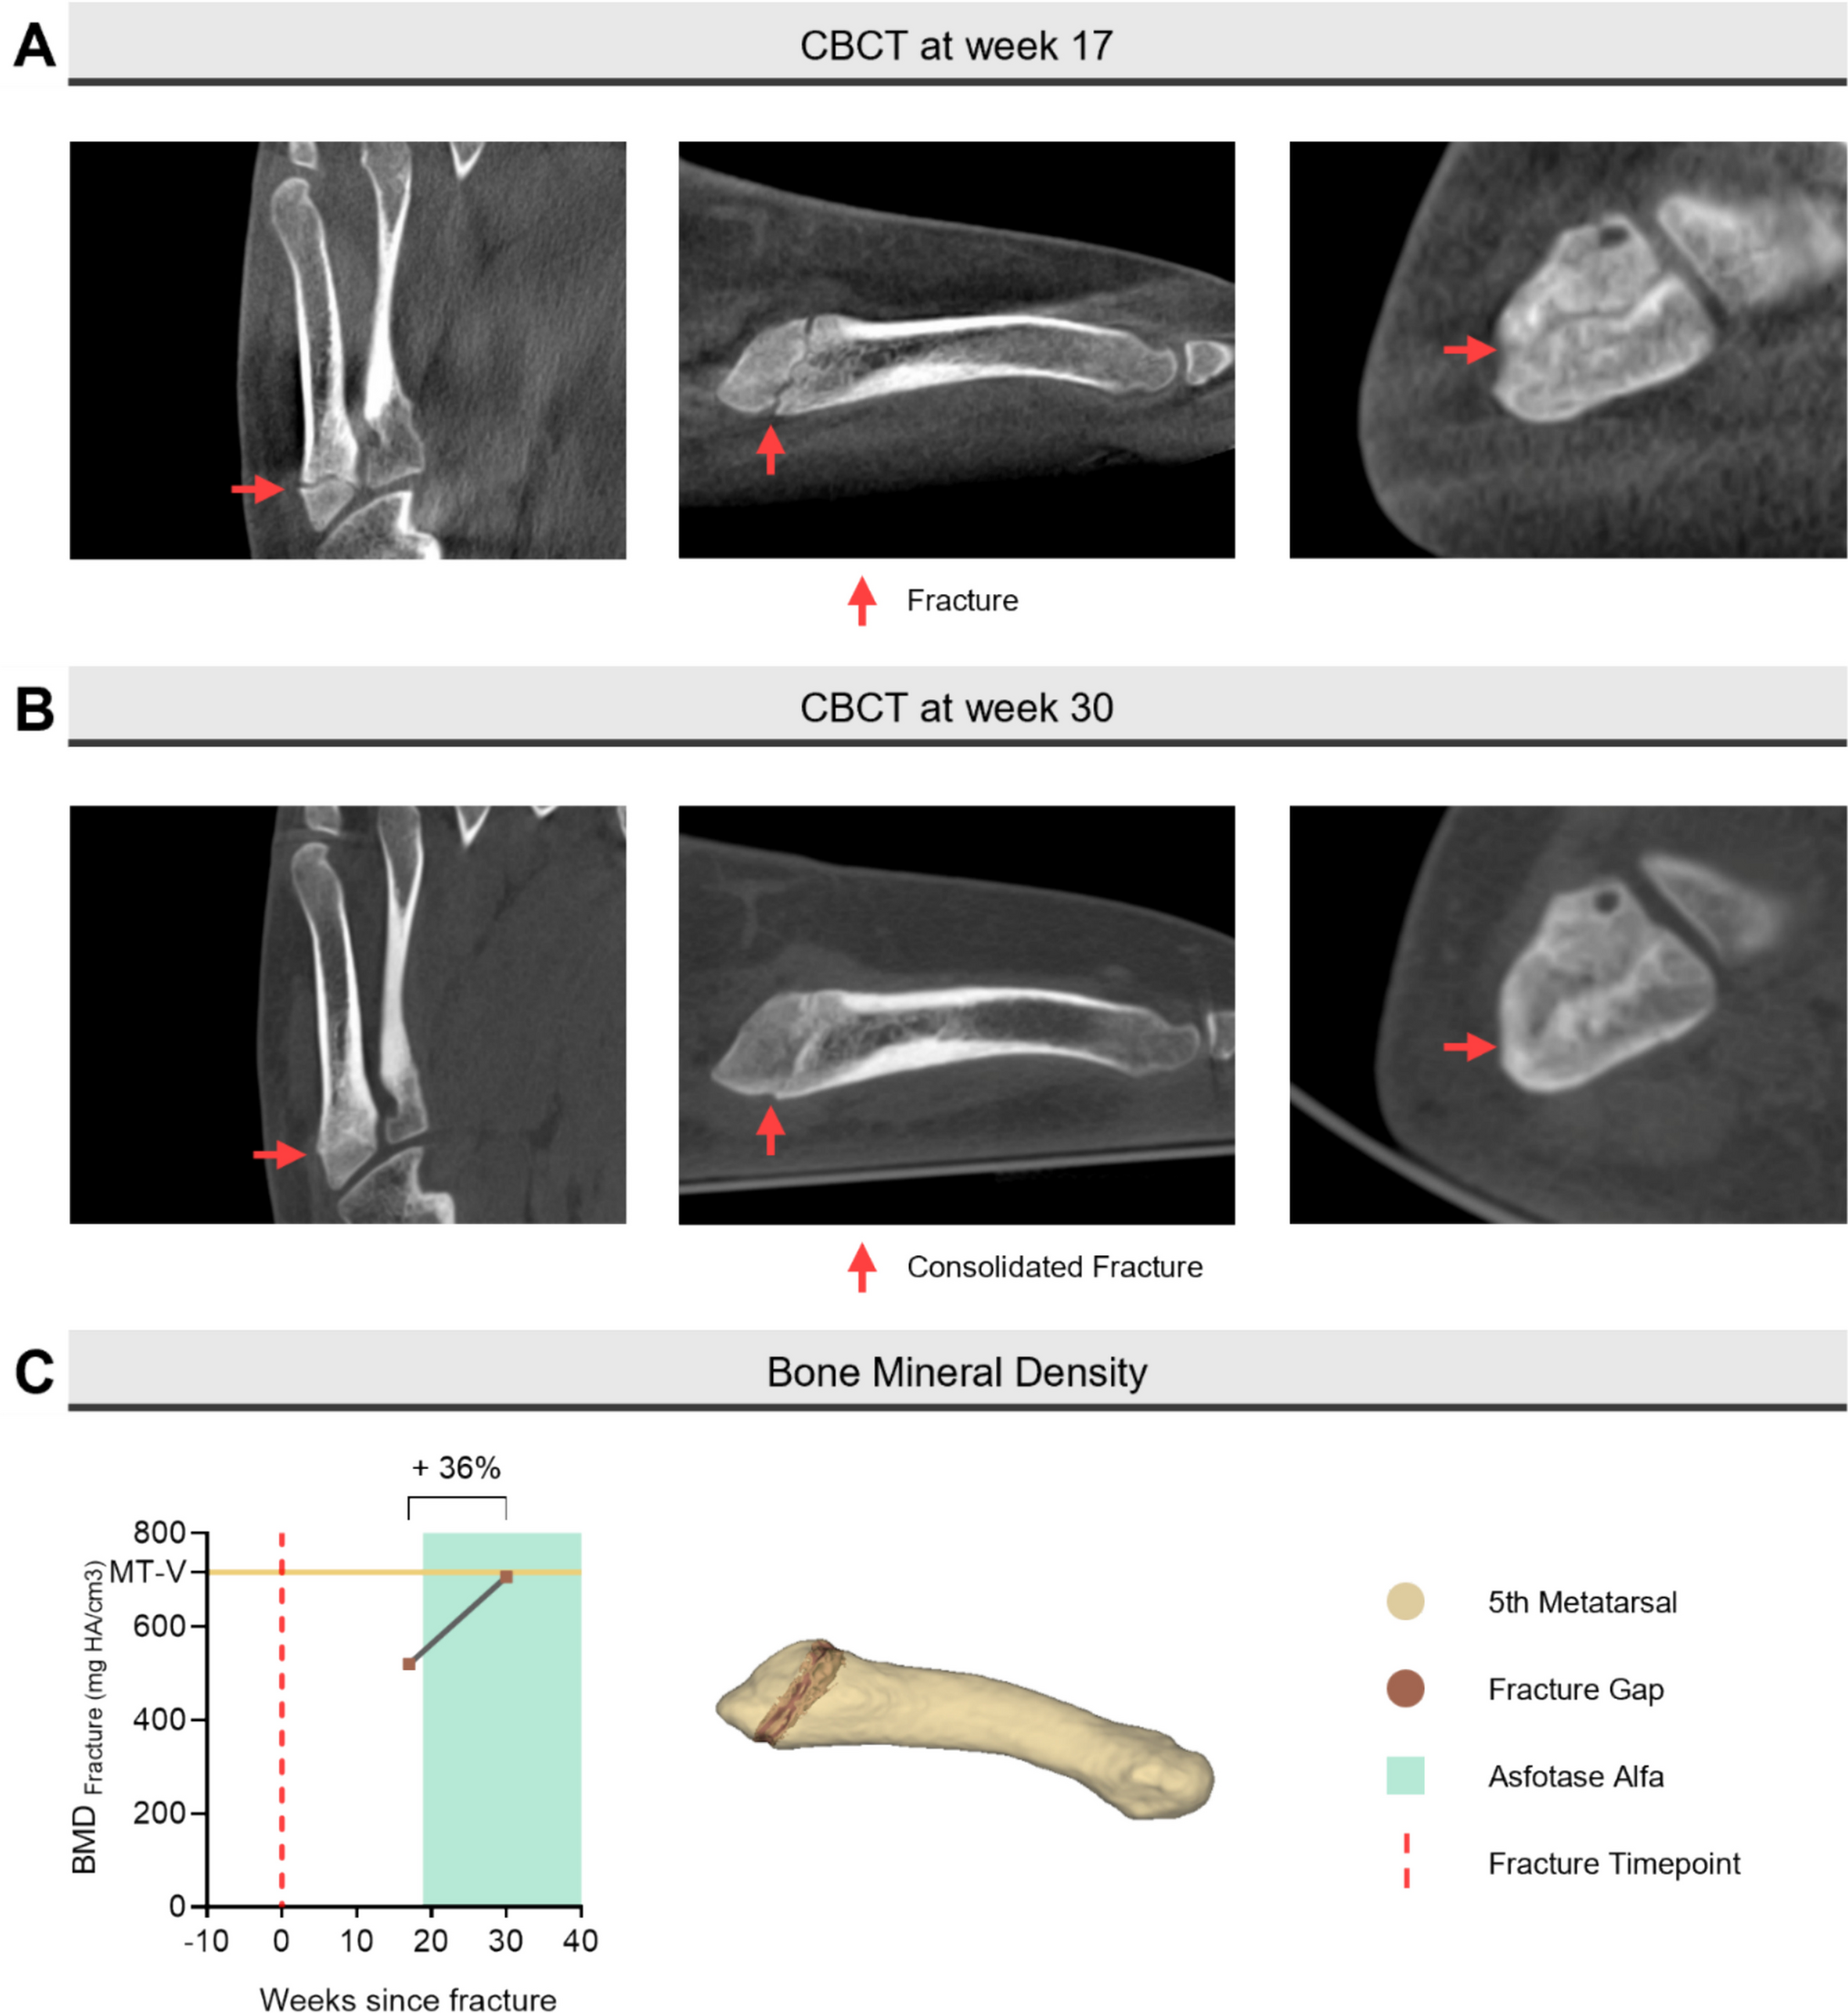
Bone density was profiled based on DXA imaging and included measurements of the mineral content in different parts of a variety of skeletal components. DXA was performed with a GE Lunar Prodigy Advance device (GE Healthcare) and the GE CoreScan software application. Before the scan, participants were asked to remove all metal items, heavy clothing, and shoes. Each participant underwent a total-body scan in a supine position. This study considered both bone mineral density (BMD) and bone mineral content (BMD) of the entire body and separately for the head, arms, legs, trunk, ribs, pelvis, femur (as a whole and the shaft, neck, and trochanter), and spine (as a whole and segments L1 to L4). DXA imaging of the total hip and lumbar spine was also derived from the total body scan.
Statistical analysis
In the descriptive analysis, group differences were evaluated with respect to a critical sleep duration threshold of 6 hours. Continuous variables were expressed as medians with interquartile ranges and compared using the non-parametric two-sided Mann–Whitney U test. Categorical variables were summarized as absolute frequencies and percentages and analyzed using the \(^\) test.
Multivariable linear regression models were used to estimate the associations between sleeping parameters and different bone measurements. Based on a literature review [19,20,21,22], all models were adjusted for age (years), BMI (kg/m2) and physical activity (minutes daily) in continuous form as well as for sex (men, women), smoking past frequency (never, tried once or twice, occasionally, on most or all days), current alcohol intake (never, special occasions only, one to three times a month, once or twice a week, three or four times a week, daily or almost daily), vegetarian diet (yes, no), and household income (divided into 6 categories) as categorical variables.
For each model, the linearity assumption between each continuous variable and the respective outcome was tested and, if violated, addressed using B-splines with 3 degrees of freedom. The normality assumption of residuals was assessed visually based on their distribution using model-specific histograms and Q-Q plots. Outliers were identified using the same diagnostics, with consideration of Cook’s D, and removed if necessary. Autocorrelation and multicollinearity were ruled out by the study design and the careful selection of measured confounding factors, respectively. Since there is evidence that bone content varies throughout life, all exposure-outcome associations were assessed for interactions with age [23, 24].
To minimize the number of false positives due to multiple testing with respect to the 192 regression models, the type I error was adjusted using the Bonferroni correction and therefore amounted to \(\alpha =2.6\cdot ^\). All statistical analyses were performed with Python (version 3.10.18). Figures were prepared using R (version 4.5.1).


Comments (0)