
Remember me
Many skills necessary to perform activities of daily living require individuals to think and move at the same time; otherwise known as cognitive-motor integration (CMI). An upper extremity CMI task has shown how CMI performance changes with age, neurotrauma, and sport experience; however, the majority of movements required for activities of daily living extend beyond the upper extremity. Therefore, the purpose of this pilot study was to compare a full-body balance-related CMI task with the validated upper extremity task. Twenty-nine young healthy adults [24.3 ± 5.1 years (SD); 12 females] completed 2 CMI tasks to assess upper extremity CMI and full-body CMI. In general, both CMI tasks varied in difficulty, ranging from congruent interactions with targets, to incongruent interactions which included visual feedback reversal (requiring increased CMI). Performance in both tasks were quantified using reaction time (RT), movement time (MT), and normalized path length (nPL). An interaction effect of task and condition was found for MT [F(1,28) = 9.344, p = 0.005] and nPL [F(1,28) = 12.766, p = 0.001], with larger increases across conditions in the full-body task compared to the upper extremity task. For the upper extremity task, sex predicted RT, where males had quicker RTs than females (unstandardized B = –78.968, p = 0.038). For the full-body task, MT and nPL were predicted by age and sport experience, respectively; where younger age resulted in faster MTs (unstandardized B = 235.546, p = 0.009), and more sport experience led to less variable nPLs (unstandardized B = –3.802, p = 0.005). Lastly, the full-body task found that sport experience was moderated by sex (unstandardized B = 203.650, p = 0.014), where only females saw decreases in MT with increasing sport experience. The full-body CMI task provides a more comprehensive analysis of sensory, motor, and cognitive contributions to coordination tasks. An isolated upper extremity task may be limited in its ability to extract meaningful information that could contribute to difficulties in performing activities of daily living. Future work could utilize this task in clinical populations with the potential to uncover differences that might not be apparent in standard assessment protocols.
1 IntroductionMany skills that are necessary to perform activities of daily living require individuals to think and move at the same time; otherwise known as cognitive-motor integration (CMI). Previous work has shown that deficits are not always apparent when performing motor or cognitive tasks separately (Huang and Mercer, 2001). Thus, an upper extremity CMI assessment task has been developed and validated to demonstrate how CMI performance changes with age, neurotrauma, and sport experience. Prior research has shown that CMI performance is worse in older individuals compared to younger individuals (Echlin et al., 2020). In addition, when comparing those with concussion to controls, CMI performance is poorer when assessing timing and accuracy measures (Sergio et al., 2020). Subsequent work has further demonstrated that individuals with concussion history and higher sport experience outperform those with concussion history and less sport experience (Dalecki et al., 2019). It has therefore been suggested that sport experience might provide brain network resilience that can compensate for concussion-related declines in CMI performance. Additionally, previous eye-hand coordination tasks have reported sex-related differences. In difficult conditions, when an individual is forced to prioritize speed or accuracy to complete the task, movement biases emerge, whereby males favor speed and females favor accuracy (Rohr, 2006). Finally, CMI performance has also been shown to differ between males and females, where males were less accurate when performing the task (Rogojin et al., 2019).
While upper extremity CMI tasks demonstrate changes associated with age, concussion, and sport experience, the majority of movements required to perform daily activities extend beyond the upper extremity. For example, to retrieve an item from a grocery shelf, you must be able to reach and grasp, as well as maintain your balance. In order to accurately perform this goal-directed movement, the motor system must be provided with sufficient sensory information. While an isolated upper extremity task relies heavily on input from the visual and proprioceptive systems (Sabes, 2011), a full-body task involves whole-body movements which have vestibular input playing a more prominent role. The vestibular system consists of a sensory organ in your inner ear that detects linear and angular acceleration to help maintain balance. It works in conjunction with the visual and proprioception systems to provide essential information about head and body position, as well as self-motion (Valko et al., 2012). Therefore, incorporating the CMI paradigm into a task that involves whole-body movements has the potential to reveal deficits not always detected through other assessments.
Research assessing how cognitive tasks influence balance has shown that the typical dual-task approach has its limitations. Dual-task paradigms often assess an individual’s balance when they are asked to perform a secondary cognitive task (Saberi et al., 2024). However, this may lead to task prioritization, where either the balance task or cognitive task is prioritized. The CMI approach used in this study requires the cognitive component to be integrated with the motor component, eliminating the ability for individuals to prioritize one task over the other. The addition of a full-body CMI assessment would provide a more comprehensive analysis while remaining an ecologically valid tool to assess CMI. Therefore, the purpose of this pilot study is two-fold; firstly, it will examine how movements requiring CMI impact performance, secondly, it will compare the full-body CMI balance task with the validated upper extremity task. It was hypothesized that there will be worse performance (slower reaction times, longer movement times, and more variable paths) in the conditions requiring increased CMI, as well as decreased performance in the full-body task compared to the upper extremity task, independent of condition. Furthermore, it was suggested that younger individuals, males, and those with more sport experience would outperform their counterparts.
2 Materials and methods2.1 ParticipantsTwenty-nine young healthy adults [24.3 ± 5.1 years (SD); 12 females] were recruited to participate in the study (Table 1). Inclusion criteria consisted of individuals between the ages of 18–40 years old. Exclusion criteria included any self-reported neurological or orthopedic impairments which could affect their ability to perform the tasks. Study protocol was approved in accordance with York University’s Ethics Review Board and participants provided informed consent prior to participating in the study.
VariablesNMean (SD)Age (years)24.3 (5.1)Sex Female12 Male17Height (inches)67.9 (3.5)Weight (lbs)158.1 (28.4)Ethnicity White12 South Asian3 East Asian2 Southeast Asian1 Middle Eastern3 West Indian2 Latin American1 Multiracial4 Not reported1Concussion history Yes7 No22Sport experience (years)15.6 (8.4) Soccer10 Basketball8 Volleyball8 Tennis/pickleball6 Hockey6 Swimming5 Combat sports5 Running/cycling4 Other (n < 4 per group)24Highest level of education High school degree12 Bachelor’s degree7 Master’s degree10Occupation Student27 Full-time employee2Summary of participant demographics (n = 29).
2.2 Procedure2.2.1 QuestionnaireDemographic information was collected on participants’ age, sex, sport experience, years of education, occupation, and touchscreen/video game use. Furthermore, health-related questionnaires were used to collect information on concussion history, medication use, and family history of neurological disorders.
2.2.2 Behavioral tasksTwo CMI assessment tasks were implemented in this study. A laptop and touchscreen were used to assess upper extremity CMI, and a television monitor and 3D motion capture were used to assess full-body CMI. In both tasks, the goal was to move the cursor from a central target to one of four peripheral targets (up, down, left, and right) as quickly and accurately as possible. In general, both CMI tasks varied in difficulty, ranging from congruent interactions with targets, to incongruent interactions which included visual feedback reversal (requiring increased CMI). The two CMI tasks were counterbalanced across participants with adequate rest periods provided to prevent fatigue. Within each task, conditions were presented in a randomized order and each condition consisted of 20 trials total, with 5 pseudo-randomly presented trials to each of the 4 peripheral targets. Practice trials (one to each target) for each condition were included in order to ensure task comprehension. The order of events for each trial were as follows: (1) A central target was presented on screen, (2) participants moved the cursor to the central target, which would turn green when the cursor was on target, (3) once 4,000 ms had elapsed with the cursor on target, one of the four peripheral targets appeared and the central target disappeared, (4) participants were instructed to move the cursor toward the peripheral target, (5) once the cursor was on the peripheral target and 500 ms had elapsed, the target would disappear and the trial ended, and (6) An inter-trial interval of 2,000 ms would occur before the central target would reappear (Figure 1).

Experimental setup for (A) upper extremity task and (B) full-body task. (C) Order of events for each trial in the full-body CMI task (similar protocol used in the upper extremity CMI task): Participants moved the cursor to the central target, which would turn green when the cursor was on target, one of the four peripheral targets appeared and the central target disappeared, participants moved the cursor onto the peripheral target, the target would disappear and the trial ended.
2.2.2.1 Upper extremity CMI taskIn the upper extremity CMI task, the participant would interact with an external touchscreen oriented orthogonal to the laptop screen. This task consisted of two conditions: (1) Standard, with finger movements in the same direction as visual information and (2) Feedback reversal, where the visual feedback was rotated 180° and finger movements were in the opposite direction of visual information, requiring increasing CMI (Figure 1). The peripheral targets were 15 mm in diameter and were placed 55 mm from the central target.
2.2.2.2 Full-body CMI taskIn the full-body CMI task, participants stood on a force plate facing a television monitor (1.10 × 0.62 m) located at eye level, approximately 1.27 m away. A 3-dimensional motion capture tracker (Vive Tracker, HTC Corp., Taiwan) was attached to the trunk of the participant and was used to update the position of the cursor on the monitor (Figure 1). While controlling the cursor, the participants were instructed to stand with their feet in place (foot width standardized to foot length) and to lean at the ankle joint, without bending at the knees or hip. This task consisted of two conditions: (1) Standard, where a forward lean corresponded to the cursor moving up on the screen, a backward lean would drive the cursor downward, and a leftward and rightward lean would move the cursor to the left and right, respectively; and (2) Feedback reversal, where the visual feedback was rotated 180° (ex. forward lean would move the cursor downwards), requiring increasing CMI.
The peripheral targets were 20 × 20 mm, and target locations were individualized for each participant. Calibration trials were utilized to find the participants’ maximum displacement in each of the four directions (forward, backward, leftward, and rightward) and the targets were placed at 80% of these values. This individualized approach ensured that task difficulty was consistent across participants.
2.3 MeasurementsGround reaction forces and moments were recorded from the force plate (AMTI, United States) at 100 Hz (Power 1401, Spike2, CED, United Kingdom) and used to calculate anterior-posterior and mediolateral center of pressure displacements. Kinematic measures of the cursor’s x and y coordinates were collected for both tasks. Cursor position was sampled at 50 Hz (upper extremity task) and 100 Hz (full-body task), and low pass filtered with a 10 Hz (upper extremity task) and 5 Hz (full-body task) dual-pass Butterworth filter. For each trial, movement onset was calculated as the first timepoint that the cursor (upper extremity task) or center of pressure (full-body task) trajectory exceeded 10% peak velocity and ballistic movement offset (upper extremity task) was the timepoint at which the trajectory went below 10% peak velocity. Total movement offsets occurred when the cursor entered the target for the final time (full-body task) or the final cross of 10% peak velocity once the cursor was within the target boundaries (upper extremity task).
2.4 Outcome measuresPerformance in both tasks were quantified by calculating reaction time (RT), movement time (MT), and normalized path length (nPL) for each trial. RT was the time interval between trial onset (appearance of a peripheral target) and movement onset (when movement crossed 10% of peak velocity). MT was the time interval between movement onset and the end of the movement (when the cursor entered the peripheral target for at least 500 ms). nPL was the percentage of distance covered between movement onset and the end of the movement, relative to a straight line between starting and endpoints.
2.5 Statistical analysis2 × 2 repeated-measures analysis of variance (ANOVAs) were conducted to examine the effect of task (upper extremity vs. full-body) and condition (standard vs. feedback reversal) for RT, MT, and nPL. Multiple linear regressions were performed to determine the association between exposure variables (age and sport experience) and outcome variables (RT, MT, and nPL) for the upper extremity and full-body tasks, and whether the relationship is moderated by sex or concussion history. Any models that included a significant moderator variable were then assessed using a simple slopes analysis. All statistical tests were performed using SPSS (IBM Corp., N.Y., United States).
Shapiro-Wilks tests were used to assess normality. While data transformations (log, square-root, and reciprocal) were applied, the assumption of normality was not completely satisfied. Given that repeated-measures approach ANOVAs are generally robust to violations of normality, the analyses were conducted using the untransformed data (Field, 2009).
Outliers were identified as (absolute) z-scores > 3, and values were replaced to 2 standard deviations from the mean (Field, 2009). The full-body task had a range of 1–3 outliers across conditions for RT, MT, and nPL, while the upper extremity task had a range of 2–3 outliers across conditions for RT, MT, and nPL. Significance levels were set at p = 0.05 and effect sizes were reported using partial eta squared for ANOVAs and Cohen’s d for pairwise comparisons.
3 Results3.1 Target distances for the full-body taskTargets were placed on the monitor at a distance which corresponded to a lean of mean ± standard deviation for the forward target (142.92 ± 29.50 mm), backward target (80.40 ± 22.51 mm), leftward target (110.05 ± 20.89 mm), and rightward target (116.79 ± 26.22 mm) in the standard condition.
3.2 Univariate analysesANOVAs revealed an interaction effect of task and condition on MT [F(1,28) = 9.344, p = 0.005, η2 = 0.250] and nPL [F(1,28) = 12.766, p = 0.001, η2 = 0.313]. Post hoc analyses revealed changes across conditions for both the full-body (mean difference [MD] = –658.22, standard error [SE] = 156.82, Cohen’s d = –0.78) and upper extremity (MD = –189.63, SE = 28.29, Cohen’s d = –1.25) tasks. There were larger increases in MT and nPL across conditions in the full-body task: mean ± standard deviation (MT difference between standard and feedback reversal condition: 658.2 ± 353.1 ms; nPL difference: 20.6 ± 17.7%) when compared to the upper extremity task (MT: 189.6 ± 81.7 ms; nPL: 1.79 ± 1.7%). Furthermore, independent of task, all metrics showed better performance in the standard condition compared to the feedback reversal condition [RT: F(1,28) = 55.379, p < 0.001, η2 = 0.664; MT: F(1,28) = 26.347, p < 0.001, η2 = 0.485; nPL: F(1,28) = 17.910, p < 0.001, η2 = 0.390]. More specifically, the standard condition had faster RTs (373.8 ± 54.2 ms), shorter MTs (1299.5 ± 349.2 ms), and lower nPL (107.5 ± 5.9%) than the feedback reversal condition (RT: 450.8 ± 59.2 ms; MT: 1723.4 ± 566.6 ms; nPL: 118.7 ± 15.6%) (Figures 2, 3 and Table 2).
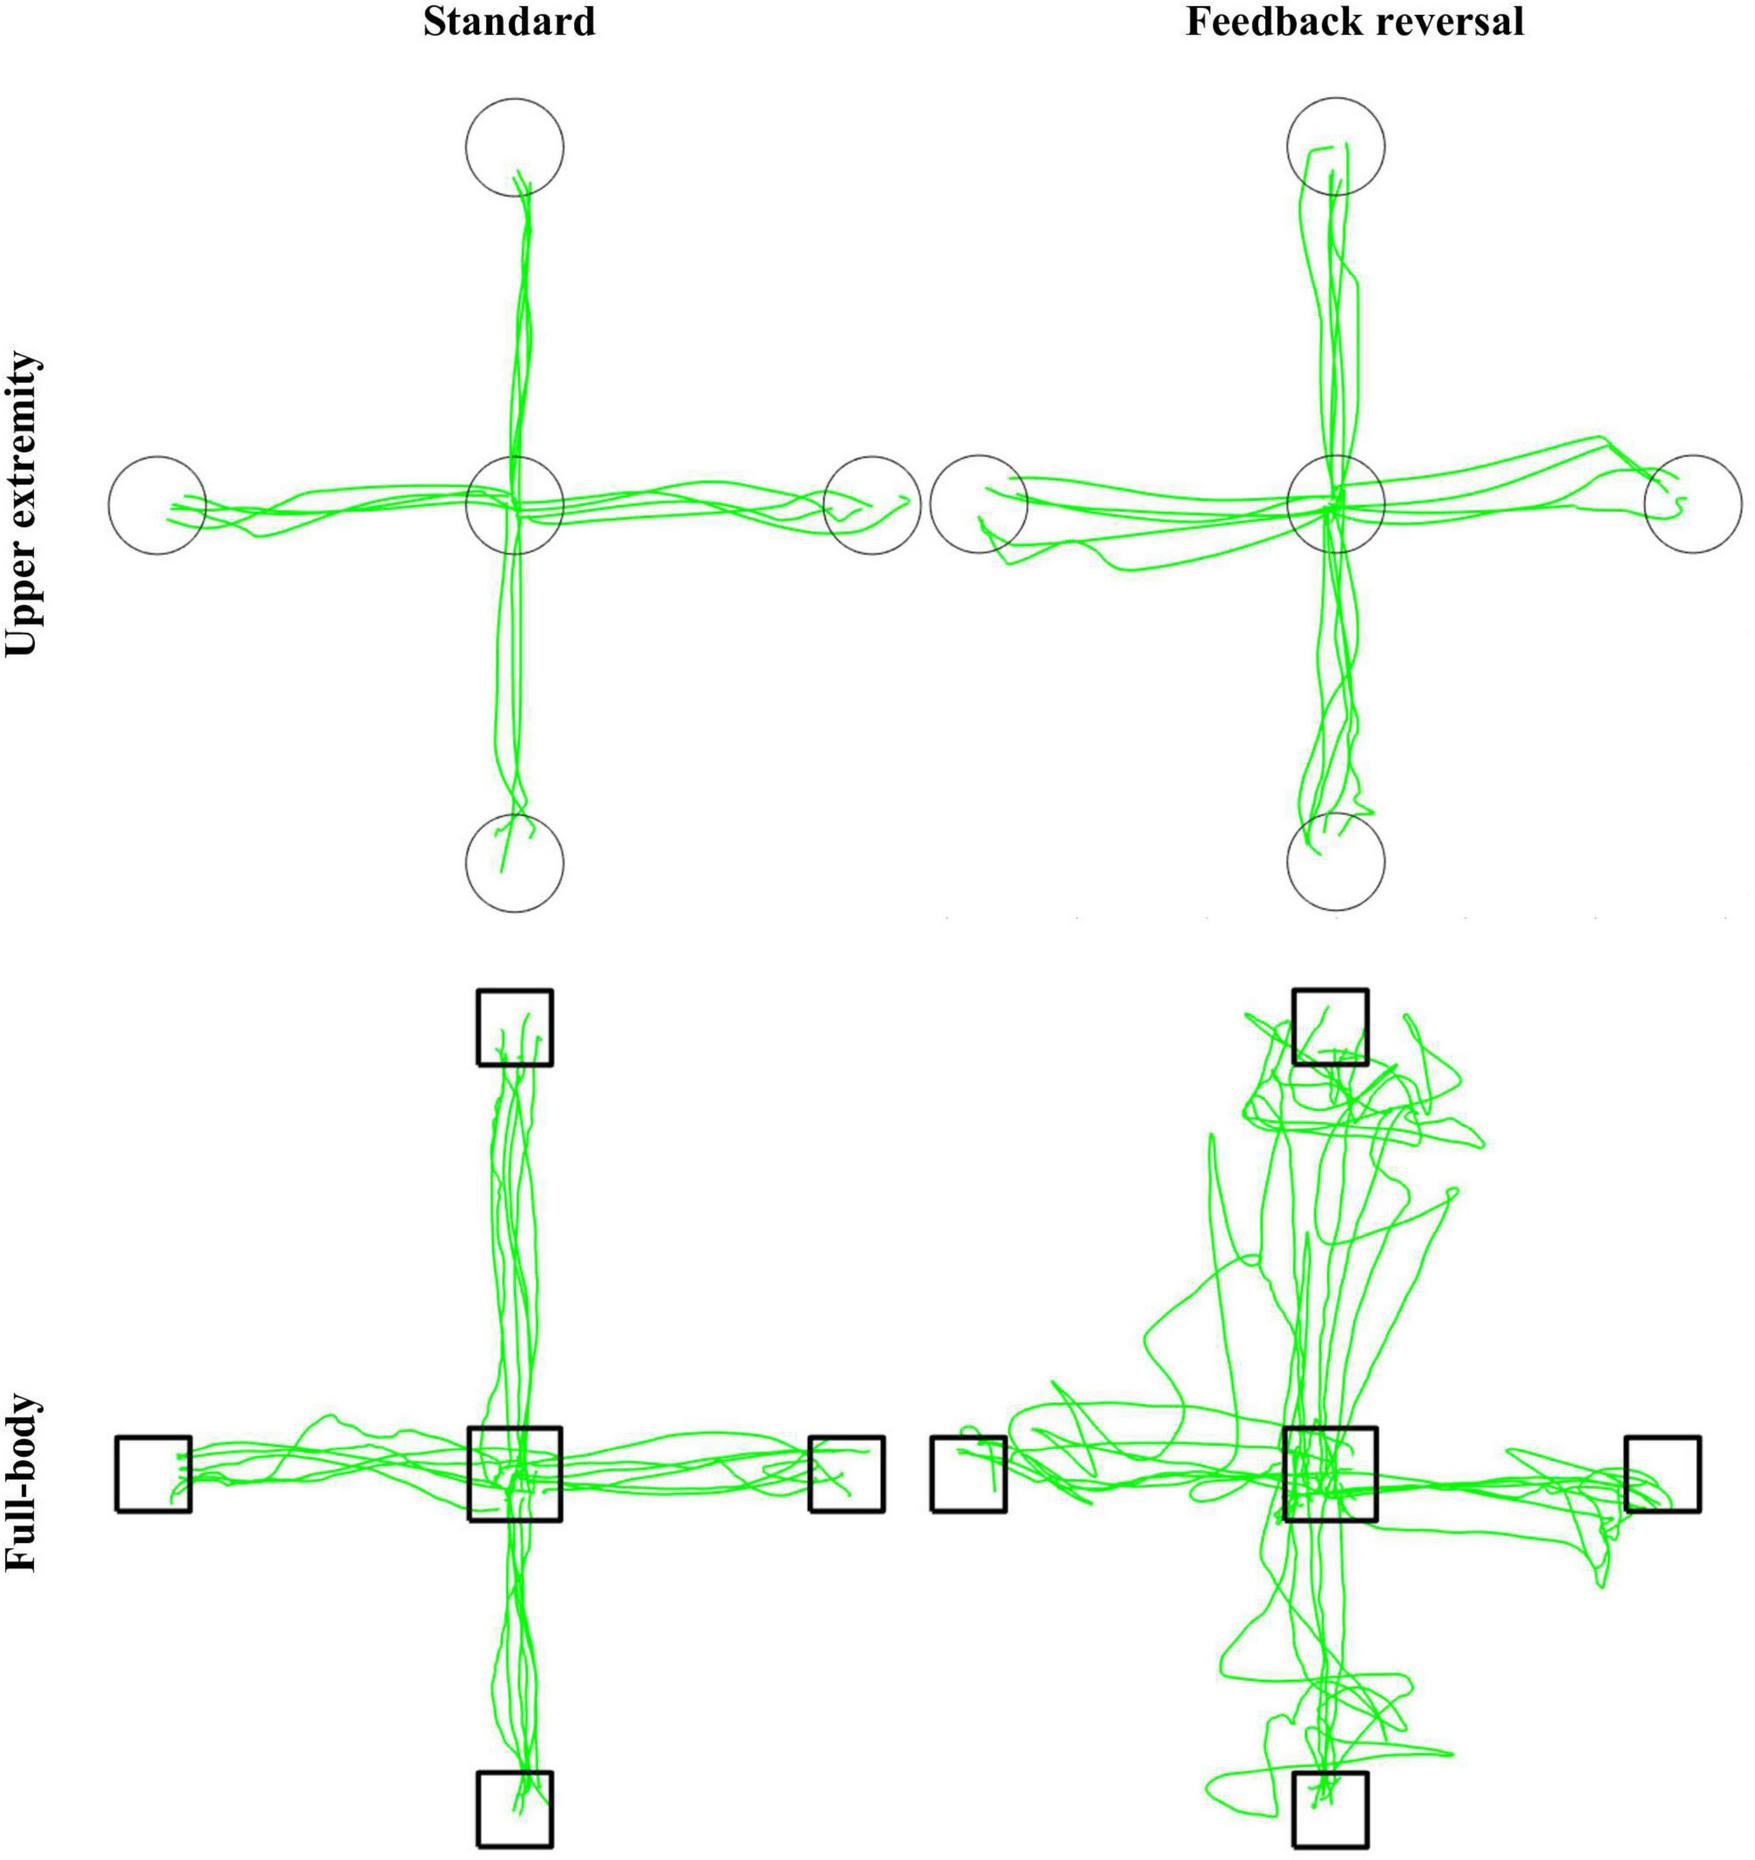
Representative participant for the CMI tasks. Green lines represent cursor trajectories, and circles and boxes represent targets for the upper extremity and full-body task, respectively. Trajectories are shown for all trials for each condition (standard and feedback reversal) within each task (upper extremity and full-body).
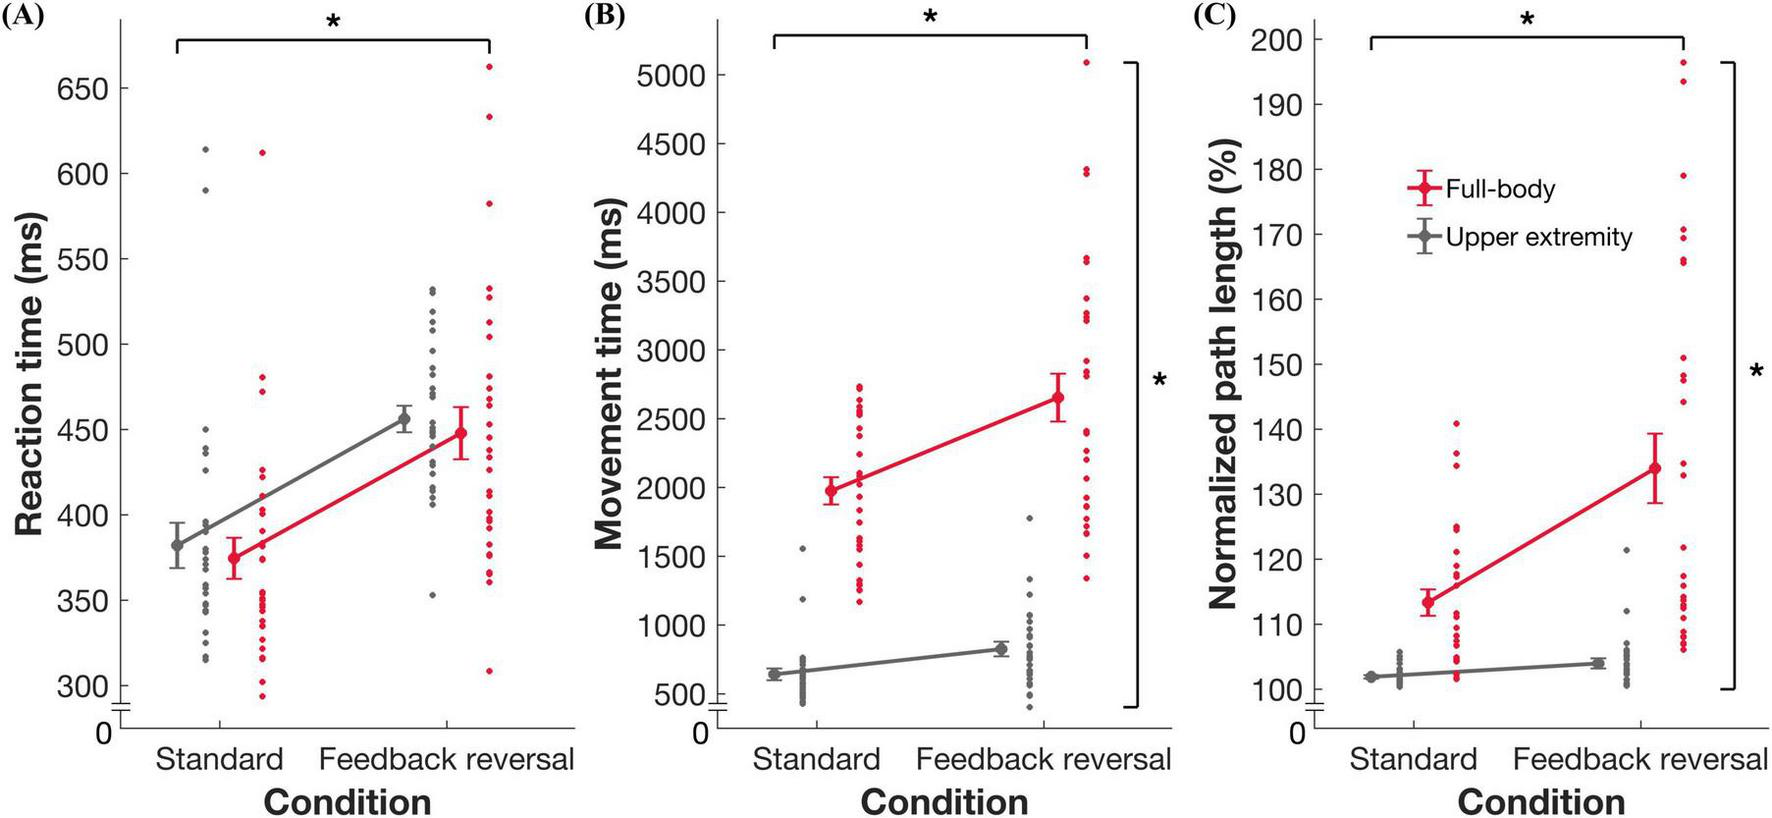
Summary data for task performance. Group mean ± standard error and individual datapoints for (A) reaction time, (B) movement time, and (C) normalized path length for the full-body (red) and upper extremity task (gray). * indicates significance at p < 0.05.
Outcome measureFull-bodyUpper extremityTask (T)Condition (C)T × CStandardFeedback reversalStandardFeedback reversalF(1,28)pη2F(1,28)pη2F(1,28)pη2RT370.82 ± 52.8445.42 ± 76.6376.77 ± 55.5456.14 ± 41.80.9650.3340.03355.379 < 0.0010.6640.0910.7650.003MT1975.75 ± 532.82633.97 ± 885.9623.16 ± 165.5812.79 ± 247.2217.930 < 0.0010.88626.347 < 0.0010.4859.3440.0050.250nPL113.14 ± 10.5133.74 ± 28.2101.87 ± 1.3103.66 ± 3.047.352 < 0.0010.62817.910 < 0.0010.39012.7660.0010.313Mean ± standard deviation for reaction time (RT), movement time (MT), and normalized path length (nPL).
ANOVA results for task and condition effects for RT, MT, and nPL. Bold values indicate significance at the p < 0.05 level.
3.3 Regression analysesMultiple linear regressions found significant associations between exposure variables (age and sport experience), moderating variable (sex) and performance. For the standard condition in the upper extremity task, sex predicted RT (Figure 4 and Table 3), where males had quicker RTs than females (unstandardized B = –78.968, p = 0.038). For the full-body task, nPL was predicted by sport experience in the feedback reversal condition (Figure 4 and Table 4), whereby more sport experience resulted in less variable nPLs (unstandardized B = –3.802, p = 0.005). The full-body task also found that age predicted MT in the feedback reversal condition (Figure 4 and Table 5), where older age resulted in longer MTs (unstandardized B = 235.546, p = 0.009). Lastly, the full-body task also found a sport experience by sex interaction for MT (unstandardized B = 203.650, p = 0.014) in the feedback reversal condition (Figure 4 and Table 5). A simple slopes analysis revealed that females showed decreases in MT with more sport experience (unstandardized B = –91.669, p = 0.014), while the relationship between males and sport experience was insignificant. There were no other significant associations.
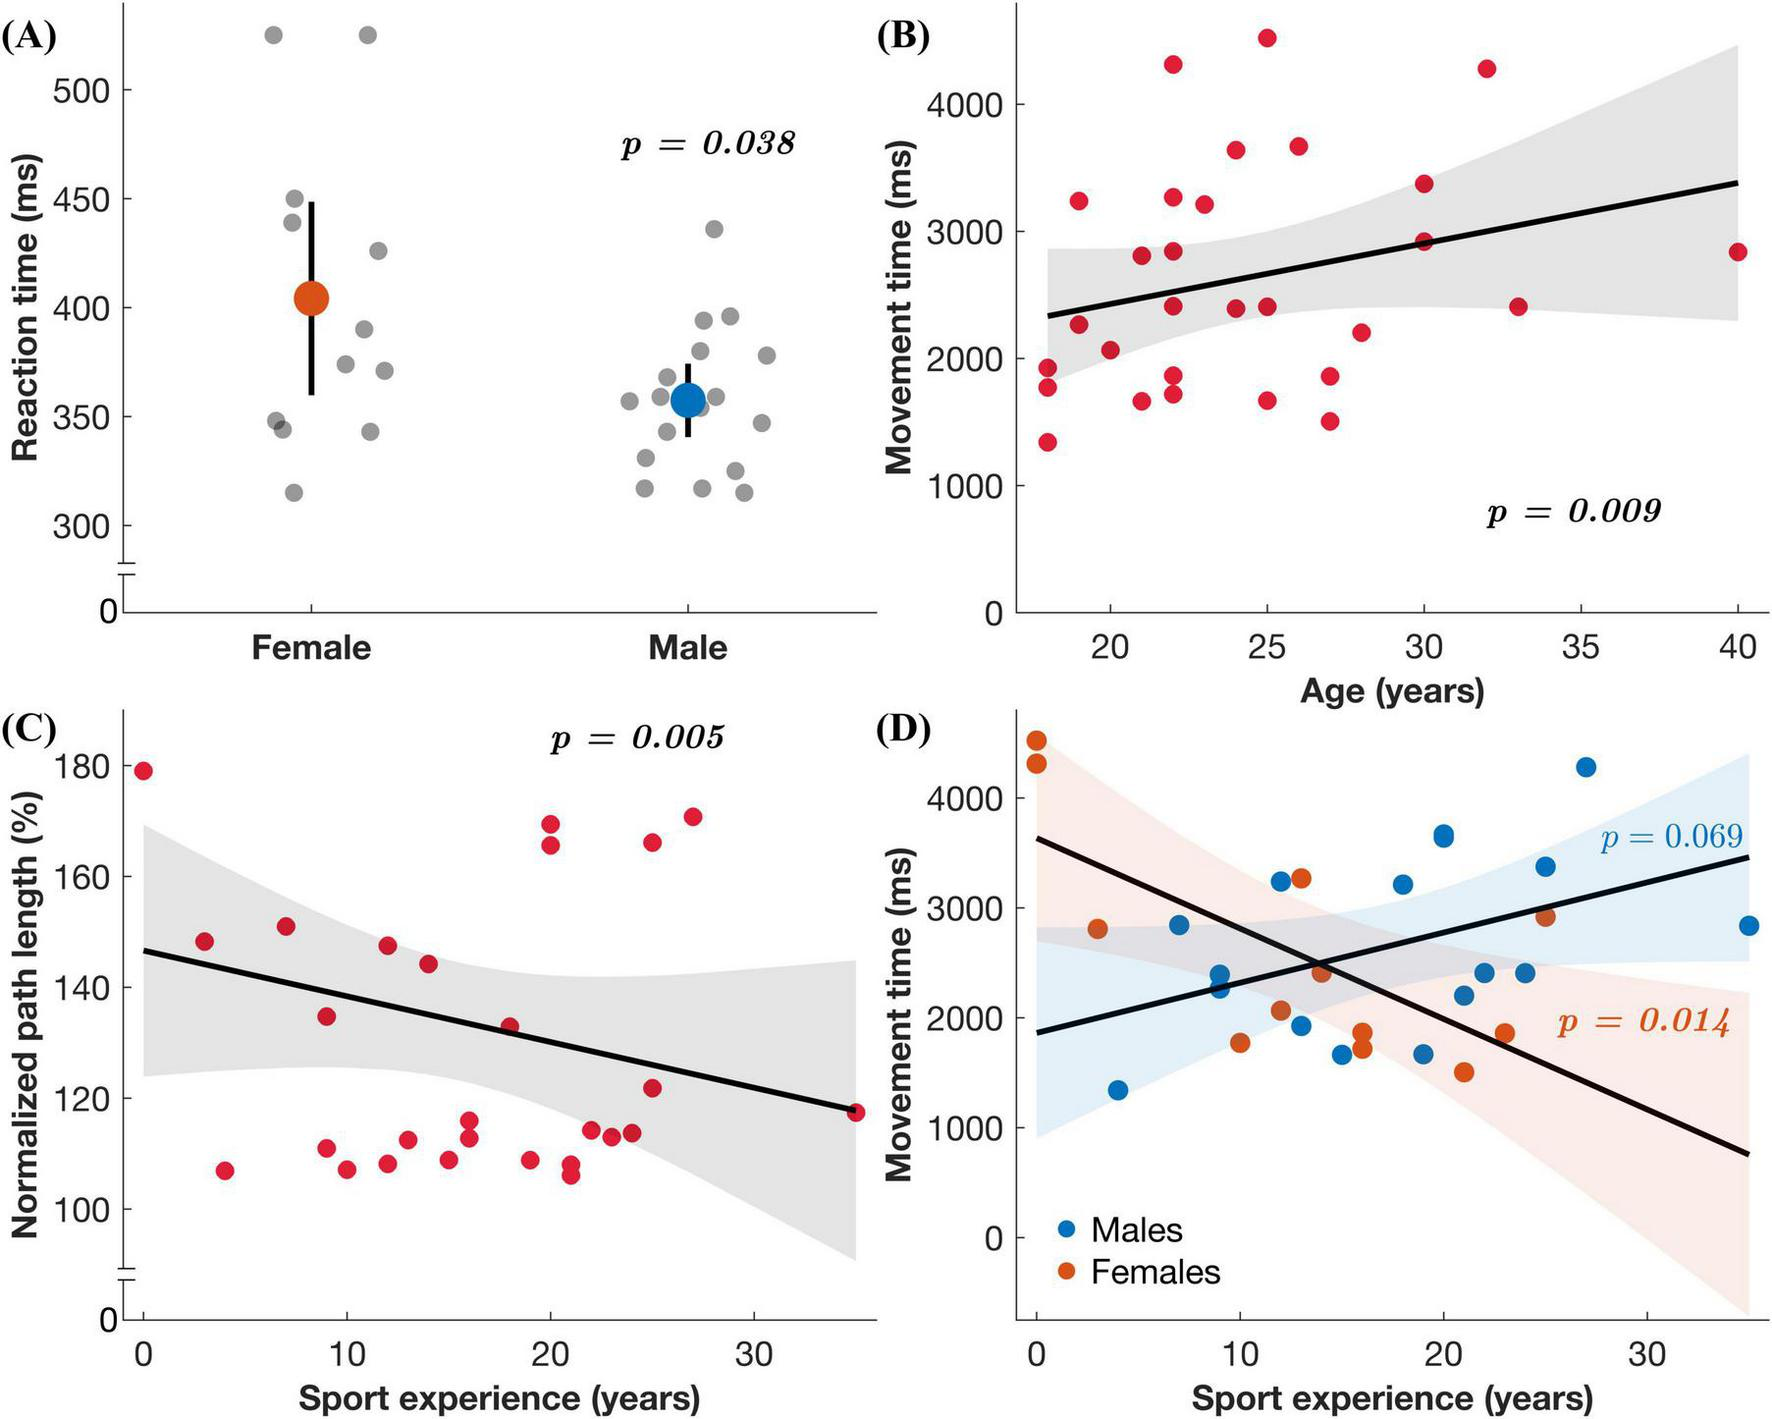
Regression results. (A) Reaction time in the upper extremity task under the standard condition as a function of sex. (B–D) Each plot includes the regression coefficient (line) and the 95% confidence interval for predicted values (shaded region) in the full-body task under the feedback reversal condition: (B) Movement time as a function of age, (C) normalized path length as a function of sport experience, and (D) movement time as a function of sex (males represented by blue datapoints and females by orange) and sport experience.
Reaction timeFull-bodyUpper extremityStandardRegression results for reaction time for the full-body and upper extremity tasks.
N = 29. In all models, predictor variables were age and sport experience, and moderator variables were sex and concussion history. B = unstandardized beta coefficient; β = standardized beta coefficient. Bold values indicate significance at the p < 0.05 level. ※ Reference category = females. Δ Reference category = no history of concussion.
Normalized path lengthFull-bodyUpper extremityStandard
Comments (0)