
Remember me

All procedures were approved by the Institutional Animal Care and Use Committee (Approval No: 20–2021). Twenty-eight adult male Wistar rats (250–300 g) were used. Animals were housed in identical cages at 23 °C with a 12-h light–dark cycle and had ad libitum access to standard chow and water. Experiments were performed under urethane anaesthesia (1200 mg/kg, administered intraperitoneally). At the end of the study, all rats were euthanised by cervical dislocation.
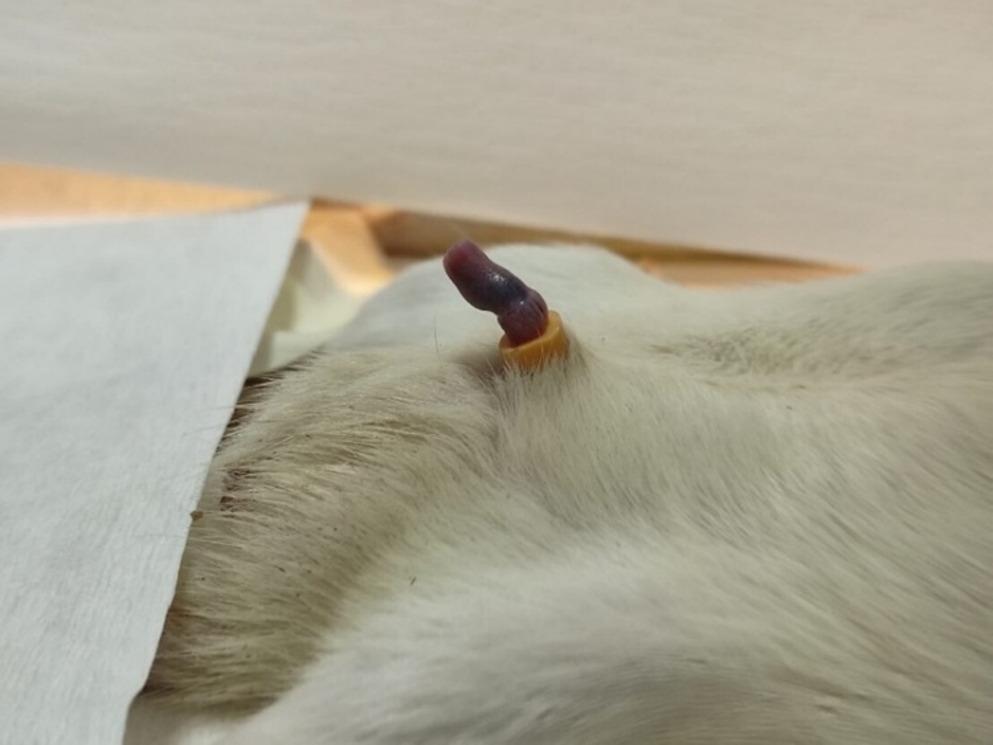
Experimental study designInduction of ischemic priapismIschemic priapism (IP) was induced using a negative-pressure vacuum method. After prepuce retraction, a 50-mL syringe with a cone-shaped tip was positioned at the penile base, and negative pressure was applied by slowly pulling back the plunger until an erection occurred (10 ± 1 s) (Fig. 1). A 2-mm–long segment cut from a 16G Foley catheter was placed around the proximal penis to occlude venous return for 4 h [12]. This duration was selected based on previous reports indicating irreversible smooth muscle injury and acidosis after 4–6 h of ischemia [13].
Fig. 1
Induction of erection and priapism model
Experimental groupsAnimals were randomly assigned to the experimental groups at the time of group allocation. Four experimental groups were formed, with seven animals in each group. Control: anaesthesia only (no intervention). IP: 4 h of induced priapism. IP-R: 4 h of ischemia followed by 1 h of reperfusion. IP-[NaHS]-R: 4 h of ischemia followed by 1 h of reperfusion, with NaHS (75 µmol/kg, intraperitoneally) [14] administered 10 min before reperfusion (Fig. 2). The required amount of NaHS was individually calculated according to each animal’s body weight and dissolved in physiological saline to a final injection volume of 5 mL/kg prior to intraperitoneal administration [15].
Fig. 2
At the end of the experimental protocol, penile tissues from the experimental groups were excised and divided into proximal and distal segments. Samples from both regions were collected for H₂S measurement, histopathological evaluation, and HIF-1 analysis. Samples for H₂S assays were stored at − 80 °C, while tissues for histopathological and immunohistochemical analyses were fixed in 10% neutral-buffered formalin.
Tissue homogenization and measurement of endogenous H₂S productionPenile cavernous tissues (40–50 mg) from 7 animals per groups homogenised in 0.1 mM potassium phosphate buffer (PPB, pH 7.4) containing protease and phosphatase inhibitors using a cryogenic homogeniser under liquid nitrogen. Protein concentrations in the homogenates were determined using the bicinchoninic acid (BCA) method.
Endogenous H₂S production was quantified using the methylene blue assay (MBA) as previously described [16, 17]. Tissue homogenates (50 µg protein) were incubated in sealed tubes at 37 °C for 30 min with L-cysteine (10 mM) and pyridoxal phosphate (2 mM) to stimulate H₂S synthesis. Basal samples were incubated without L-cysteine. Standard curves were prepared using NaHS dilutions (250–3.9 µM).
After incubation, 10% trichloroacetic acid was added to stop the reaction, followed by 1% zinc acetate to trap H₂S as zinc sulfide. Subsequently, N,N-dimethyl-p-phenylenediamine sulfate (20 mM) and FeCl₃ (30 mM) were added to generate methylene blue. After 15 min in the dark, 200 µL aliquots were transferred to a microplate, and absorbance was measured at 650 nm using a spectrophotometer. Each group was measured in triplicate. H₂S production was calculated from the standard curve and expressed as nmol H₂S produced per minute per mg of protein (nmol·min⁻¹·mg⁻¹ protein).
Histopathological examinationPenile tissues were fixed in 10% formalin solution. After routine tissue processing, the sample was embedded in parafine and 5 μm sections were taken (RM 2255, Leica.). Slides were stained with hematoxylin–eosin (H&E) to evaluate general morphology and with Masson’s trichrome to assess collagen deposition. Tissues were examined by light microscopy (Euromax, Iscope, Holland) and evaluated by two histologist who was blinded to the experimental design.
Histological evaluation was performed under a light microscope and at 40× magnification. The presence of vasocongestion, inflammation, desquamation, and edema was scored between 0 and 3 points as follows: 0: normal, 1: mild, 2: moderate, 3: severe [18]. Vasocongestion, inflammation, and edema were assessed within the corpus cavernosum stroma, including the cavernous sinusoids and trabecular structures, as well as in the tunica albuginea and corpus spongiosum, whereas desquamation was evaluated exclusively in the urethral epithelium. Vasocongestion was defined as dilation of cavernous sinusoids accompanied by intravascular erythrocyte accumulation and blood pooling. Inflammation was identified based on the presence and extent of inflammatory cell infiltration within interstitial and perivascular areas. Desquamation was assessed as detachment or loss of epithelial cells, and edema was evaluated according to the degree of interstitial space expansion and tissue loosening.
Masson’s trichrome (MT) staining were graded on a scale of (+) to (++++) according to the percentage of collagen in the penile corpus cavernosum in each group: as follows: +, 30% or less collagen; ++, 30–50% collagen; +++, 50–70% collagen; and ++++, more than 70% collagen [19].
For histological evaluation, (H&E) and MT sections were analyzed by selecting five randomly chosen, non-overlapping fields per animal, and scoring was performed for each field. The mean score of these fields was calculated to obtain a representative value for each subject.
Immunohistochemical detection of HIF-1αParaffin sections were deparaffinized, rehydrated, and subjected to heat-induced epitope retrieval in 10% citrate buffer (pH 6.0) for 5 min. Endogenous peroxidase activity was blocked with 0.3% hydrogen peroxide for 10 min. Slides were incubated overnight at 4 °C with anti-HIF-1α primary antibody (BS-0737R, Bioss, USA) at a dilution of 1:100. After washing, sections were treated with a ready-to-use streptavidin–biotin secondary antibody complex (Invitrogen) for 30 min and visualised using diaminobenzidine (DAB) as the chromogen. Counterstaining was performed with Mayer’s hematoxylin, followed by dehydration and mounting. HIF-1α immunoreactivity was evaluated by light microscopy. Immunohistochemical evaluation was undertaken using the semi-quantitative H-score method. The intensity of positive cell staining (i value) was categorized as 0 (no staining), 1 (weak but detectable staining), 2 (moderate staining), and 3 (intense staining). Five randomly selected fields were scanned microscopically at 40x magnification, and the average of these scores was used for statistical analysis. The sum of their percentages was calculated according to the following formula; H-Score = ∑Pi(i + 1). According to the formula, i is the intensity of staining at values of 1, 2, or 3 (weak, moderate, or strong, respectively), and Pi is the percentage of stained cells for each intensity, ranging from 0% to 100% [20].
HIF-1α immunoreactivity was observed in both the urethral epithelium and corpus cavernosum in representative sections, semiquantitative scoring revealed comparable staining intensity and distribution in these regions across all groups; therefore, regional separation was not applied in the final evaluation [21].
Statistical analysisData were analysed using GraphPad Prism 8 (GraphPad Software, San Diego, USA). The Shapiro-Wilk test was used to evaluate whether continuous variables were normally distributed. Parameters with a normal distribution were compared using one-way ANOVA followed by Bonferroni’s post hoc test, while those not normally distributed were analysed using the Kruskal–Wallis test, pairwise comparisons performed using the Mann–Whitney U test. Values were expressed as mean ± SEM, and p < 0.05 was considered statistically significant. Group sample size (n) refers to the number of animals per condition.
Comments (0)