
Remember me
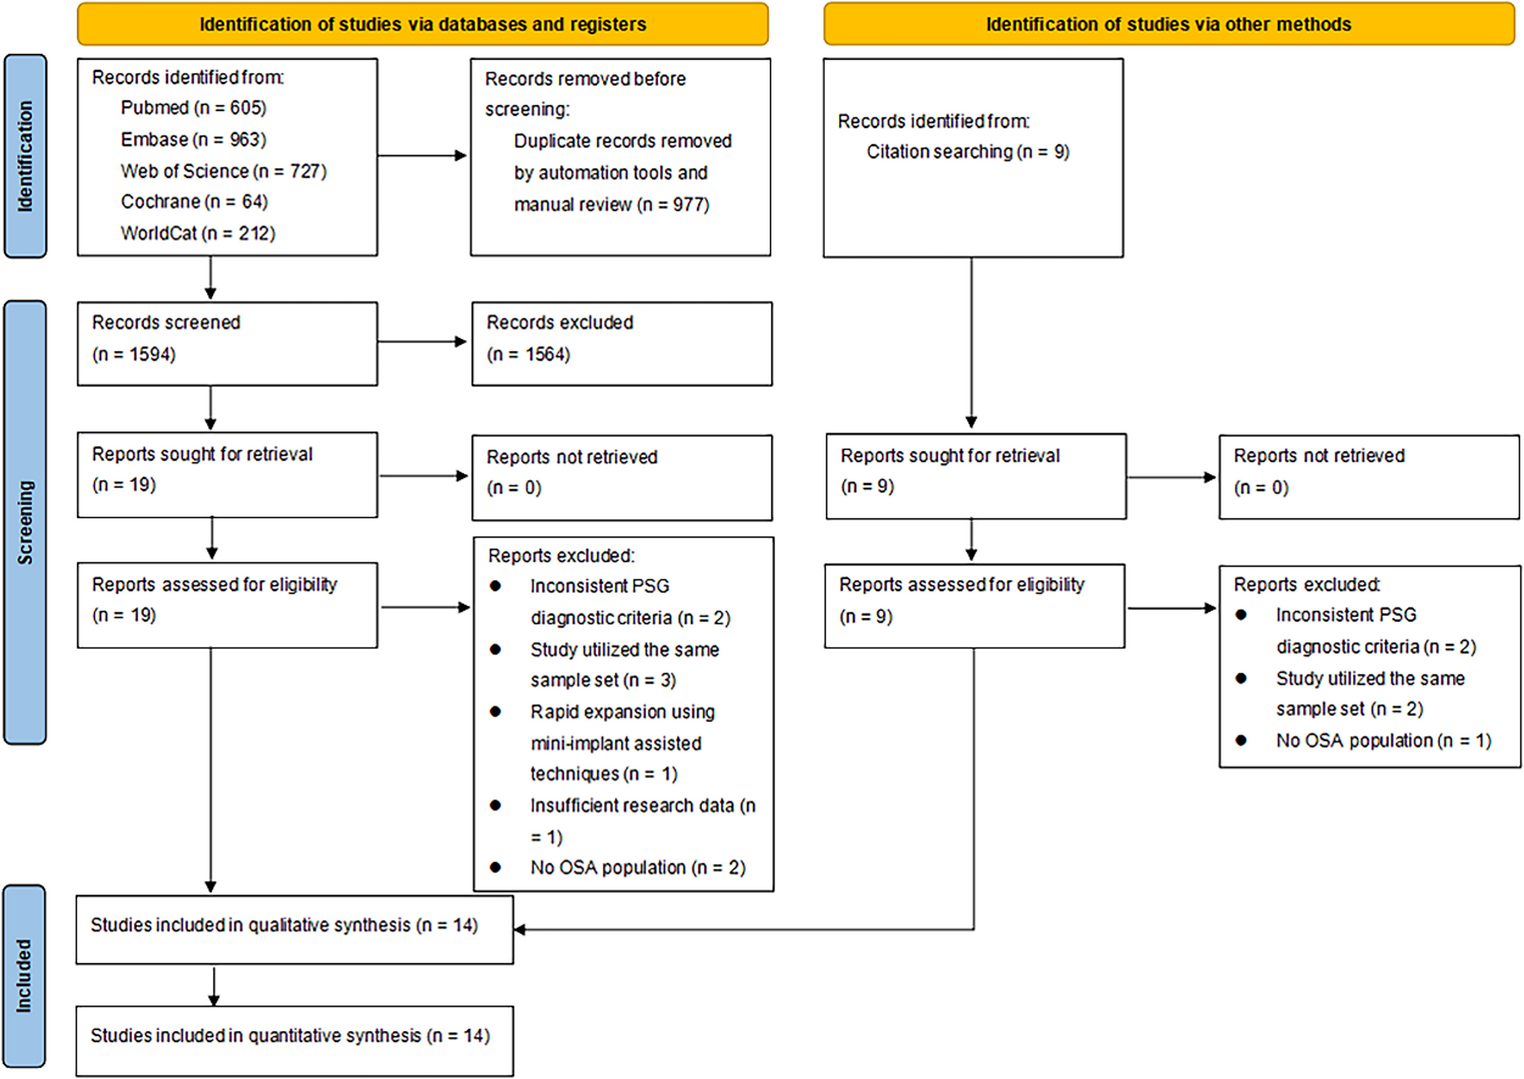
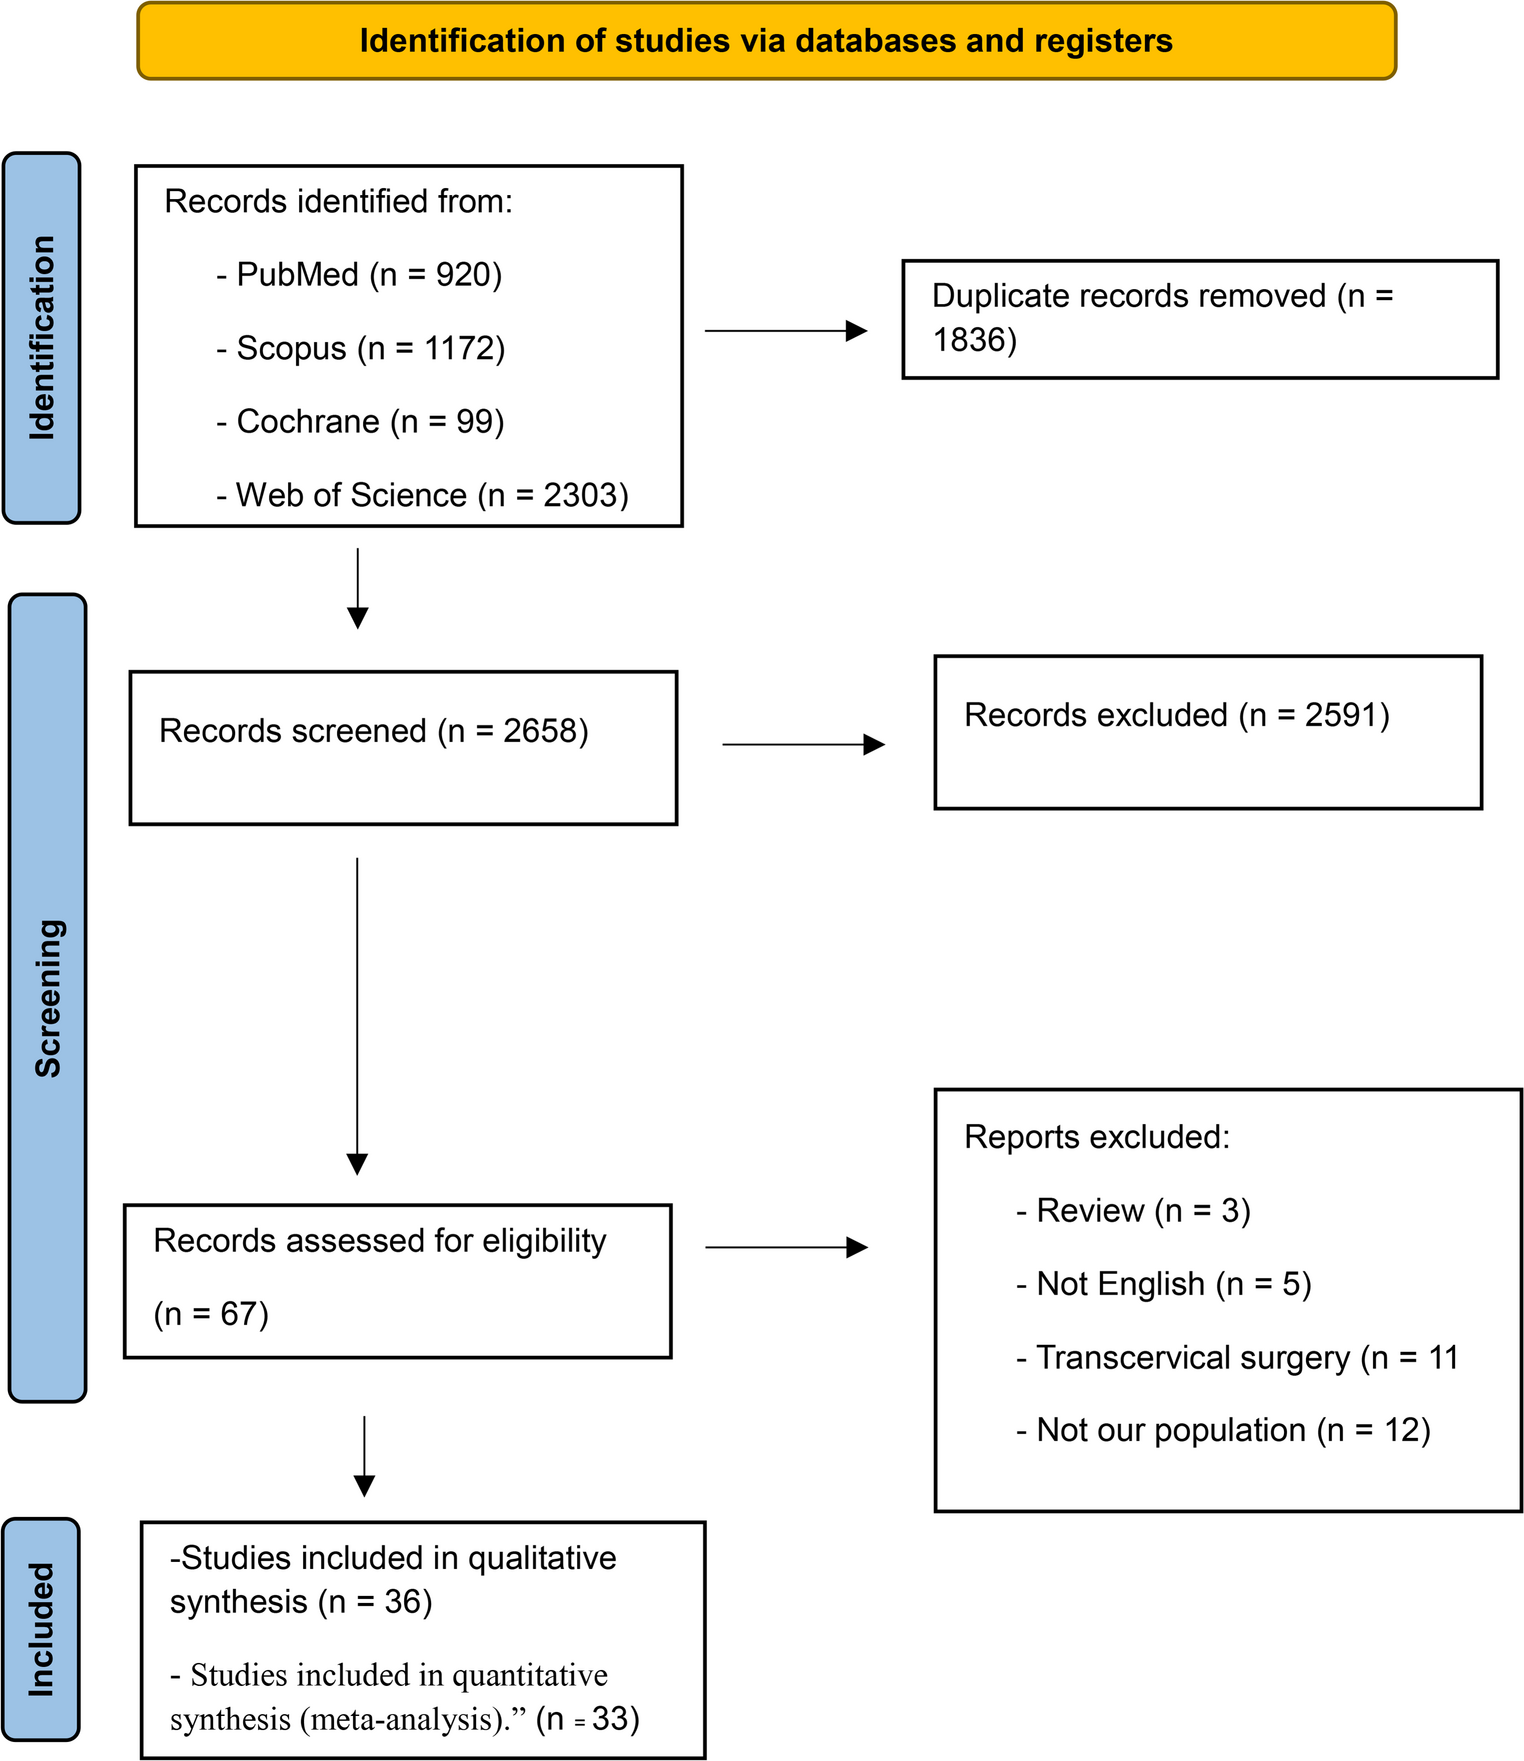
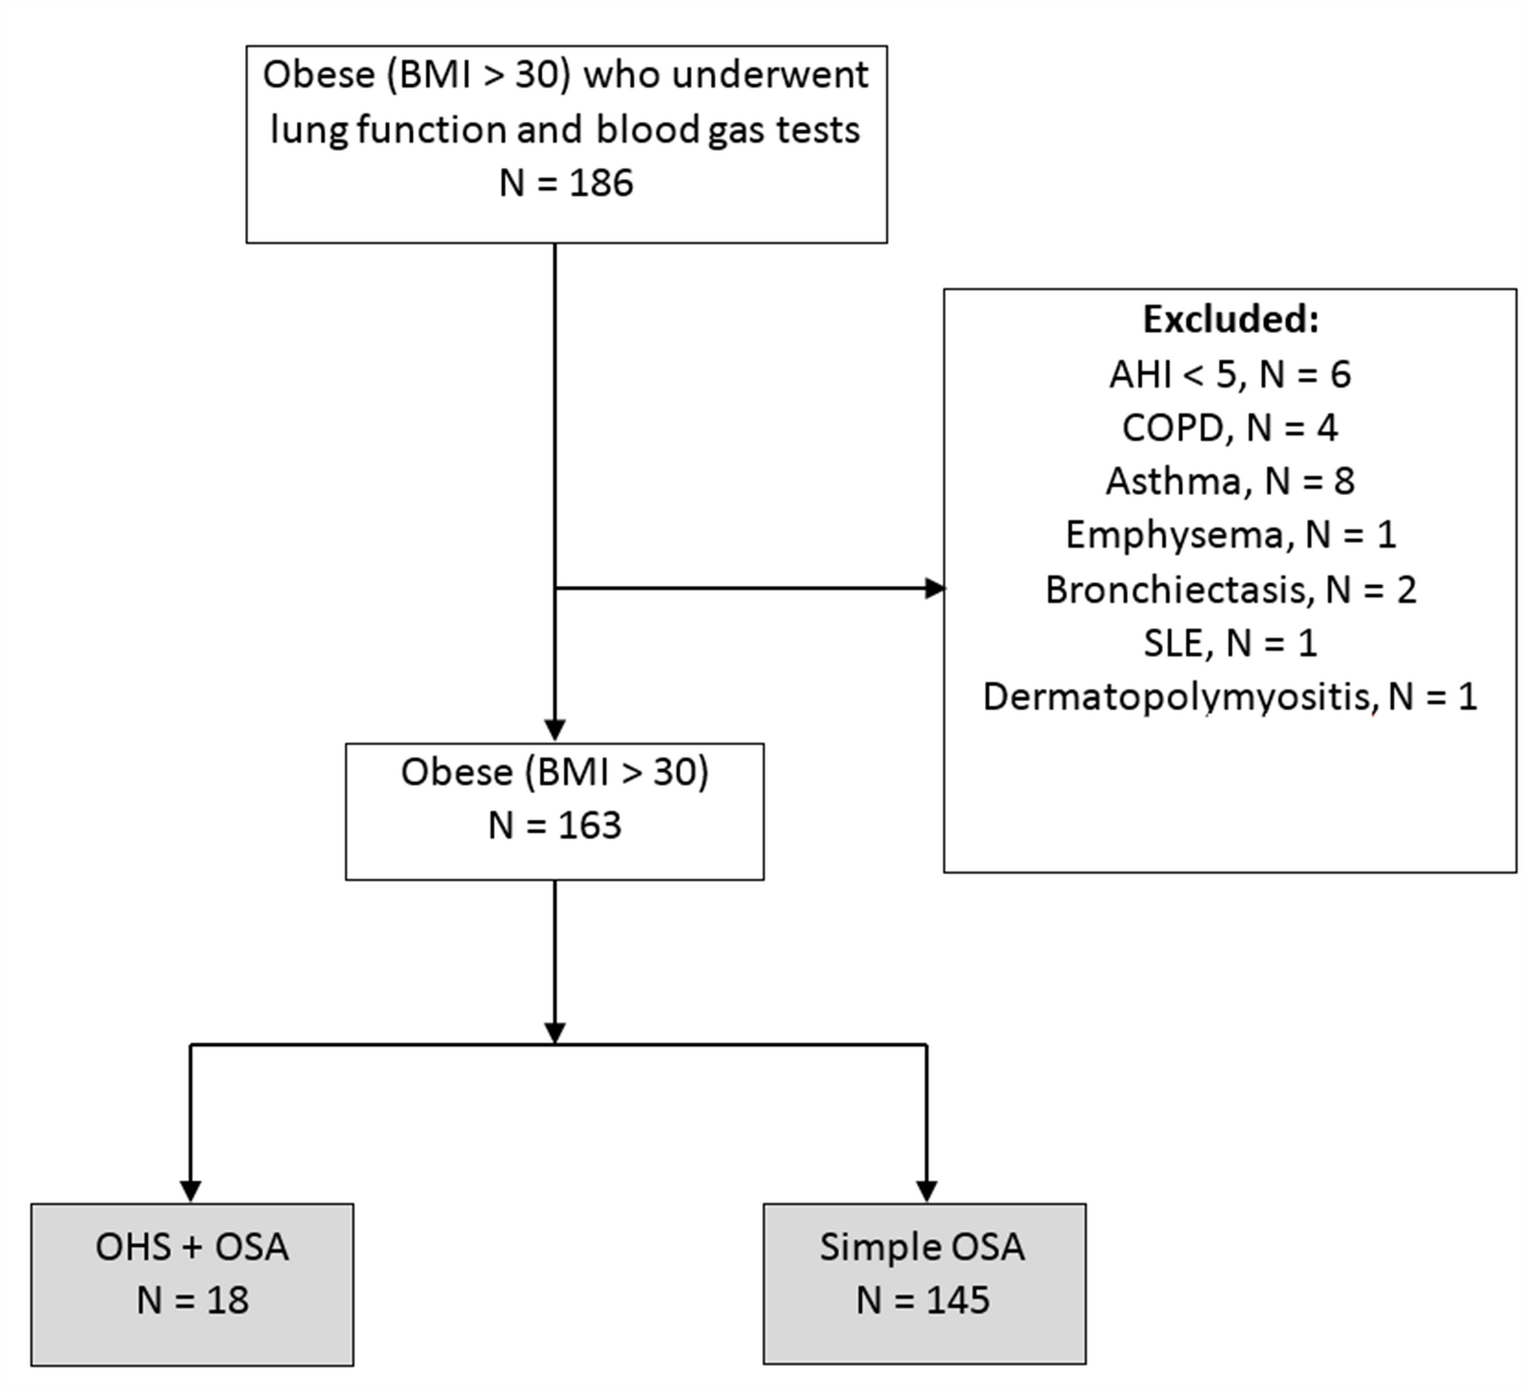
A total of 4,494 records were identified through electronic databases. After removing 1,836 duplicates, 2,658 records were screened by title and abstract. Sixty-seven full-text articles were assessed for eligibility, and 36 studies were included in the final systematic review. Of these, 33 studies provided sufficient quantitative data and were included in the meta-analysis. Figure 1 illustrates the PRISMA 2020 flow diagram for study selection.
Fig. 1
PRISMA 2020 flow diagram for study selection. Three studies were included qualitatively but excluded from the meta-analysis due to missing extractable outcome data
Study characteristicsAmong the 36 studies included in the systematic review [5,6,7,8,9,10,11,12,13,14,15,16,17,18,19,20,21,22,23,24,25,26,27,28,29,30,31,32,33,34,35,36,37,38,39,40], the majority were retrospective or prospective cohort studies. Three were randomized controlled trials, three were non-randomized clinical trials, and two were case series. A total of 6,995 patients were included overall.
Non-robotic techniques: 22 studies.
Robotic techniques (TORS): 10 studies.
Comparative studies (both arms): 4 studies.
Of these, 33 studies provided extractable quantitative data and were included in the meta-analysis.
Mean patient age was 47.0 years in the robotic group and 41.0 years in the non-robotic group. BMI ranged from 28.2 to 29.6 kg/m². Follow-up periods averaged 7.5 months for robotic and 13 months for non-robotic studies.
Detailed study characteristics are presented in Supplementary Table 1.
Risk of bias assessmentOf the 28 cohort studies, six were rated as good quality and twenty-two as fair. Two case series were rated good and fair, respectively. All three randomized controlled trials were categorized as having some concerns regarding bias. Among the three non-randomized clinical trials, two had moderate and one had critical risk of bias. Summary visuals are shown in Supplementary Figs. 1 and 2, and full study ratings in Supplementary Tables 2 and 3.
Apnea-Hypopnea Index (AHI)Twenty-three studies reported AHI outcomes:
Robotic: mean difference (MD) − 25.93 (95% CI: −31.82, − 20.03; p < 0.0001).
Non-robotic: MD − 24.99 (95% CI: −30.07, − 19.00; p < 0.0001).
Between-group comparison revealed no statistically significant difference (p = 0.78; I² = moderate).
Fig. 2
Forest plot of change in apnea–hypopnea index (AHI) comparing robotic and non robotic posterior midline glossectomy
Figure 2. Forest plot of change in apnea–hypopnea index (AHI) comparing robotic and non r obotic posterior midline glossectomy.
Oxygen nadirTwenty studies reported oxygen nadir outcomes:
Robotic: mean improvement of + 5.48% (95% CI: 2.21, 8.75).
Non-robotic: +8.11% (95% CI: 5.06, 11.16).
Between-group comparison revealed no statistically significant difference (p = 0.27).
Fig. 3
Forest plot of change in minimum oxygen saturation (oxygen nadir) comparing robotic and non-robotic posterior midline glossectomy
Figure 3. Forest plot of change in minimum oxygen saturation (oxygen nadir) comparing robotic and non-robotic posterior midline glossectomy.
Epworth Sleepiness Scale (ESS)Seventeen studies reported ESS outcomes:
Robotic: mean change − 7.43 (95% CI: −8.65, − 6.21; p < 0.00001).
Non-robotic: −5.58 (95% CI: −7.83, − 3.34; p < 0.00001).
Between-group comparison revealed no statistically significant difference (p = 0.13).
Fig. 4
Forest plot of change in Epworth Sleepiness Scale (ESS) scores comparing robotic and non-robotic posterior midline glossectomy
Figure 4. Forest plot of change in Epworth Sleepiness Scale (ESS) scores comparing robotic and non-robotic posterior midline glossectomy.
Surgical success rateSeventeen studies reported surgical success rates, defined according to Sher’s criteria (postoperative AHI < 20 and ≥ 50% reduction from baseline):
Fig. 5
Comparative surgical success rates of robotic versus non-robotic posterior midline glossectomy
Figure 5. Comparative surgical success rates of robotic versus non-robotic posterior midline glossectomy.
Other secondary outcomesAcross available studies, no statistically significant differences were found between robotic and non-robotic techniques in:
Forest plots for pain, snoring, and time to diet resumption are presented in Supplementary Figs. 3–5, while ODI, RDI, and operative time comparisons are shown in Supplementary Figs. 6–8. A summary of pooled outcomes across primary and secondary measures is presented in Table 1.
Table 1 Summary of pooled outcomes for robotic and non-robotic posterior midline glossectomy in obstructive sleep apneaComplications Bleedingmore frequent in robotic procedures, ranging from 2.7% to 13.5%, with some cases requiring surgical intervention. Non-robotic techniques demonstrated lower bleeding rates, typically below 6%.
Edemahigher incidence observed in the robotic group, occasionally necessitating prolonged intubation.
Dysphagiareported across both groups, transient in mosr cases (range: 5–47%).
Taste dysfunctionDocumented in both groups (12% to 40%), generally resolving over time.
PainTORS-associated procedures occasionally required intravenous analgesia or inpatient pain control; whereas non-robotic techniques were associated with greater early postoperative discomfort but shorter hospital stay,
Comments (0)