
Remember me
The methods and reporting of this evaluation are consistent with the Consolidated Health Economic Evaluation Reporting Standards checklist [26]. The checklist is presented in the electronic supplementary material (ESM).
2.1 Model StructureA modelled approach was undertaken, incorporating the CUSP study results with data from other sources. A within-trial analysis of the CUSP study was not undertaken because (i) it was a before-and-after study, not a randomised controlled trial; (ii) the impact of upgrading sound processors on HRQoL would likely continue after the trial (6 months) and this study aimed to determine both if and when upgrading sound processors was cost effective (e.g. many years after the end of warranty); and (iii) the CUSP study recruited 34 bilateral CI users, which limited subgroup analysis [24].
A literature review of modelled economic evaluation studies of CIs informed the model structure (see ESM) [27,28,29,30,31,32,33,34,35,36,37,38]. The review did not identify any economic evaluations that directly assessed the cost effectiveness of CI sound processor upgrade or replacement. In 12 modelled economic evaluations of CIs, failure of internal components (internal failure) or external components (external failure) was included as two separate transition health states [31, 37, 38] or together as a single health state (device failure) [30, 33]. Sound processor upgrades or replacements were incorporated as part of the resource use from external failure or as ongoing maintenance costs, which were assumed to occur periodically, with the period between upgrades varying between every 5–10 years [27,28,29,30,31,32,33,34,35,36,37,38]. One study applied a probability of external failure every cycle [37]. None of the identified economic evaluations applied a reduction in HRQoL due to sound processor failure.
We developed two state-transition microsimulation economic models reflecting adults who are (i) unilateral CI users with one sound processor who may also use a hearing aid in the other ear, and (ii) bilateral CI users with two sound processors. We applied a microsimulation approach to track CI users’ age and each sound processor’s age, which increases with each cycle, and thus the risk of parts failing and needing to be replaced, or becoming faulty and needing to be repaired. It was assumed that the age of a sound processor falls to nil years when upgraded to the most current commercially available sound processor. Two models were developed as bilateral CI users may have two sound processors of differing ages due to CIs being implanted at different times or due to upgrading one sound processor, and because sound processors beyond replacement or repair result in no access to sound in that ear—although unilateral CI users may have residual hearing in the non-implanted ear. A microsimulation approach also allowed individual-level data from the CUSP study to be used. Accounting for this heterogeneity in a traditional cohort model would mean modelling several subgroups and substantially increasing the number of health states. A discrete event simulation approach, which models when events occur, was not used because (i) HRQoL was expected to decrease each year due to the individual and the sound processor(s) ageing, (ii) annual sound processor failure and fault probabilities were available (not the time to a failure or fault), and (iii) the model did not require interactions between individuals and their environment.
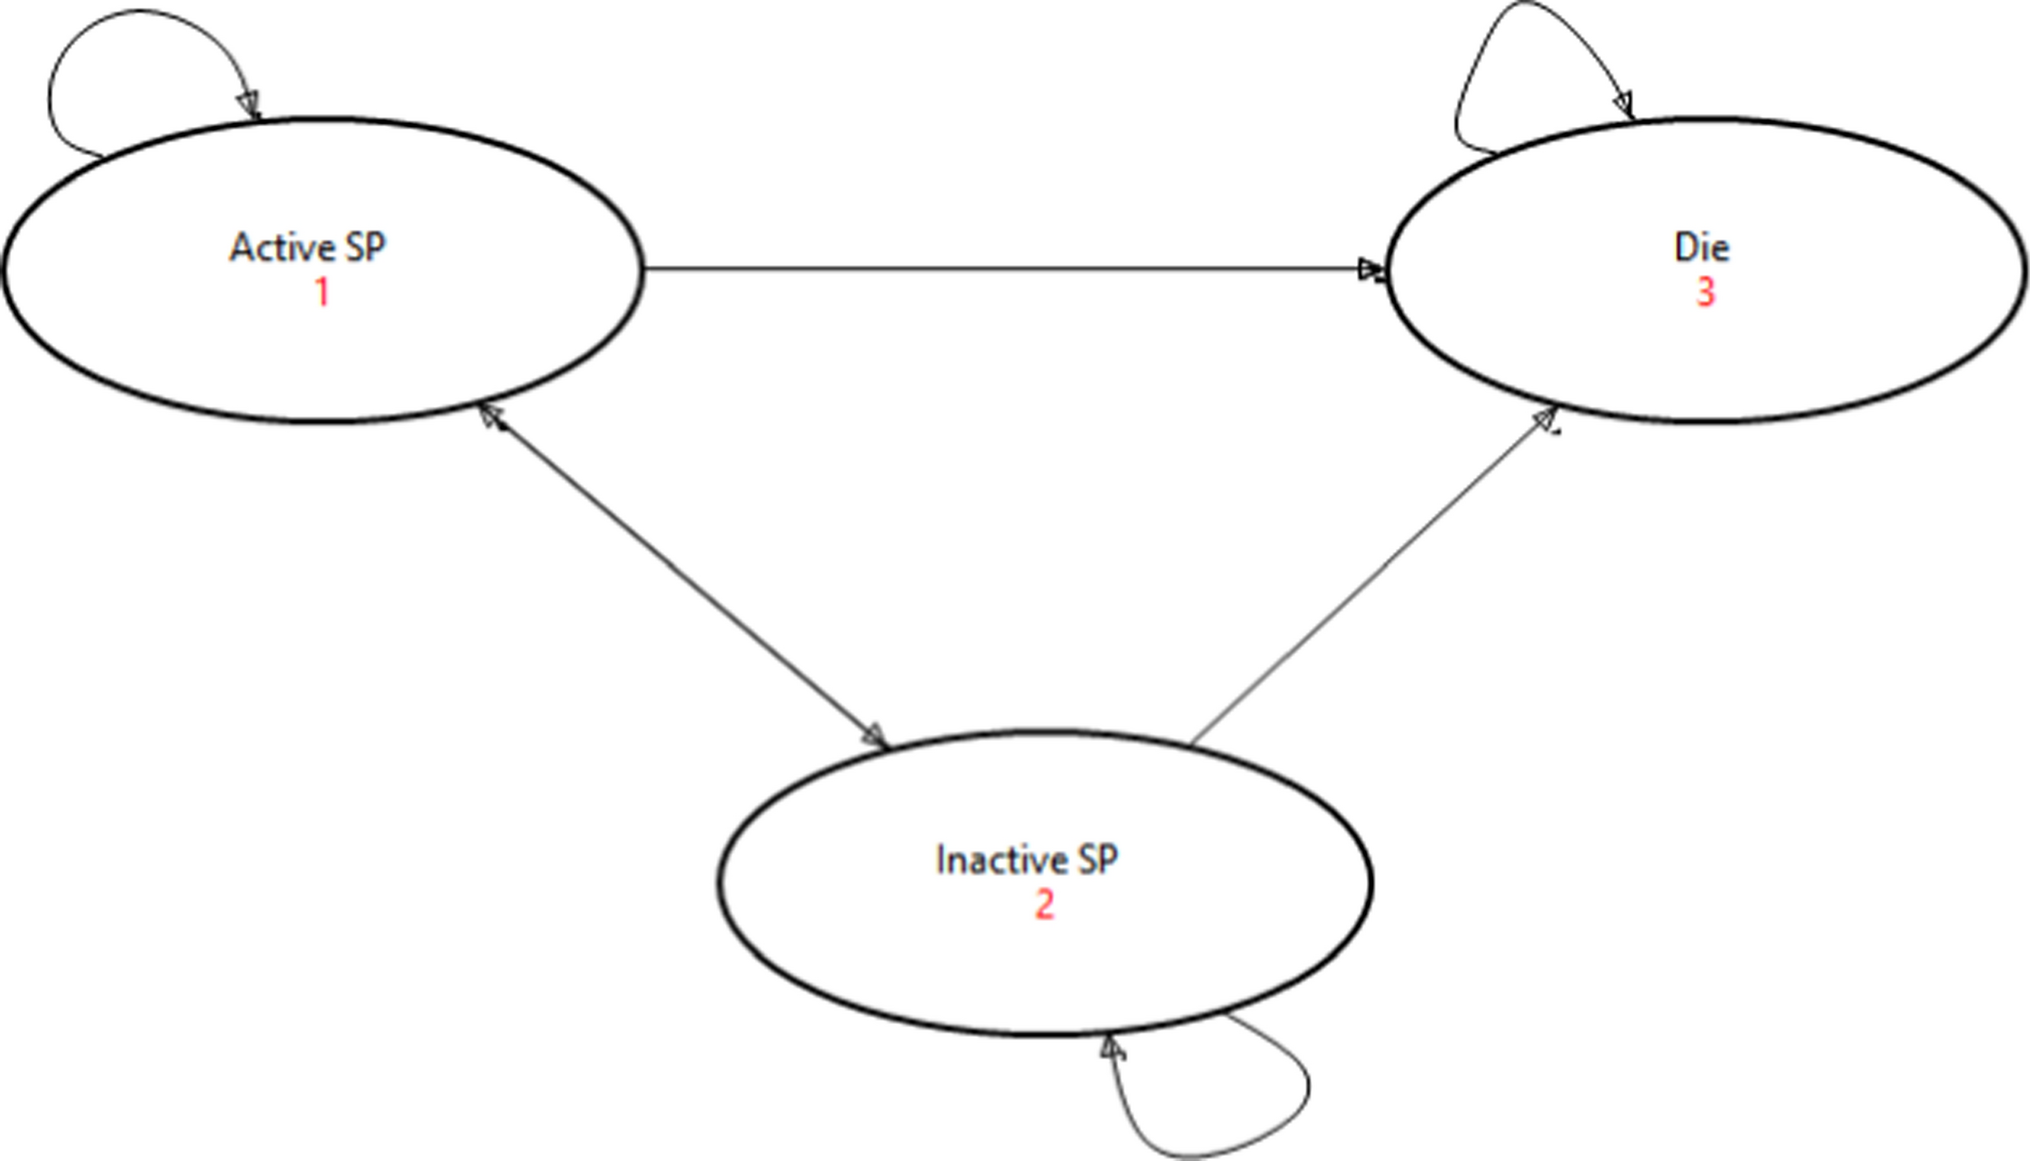
The unilateral CI user model structure is outlined in Fig. 1. Users included those using a CI alone and bimodal users who also use a hearing aid in the opposite ear. The model included three health states: (i) active sound processor; (ii) inactive sound processor; and (iii) death. Users remain in State 1 unless they experience the sound processor or their parts failing, becoming faulty or lost, when they progress to State 2 until the sound processor is replaced or repaired, after which they return to State 1. Sound processors or their parts may fail, become faulty or be lost multiple times. Sound processors may become beyond replacement like-for-like or repair after a certain age, resulting in a CI user having a permanently inactive sound processor or needing to fund an upgrade to the most current commercially available sound processor at the time of the study. Users remain in State 1 or 2 until death (State 3).
Fig. 1
Model structure depicting upgrading unilateral sound processors (Model 1). Inactive indicates failure or fault of sound processor or parts. SP sound processor
The bilateral CI user model structure is outlined in Fig. 2. The model included five health states: (i) active sound processor in ear 1 (SP1) + active sound processor in ear 2 (SP2); (ii) active SP1 + inactive SP2; (iii) inactive SP1 + active SP2; (iv) inactive SP1 + inactive SP2; and (v) death. Users with both sound processors active (State 1) may progress to having one sound processor inactive (State 2 or 3) or both sound processors being inactive (State 4) until the sound processor(s) or their parts are replaced or repaired. Like the unilateral model, sound processors may be beyond replacement like-for-like or repair after a certain age, resulting in a CI user having a permanently inactive sound processor. Users remain in States 1–4 until death (State 5).
Fig. 2
Model structure depicting upgrading bilateral sound processors (Model 2). Inactive indicates failure or fault of sound processor or parts. SP1 sound processor in ear 1, SP2 sound processor in ear 2
In both models, the sound processor age falls to nil after being upgraded and then ages 1 year per cycle. Upgraded sound processors continue to experience failures, faults or become lost, with rates depending on the age of the sound processor. Both models had a 1-year cycle length and a time horizon of 35 years or when the CI user becomes 100 years old. A half-cycle correction was applied.
The following simplifying model assumptions were made:
It was assumed that sound processors are replaced like-for-like with a sound processor from the same generation, that is, the sound processor’s age remains unchanged when replaced. This assumption was consistent with the current HSP policy regarding hearing aids in Australia [39]. However, the ability of hearing services to offer like-for-like replacement or to repair older sound processors is expected to reduce over time. This is because as older generations of sound processors are no longer sold and supported by manufacturers and newer generations of sound processors are launched, the pool of donated or sold older sound processors depletes over time. As a result, sound processors become beyond replacement like-for-like or repair after a certain age, after which they continue to operate until the sound processor or its parts fail, become faulty or are lost and thus become permanently inactive.
A unilateral CI user was assumed to either remain a unilateral CI user or become a non-user, when its sound processor becomes permanently inactive, but cannot receive another CI and become a bilateral CI user. On the other hand, a bilateral CI user can become a unilateral CI user when one sound processor becomes permanently inactive, or a non-user if both sound processors become permanently inactive. Hearing aid usage was assumed not to change over time.
It was assumed that the internal components of cochlear implants do not fail. Only around 4.8% of internal components are estimated to fail over 30 years [40]. It was also assumed that upgrading sound processors did not affect the internal component failure rate, as the reasons for failure are rarely related to the sound processor [41, 42]. Similarly, it was assumed that upgrading sound processors did not affect the continued functioning of the hearing aid in bimodal users.
Hearing loss severity was assumed to not worsen over time as the candidacy for CIs is severe to profound hearing loss. Similarly, hearing loss severity cannot improve over time.
Sound processors are used and age each year if not inactive (failed, faulty or lost). Thus, CI users do not voluntarily self-discontinue.
The rates of sound processors or their parts failing or becoming faulty do not improve with future generations, based on expert opinion.
Sound processor age does not impact mortality due to the lack of evidence suggesting otherwise and based on expert opinion.
CI users’ age affects mortality and utilities, but not the risk of experiencing failures or faults.
The latest sound processor available is backwards compatible with all earlier generations of CIs [41].
Failure and fault rates were based on Cochlear® sound processors, which have the greatest market share in Australia. It was assumed that these failure rates largely reflect other available brands. It was also assumed that there are no differences in the benefit of upgrading sound processors across brands, similar to there being a lack of evidence regarding differences between cochlear implant systems [43].
The models bootstrapped 10,000 CI users from the CUSP study using a first-order Monte Carlo simulation. CI users recruited into the CUSP study were more likely to have older sound processors than the population of adults eligible for a sound processor upgrade, as estimated by the participating CUSP clinics. Consequently, participants using the Nucleus® 6 (sound processor age 5 to < 7 years) were weighted more (1.556) than participants using the Nucleus® 5 (sound processor age 7 to < 11 years, weighting = 0.653) or the Freedom™ or older (sound processor age > 11 years, weighting = 0.648).
Health outcomes were reported in terms of quality-adjusted life years (QALYs). Costs and QALYs were both discounted at 5%, following Australian guidelines [44]. The microsimulation models were designed with TreeAge Pro Healthcare 2021 (TreeAge Software, Williamstown, MA, USA).
2.2 Model Inputs2.2.1 Cochlear Implant User CharacteristicsCI users’ age and sound processor age were based on the CUSP study [24]. Descriptive statistics are provided in the ESM. CI users were aged 77.44 years on average and had hearing loss for 47.42 years. Most (51.00%) users had a unilateral CI and a hearing aid (i.e., bimodal), with the average sound processor age being 8.80 years. Another 32% of users had a unilateral CI alone, with the average sound processor age being 10.60 years. Finally, 17.00% of users had a bilateral CI with the average sound processor being 7.35 years (younger sound processor) and 10.33 years (older sound processor).
2.2.2 Transition ProbabilitiesFailed sound processors that are not repairable and lost sound processors were assumed to be replaced whenever possible. Faulty sound processors that are repairable were assumed to be repaired or parts replaced whenever possible. Failure rates for newer sound processors (Nucleus® 7 and Kanso® 2) were based on published reliability data from 2018 to 2021 [15, 45, 46]. As the reliability data was not split by replacements and repairs, fault rates resulting in repairs for newer sound processors were assumed to be nil to avoid double counting. Failure and fault rates for older sound processors were estimated based on a survey of four clinics servicing 447 users participating in the CUSP study. The clinics were asked the following questions separately for Nucleus® 6, Nucleus® 5 and Freedom™ or older sound processors, which they answered based on service records (see ESM):
Failure rates resulting in replacement: “how many in-warranty/out-of-warranty replacements of faulty sound processors did you process over the past 12 months?”.
Fault rates: “how many in-warranty/out-of-warranty repairs of faulty sound processors did you process over the past 12 months?” and “how many in-warranty/out-of-warranty replacements of sound processor parts (e.g. coil/cable etc.) did you process over the past 12 months?”.
Lost rates: “how many replacements of lost sound processors did you process over the past 12 months?”.
Annual rates for each clinic were then estimated by dividing by the total number of users with these sound processors serviced by the clinic. It was assumed that the lost rate for newer sound processors was the average of older sound processors in the absence of data. Data from the largest CUSP clinic site was used in the base case, as it provided the most comprehensive data. The impact was explored in a scenario analysis. Failure, faulty and lost rates for each sound processor are provided in Table 1.
Table 1 Input parameters (probabilities and utilities)Population mortality rates were estimated based on life tables published by the Australian Bureau of Statistics [47]. Mortality rates are provided in the ESM.
2.2.3 Health OutcomesThe CUSP study measured outcomes at baseline, at week 4 and 6 months following sound processor upgrade. The study found that upgrading sound processors had significant improvements in speech understanding in noise and reduced communication difficulties, self-reported listening effort and fatigue, suggesting that upgrading sound processors would improve CI user well-being [24].
HRQoL was also measured in the CUSP study using the standard Health Utility Index 3 (HUI3), 15-item, English language questionnaire for self-assessment and self-completion [24, 48]. HUI3 measures eight attributes: hearing, vision, speech, ambulation, dexterity, emotion, cognition, and pain. The HUI3 is more sensitive to hearing than other multi-attribute utility instruments [49]. Individuals were asked about their HRQoL over the last 7 days pre-upgrade, and 4 weeks and 6 months after sound processor upgrade. A multi-attribute utility scoring function based on Canadian community preferences was used to convert responses to utilities [50]. Utilities based on HUI3 are defined for the interval − 0.36 to 1.00. Scores below zero are deemed as worse than dead. Differences in the overall mean score of at least 0.03 are considered clinically meaningful [48]. Utility data were missing for 6/200 (3.00%) respondents at baseline, 34/200 (17.00%) respondents at 4 weeks and 26/200 (13.00%) respondents at 6 months. In instances where 4 weeks’ or 6 months’ utility data were not captured, the missing values were imputed from the utility data at baseline or 4 weeks, respectively, using the last observation carried forward (LOCF) approach.
The CUSP study found that sound processor upgrades increased utilities by 0.0349 after 6 months. This difference would be considered clinically meaningful; however, the association was not statistically significant [24]. This may be due to CI users having multiple comorbidities that worsen over time, which confounded and overpowered the impact of hearing improvements, and most participants were unilateral CI users (83%). To address potential confounding, a maximum likelihood linear mixed-effect model was used to test the CI upgrade effect on utilities over time, while controlling for CI configuration, user age and whether the CI uses a hearing aidFootnote 1. It was assumed that the sound processor age was 0.077 years (4/52 weeks) at the 4-week follow-up and 0.5 years at the 6-month follow-up after a sound processor was upgraded. Disutilities (=1 − Utilities) for unilateral CI users (Disutilities_Unilateral) were estimated using Eq. 1:
Similarly, utilities for bilateral CI users (Disutilities_Bilateral) were estimated using Eq. 2:
$$_=f(_, YoungestS_,OldestS_)$$
(2)
Where User_Age is the CI users’ age (years), SP_Age is the age of the sound processor (years), Hearing_aid_active is whether the CI user also uses a hearing aid (= 1 if true), YoungestSP_Age is the age of the youngest sound processor (years), OldestSP_Age is the age of the oldest sound processor (years), i is the participant ID, and t is the time period.
The results are presented in the ESM. It was estimated that disutilities increased by 0.0010 (95% CI − 0.0015 to 0.0035) for each year a sound processor aged for CI users with unilateral sound processors with and without concomitant use of hearing aids (p value = 0.443). Thus, upgrading a 5-, 10- and 15-year-old sound processor would increase utilities in the first year by 0.0049, 0.0099, and 0.0148, respectively. These differences in utilities would not be considered clinically meaningful, based on a difference of 0.03 [48]. In contrast, it was estimated that disutilities decreased by 0.014 (younger sound processor) and increased by 0.0031 (older sound processor) for each year a sound processor aged for CI users with bilateral sound processors (p value for younger sound processor = 0.3380 and that for older processor = 0.7870). Thus, upgrading a 5-, 10- and 15-year-old sound processor would increase utilities in the first year of the younger sound processor by 0.0701, 0.1403 and 0.2104, respectively. Thus, the impact of upgrading younger sound processors on utilities would be considered clinically meaningful, based on a difference of 0.03 [48].
Sound processors may also become inactive due to sound processor failure or faults. The disutility associated with an inactive sound processor was based on Summerfield et al. [51]. It was assumed that disutilities associated with a single sound processor becoming inactive for unilateral CI users would be − 0.188 (95% CI − 0.150 to − 0.226), and for bilateral CI users would be − 0.031 (95% CI − 0.018 to − 0.042). These impacts would be considered to be clinically meaningful, based on a difference of 0.03 [48]. The disutility associated with both sound processors becoming inactive for bilateral CI users would be the sum of both estimates (− 0.188 + − 0.031). This approach may be an underestimate, as the implantation of a CI removes any residual hearing, and so the impact on utilities of losing the functionality of a CI is likely to be greater than the impact on utilities of implanting a CI in the ear. Another small randomised controlled trial comparing bilateral CI versus unilateral CI/bimodal (N = 38) found that bilateral CIs significantly improved some measures of hearing and a non-statistically significant improvement of HUI3 of 0.06 [52, 53], greater than Summerfield et al. (2002), suggesting that this may be a conservative estimate [51].
The duration users experience an inactive sound processor was estimated based on the survey of clinics participating in the CUSP study (see ESM). Clinics were asked “approximately, what was the average time in days required to provide a working repaired/replaced/loaner device in cases of faulty processors? (i.e. how long was the user off air in days?)”. A similar question was asked for lost sound processors and faulty sound processor parts. Scenario analysis was conducted on this parameter. Parameter values applied in the model are provided in Table 1.
2.2.4 CostsFor CI recipients receiving a sound processor upgrade, the estimation of cost outcomes included a one-off upgrade cost, incorporating a device cost and the service cost for sound processor programming. The device cost was based on a weighted average of the listed price of Cochlear’s most recent sound processor (Nucleus® 7 or Kanso® 2) on the Prostheses List [54]. These costs were assumed to be incurred by the HSP. The service cost for programming the sound processor was based on the Medicare Benefits Schedule (MBS) [55], assuming one service claim per sound processor upgrade, as advised by clinical experts. The impact of two service claims per upgrade per sound processor was explored in a scenario analysis. Other costs included in the model included the costs of maintenance and battery supplies; repairs for faulty sound processors; replacements for faulty sound processor parts (e.g. cables) as well as replacements for faulty and lost sound processors. The cost of maintenance and battery supplies was based on the annual service fee on the HSP [56]. The unit costs and resource use for out-of-warranty (beyond the first 3 years) annual repairs and replacements were informed by the CUSP clinic survey and stratified by the age categories of sound processors. Data from the largest CUSP clinic site was used in the base case, as it provided the most comprehensive data. The impact was explored in a scenario analysis. The unit costs of like-for-like replacement of lost sound processors were based on the Prostheses List for sound processors < 3 years old, using the Cochlear brand as a proxy, and the CUSP survey for lost sound processors 3 years and older. All in-warranty costs on repairs or replacements were assumed to be nil, while out-of-warranty costs were assumed to be incurred by the HSP. It was assumed that all CI recipients, unilateral or bilateral, were existing HSP clients and therefore incurred a reassessment cost every 5 years, with the cost based on the reassessment fee on the HSP [56]. Sensitivity analysis was conducted by comparing taking an Australian healthcare system perspective in the base case (HSP costs, Medicare Benefits Schedule costs and out-of-pocket costs) to a HSP perspective (HSP costs only). Further details on the unit costs and resource use are presented in Table 2. All costs are reported in 2022 Australian dollars (AUD).
Table 2 Input parameters (unit costs and resource use)2.2.5 AnalysisIncremental costs and outcomes (QALYs) were summarised using the incremental cost-effectiveness ratio (ICER). ICERs were estimated for users with unilateral and bilateral CIs separately, by the frequency that sound processors are upgraded in 1-year increments from every 3 years (end-of-warranty) to every 20 years, and by the age when sound processors are no longer able to be replaced or repaired (15 years, 20 years and always able to be replaced or repaired) [25].
Threshold analysis was conducted to estimate the upgrading frequency (in terms of sound processor age) such that the ICER equals a certain value. Interventions such as CIs are assessed by the Medical Services Advisory Committee (MSAC) in Australia. The MSAC does not explicitly recommend a threshold to assess whether investing in a new health intervention is cost effective. Consequently, threshold analysis was conducted using implicit thresholds of AUD$40,000 and AUD$50,000 per QALY gained [57]. Threshold analysis was conducted on (i) laterality (unilateral vs bilateral CIs); (ii) CI users’ age at the time of initial upgrade (65+ years, 65–74 years, 75–84 years and 85+ years); (iii) sound processor cost (AUD$5000, AUD$7000, AUD$9000, AUD$11,000 and AUD$13,000); (iv) whether the costs were from the perspective of the Australian health system perspective or the HSP perspective (excluding MBS costs, out-of-pocket costs, and staff time costs); (v) if there was no utility impact from a change in the sound processor age (coefficients = 0; base case: various); and (vi) if there was a single utility impact of 0.0349 for the first sound processor upgrade regardless of the sound processor age, based on the average across all participants in the CUSP study, and no additional gains from subsequent sound processor upgrades.
Univariate sensitivity analysis was conducted for costs, utility estimates and probabilities using 95% confidence intervals and assuming the upgrading frequency equals that needed for the base case ICER to be AUD$40,000 or AUD$50,000 per QALY gained. The following scenario analyses were also explored: (i) removing CUSP study participant weighting; (ii) decreasing the model time horizon (5, 15, and 25 years; base case: lifetime); (iii) different discount rates (3.5%, 7%; base case: 5%); (iv) increasing the duration that users experience an inactive sound processor (7 days, 14 days; base case: 1 day); (v) increasing the number of programming service claims (two per upgrade; base case: one per upgrade); (vi) changing the source of failure/fault/lost rates and resource use data (all CUSP clinic sites; base case: largest CUSP clinic site); (vii) if there was no utility impact from a change in the sound processor age (coefficients = 0; base case: various); (viii) if there was a single utility impact of 0.0349 for sound processor upgrades; (ix) if there was no utility impact of losing a bilateral sound processor; and (x) adding the risk and impact of internal device failure (4.8% over 30-year risk [40], AUD$39,519 cost of reimplantation [58], assumed device inactive for 3 months).
Probabilistic sensitivity analysis (PSA) using a second-order Monte Carlo simulation involving 1000 iterations assessed the impact of varying fixed parameters drawn from their distributional assumptions [59]. Beta distributions were assumed to represent the uncertainty in the probability parameters. Normal or Gamma distributions were assumed to represent the uncertainty in disutilities from the regression analysis of the CUSP study and the literature, respectively [59]. Gamma distributions were assumed to represent the uncertainty in costs and the duration that users experience an inactive sound processor so that they could not be negative values. Cost-effectiveness acceptability curves were presented to illustrate the PSA iterations graphically [59].
2.2.6 Model ValidationModel validation was guided by the Assessment of the Validation Status of Health-Economic decision models (AdViSHE) tool, a validation-assessment tool of health-economic models for decision makers and model users (see ESM) [60]. The conceptual model was checked for face validity by hearing experts (from NAL) and cross-compared with economic models for similar decision problems in the literature. Hearing experts also checked the model assumptions and the input parameters. Independent checks were undertaken in the Excel sheets and TreeAge models to detect coding errors. Markov traces are included in the ESM.
Comments (0)