
Remember me
Wild-type (WT) mice were purchased from Charles River. Synaptobrevin2-mRFP knock-in (Syb2 KI) [35], granzyme B-mTFP knock-in (GzmB KI) [32], and Munc13-4 KO [37] mice were generated as described previously. All the transgenic and WT mice used in this study were on a C57BL/6N background, except for the GzmB-KI mice, which were on a C57BL/6J background. Mice of both sexes, aged 15–22 weeks, were used for the experiments. The animals were housed under standard conditions (22 °C, 50–60% humidity, and a 12-hour light/dark cycle). All the experimental procedures were conducted in compliance with the regulations of the state of Saarland (Landesamt für Verbraucherschutz, AZ.: 2.4.1.1 and 11/2021).
Human CTLsHuman peripheral blood mononuclear cells (hPBMCs) were obtained from the blood bank of the University Hospital of the Saarland. The local ethics committee of the Saarland Medical Association (Ärztekammer des Saarlandes) approved the research with human material conducted for this study (Az. 98/15). Human CD8⁺ T cells were negatively isolated from the PBMCs of healthy donors via the Dynabeads FlowComp Human CD8 Kit. CD8⁺ T cells were activated and cultured under the same conditions as those described for mouse CTLs, with AIM-V medium supplemented with 10% FCS, 0.5% penicillin‒streptomycin, and 100 U/mL human recombinant IL-2 (Gibco) to support expansion. The cells were cultured at 37 °C in a 5% CO₂ atmosphere.
Cell cultureSplenocytes were isolated from 15–22-week-old mice as described previously [5]. Naive CD8 + T cells were positively selected via the Dynabeads FlowComp Mouse CD8 Kit (Invitrogen) following the manufacturer’s protocol. Isolated CD8 + T cells were stimulated with anti-CD3/anti-CD28 activator beads (1:0.6 ratio) and cultured for 5 days in AIM-V medium (Invitrogen) supplemented with 10% FCS, 1% penicillin‒streptomycin (Invitrogen), and 50 µM 2-mercaptoethanol. The cells were cultured at a density of ~1 × 10⁶ cells/mL in 24-well plates. On day 2 poststimulation, 100 U/mL recombinant IL-2 (Gibco) was added to support T-cell proliferation. The resulting activated effector CTLs were used for subsequent experiments.
For human CTL cultures, CD8+ T cells were negatively isolated from the PBMCs of healthy donors via the Dynabeads FlowComp Human CD8 Kit (Invitrogen). CD8+ T cells were activated and cultured under the same conditions as those described for mouse CTLs, with AIM-V medium supplemented with 10% FCS, 1% penicillin‒streptomycin, and 100 U/mL human recombinant IL-2 (Gibco). P815 target cells were cultured in RPMI medium (Invitrogen) supplemented with 10% FCS and 1% penicillin‒streptomycin (Invitrogen). All the cell cultures were maintained at 37 °C with 5% CO₂.
Mouse xenograft model of lung cancerThis model was constructed in compliance with the German legislation governing animal welfare and the principles outlined in the Guide for the Care and Use of Laboratory Animals (8th Edition, 2011). Protocols for these experiments were approved by the local animal protection committee (permit number: 23/2020). Twelve-week-old male C57BL/6 J mice (22–25 g; Charles River Laboratories) were anesthetized with isoflurane (5% for introduction, 2% for maintenance). A total of 1 × 10⁶ Lewis lung carcinoma LL/2 cells suspended in PBS were subcutaneously injected into the left flank of each animal. Twenty-eight days after tumor inoculation, the mice were euthanized, and the tumors were excised and fixed in 4% formalin for 24 hours for subsequent immunohistochemical analysis. Fixed tumor tissues were sectioned into 100 μm thick slices via a vibrating microtome (Leica VT1200 S). The sections were stained with anti-IFNγ-Alexa488 (BioLegend, clone XMG1.2), anti-CD8a-PE (BD; clone 53-6.7), and anti-GzmB-Alexa647 (BioLegend; clone GB11) antibodies.
PlasmidsTo generate serglycin expression constructs, the pMax-mSTX11-mNeonGreen [59] plasmid was used as the starting vector. The mouse serglycin coding sequence was amplified via PCR from cDNA derived from activated mouse CD8⁺ T cells and subcloned and inserted into the pMax-mSTX11-mNeonGreen backbone via EcoRI and BamHI restriction sites, thereby replacing the STX11 coding sequence and generating pMax-mSrgn-mNeonGreen. To generate pMax-mSrgn-mScarletI, the mNeonGreen coding sequence was replaced with mScarletI using the BamHI and XmaI restriction sites.
Mouse and human IFNγ expression constructs were generated via PCR amplification of IFNγ coding sequences from cDNA derived from activated mouse CD8⁺ T cells or human peripheral blood mononuclear cells (PBMCs), respectively. For mouse IFNγ constructs, the IFNγ coding sequence was amplified via primers containing KpnI and EcoRI restriction sites and subcloned and inserted into the pMax-GzmA-mCherry backbone, replacing the granzyme A coding sequence to generate pMax-mIFNγ-mCherry. To generate additional fluorescent fusion constructs, mouse IFNγ was subcloned and inserted into pMax-mSrgn-mScarletI or pMax-mSrgn-mNeonGreen backbones via EcoRI and BamHI restriction sites, replacing the serglycin coding sequence and yielding pMax-mIFNγ-mScarletI and pMax-mIFNγ-mNeonGreen, respectively. C-terminal IFNγ mutants were generated via site-directed mutagenesis via an NEB site-directed mutagenesis kit according to the manufacturer’s instructions. The basic C-terminal motif of mouse IFNγ (RKRKRSRC) was replaced with either a neutral sequence (AAAAASAC; IFNγ-A) or an acidic sequence (EEEEESEC; IFNγ-E). Mutagenesis was performed using pMax-mIFNγ-mScarletI or pMax-mIFNγ-mNeonGreen as template plasmids. For human IFNγ constructs, the IFNγ coding sequence was amplified from PBMC-derived cDNA via primers containing EcoRI and BamHI restriction sites and subcloned and inserted into the pMax-mSrgn-mNeonGreen backbone, replacing the serglycin coding sequence to generate pMax-hIFNγ-mNeonGreen. All plasmid constructs were verified by Sanger sequencing (Microsynth Seqlab, Göttingen, Germany).
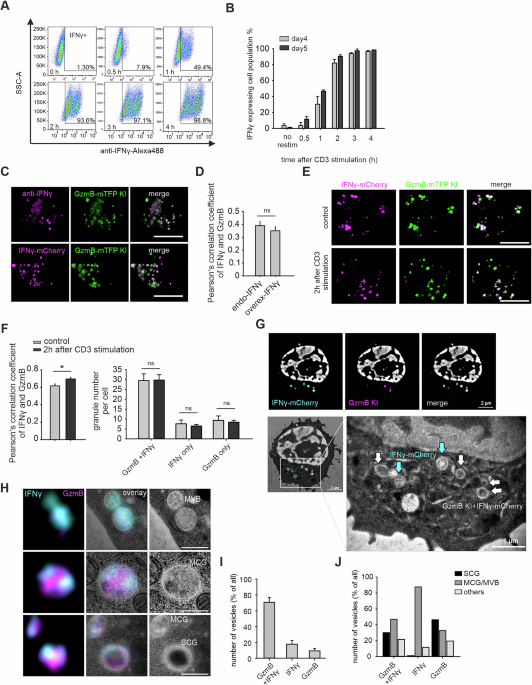
Flow cytometryFor flow cytometry analysis, 0.5 × 10⁶ day 4–5 effector CD8 + T cells were resuspended in D-PBS (Gibco) and incubated in the dark on ice for 30 minutes with the following cell surface markers: anti-CD44-PE (eBioscience, clone IM7, 1:200), anti-CD62L-APC (BD Pharmingen, clone MEL-14, 1:200), and anti-mIFNγ-Alexa488 (BioLegend, clone XMG1.2, 1:100). Day 5 human effector CD8 + T cells were treated with 5 µg/mL brefeldin A (Sigma; B6542) for 2 hours before fixation and staining with anti-hIFNγ-Alexa594 (BioLegend, clone B27, 1:200). Intracellular IFNγ staining was performed using a Transcription Factor Buffer Set (BD Pharmingen). Data acquisition was performed on a BD FACSAria III analyzer (BD Biosciences) via BD FACSDiva™ software. Flow cytometry data were analyzed with FlowJo v10.0.7 software.
Killing assayDay 3 effector WT or Munc13-4 KO CTLs (5 × 10⁴ cells) were cocultured with P815 target cells at the indicated T-cell–target ratios in 96-well U-bottom plates. P815 cells were prestained with 0.5 µM CellTrace Far Red (Invitrogen) for 10 minutes at room temperature (RT) and washed once with D-PBS before being cocultured with T cells. The cells were cultured in RPMI-based medium for 3 hours in the presence of an anti-mCD3 antibody (5 µg/mL) at 37 °C with 5% CO₂. To evaluate the contribution of IFNγ to killing, cells were treated with anti-IFNγ (Biolegend, clone XMG1.2) to neutralize secreted IFNγ in the medium or recombinant mouse IFNγ (Abcam) to increase soluble IFNγ levels. Following incubation, the cells were stained with 0.5 µg/mL propidium iodide (PI) and analyzed by flow cytometry. Dead target cells were identified as the APC⁺ PI⁺ population.
For STAT1 inhibition, P815 cells were preincubated with either 1 µM fludarabine phosphate [39] (Sigma, F9813) or 1 µM DMSO as a vehicle control for 12 h in RPMI-based culture medium. Pretreated cells were then loaded with 0.5 µM CellTrace Far Red and washed once with DPBS before the killing assay. A total of 5 × 10⁴ P815 cells per well were plated in a U-bottom 96-well plate with 2.5 µg of anti-CD3ε and 0.4 µM NucView Caspase-3 substrate (Biotium) to label apoptotic cells. WT CTLs were added to the wells at the indicated effector-to-target ratios for a 4 h killing assay at 37 °C and 5% CO₂. Apoptotic cells were identified as the APC⁺ CC3⁺ population.
To evaluate the synergistic effects of IFNγ with other lytic molecules, P815 cells were seeded at 1 × 10⁵ cells per well in 96-well V-bottom plates. The cells were preincubated with recombinant mouse IFNγ (10 ng/ml) overnight and subsequently treated with a sublytic dose (see the next methods section) of human perforin (hPerf) in combination with mouse granzyme B (mGzmB, 600 nM) for 4 h at 37 °C. After incubation, the cells were washed once with cold PBS and resuspended in binding buffer. Annexin V–FITC (Immunostep; ANXVF-200T) was added according to the manufacturer’s protocol, and the cells were incubated for 15 min at room temperature in the dark. PI (2 μg/ml) was added during the last 5 min of incubation. The samples were then washed twice with binding buffer and resuspended prior to acquisition. Flow cytometry was performed on a MACSQuant VYB cytometer (Miltenyi Biotec), and the data were analyzed via Kaluza software (Beckman Coulter). Cell death was quantified as (i) the percentage of Annexin V–positive cells and (ii) the increase in cell death (%) relative to basal levels in vehicle-treated controls. Control conditions (vehicle, perforin only, and granzyme B only) were included in each experiment.
Determination of sublytic perforin doseThe sublytic dose of human perforin (hPerf) was determined by assessing PI uptake. Briefly, 5 × 10⁴ P815 cells were incubated with serial dilutions of hPerf for 15 min at 37 °C. After washing, the cells were stained with PI (2 μg/ml) and analyzed via flow cytometry. A concentration of hPerf that induced ~5–20% cell death was defined as sublytic and was used for subsequent assays.
Total internal reflection fluorescence (TIRF) microscopyFor secretion analysis, day 5 effector mouse CTLs (mCTLs) isolated from GzmB KI mice and day 5 human CTLs were used. Mouse CTLs were transfected with mIFNγ-mCherry, while human CTLs were cotransfected with hIFNγ-mNeonGreen and hGzmB-mCherry via electroporation (Lonza kit). The cells were allowed to express transgenes for 12 hours at 32 °C in OptiMEM-based transfection medium supplemented with 10% FCS, 10 mM HEPES, 1% DMSO, and 1 mM sodium pyruvate [60] before TIRF microscopy. Two hours prior to imaging, the activator beads were removed from the cultures. For imaging, 3 × 10⁵ cells were resuspended in 30 µl of extracellular buffer (10 mM glucose, 5 mM HEPES, 155 mM NaCl, 4.5 mM KCl, and 2 mM MgCl₂) and allowed to settle for 1–2 minutes on anti-CD3-coated coverslips (30 µg/mL; clone 2c-11 for mouse, clone UCHT1 for human). The cells were then perfused with extracellular buffer containing calcium (10 mM glucose, 5 mM HEPES, 140 mM NaCl, 4.5 mM KCl, 2 mM MgCl₂, and 10 mM CaCl₂) to stimulate CG secretion. The TIRF microscopy setup (Visitron Systems GmbH) was based on an IX83 microscope (Olympus) equipped with a UAPON100XOTIRF NA 1.49 objective (Olympus), solid-state excitation lasers at 488 nm, 561 nm, and 647 nm, an iLAS2 illumination control system (Roper Scientific SAS), an Evolve-EM 515 camera (Photometrics), and a filter cube containing Semrock FF444/520/590/Di01 dichroic and FF01-465/537/623 emission filters. The system was controlled via Visiview software (version 4.0.0.11; Visitron Systems GmbH). Images were acquired at a frequency of 10 Hz with a 100 ms exposure time. Time-lapse series were analyzed via ImageJ or the FIJI package for ImageJ. CG secretion was quantified via ImageJ with the Time Series Analyzer plugin. A fusion event was defined as a fluorescence change within 300 ms accompanied by a diffusion cloud.
Supported lipid bilayers (SLBs)SLBs were prepared as previously described [61, 62]. Briefly, to prepare a clean glass chamber for SLB, glass coverslips prewashed with acid piranha and a plasma cleaner were mounted on sticky-Slide VI0.4 (Ibidi) to form 6 flow channels. Small unilamellar liposomes were prepared using 18:1 DGS-NTA(Ni) (790404C-AVL, Avanti Polar Lipids), 18:1 Biotinyl Cap (870282C-AVL, Avanti Polar Lipids), and 18:1 (D9-Cis) PC (850375C-AVL, Avanti Polar Lipids) in specific mixtures at a total lipid concentration of 4 mM. SLBs were allowed to form by incubating 50 µl of liposome suspension per flow channel for 20 min at 20 ± 2 °C. SLB were then washed with HEPES buffer containing 1 mM CaCl2 and 2 mM MgCl2 (HBS) and blocked with 1% human serum albumin (HBS/HSA) prior to functionalization. The SLBs were functionalized in two steps. First, 5 µg of streptavidin (S11226, Thermo Fisher Scientific) was added per channel for 10 min at 20 ± 2 °C, followed by three washes. Finally, 30 µg per channel biotinylated anti-mouse CD3ε (BD Pharmingen, clone 145-2C11) was linked to the streptavidin on the SLB, and 50 µg/mL 12-histidine-tagged mouse ICAM-1 was linked to nickel ions.
Confocal live-cell imagingGranule polarization to the synapse in CTLs targeting target cells was visualized via confocal microscopy (LSM 780, Zeiss) with a 63x Plan-Apochromat objective (NA 1.4; Zeiss). Briefly, day 5 IFNγ-mCherry-expressing GzmB-KI CTLs (1 × 10⁵) were cocultured with P815 target cells (2 × 10⁴) on polyornithine-coated glass coverslips to ensure less cell movement for imaging. The RPMI coculture medium contained 10 mM HEPES and 2.5 µg/mL anti-CD3ε antibody (BD Pharmingen, clone 145-2C11) to promote T-cell contact with target cells. Live imaging was performed at 37 °C. Images were acquired as z-stacks with 1 Hz acquisition over time. The total thickness of the stack was 6 µm, whereas the distance between individual slices was 1 µm. For TNFα and IL-2 localization, GzmB-tdTomato–derived CTLs were coincubated with P815 cells in the presence of 2.5 µg/mL anti-CD3ε antibody for 40 min. P815 cells were preloaded with CFSE (Invitrogen; 1:1000) to distinguish them from T cells before mixing. The cells were then fixed with 4% PFA and stained with anti–TNFα–Alexa Fluor 647 (BioLegend, clone MP6-XT22; 1:200) or anti–IL-2–APC (Invitrogen, clone JES6-5H4; 1:200) antibodies. To examine IFNγ localization within MVBs and cytotoxic granules (CGs), day 5 GzmB–tdTomato knock-in (KI) CTLs were harvested for organelle fractionation. Fractions 4 (enriched in MVBs) and 8 (enriched in SCGs) were fixed on coverslips and stained with anti-CD81 (Novus, clone 1D6; 1:200) and anti-IFNγ (BioLegend, clone XMG1.2; 1:100) antibodies.
Structured illumination microscopy (SIM)For colocalization studies, T cells were fixed with ice-cold 4% paraformaldehyde (PFA) in D-PBS (Thermo Fisher Scientific) for 20 minutes, permeabilized with 0.1% Triton X-100 in D-PBS for 20 minutes, and blocked for 30 minutes in the same solution containing 2% bovine serum albumin (BSA). The cells were stained with anti-hIFNγ-Alexa594 (BioLegend, clone B27, 1:200), anti-mIFNγ-Alexa647 (BioLegend, clone XMG1.2, 1:100), and anti-GzmB-Alexa647 (BioLegend, clone GB11, 1:100) antibodies. For the detection of secreted SMAP on SLBs, 0.5 × 10⁶ T cells were seeded per ibidi channel and incubated for 90 minutes at 37 °C with 5% CO₂ to allow synapse formation and SMAP secretion. The cells were washed five times with cold D-PBS to remove unbound cells while retaining deposited SMAPs. Deposited SMAPs were fixed with 2% prewarmed PFA for 2 minutes at 37 °C, washed three times with D-PBS, and stained with wheat germ agglutinin (WGA)-Alexa647 or WGA-Alexa488 (1 µg/mL) for 30 minutes at RT. SMAPs were then permeabilized with 0.05% Triton X-100 for 5 minutes, blocked with 2% BSA for 30 minutes, and stained with anti-GzmB-Alexa647. For analysis of IFNγ intracellular distribution and distal membrane secretion, WT and Munc13-4 KO T cells transfected with IFNγ-mCherry or human CTLs transfected with IFNγ-mNeongreen were seeded on anti-CD3-coated glass coverslips for 30 or 60 minutes at 37 °C with 5% CO₂. The cells were fixed with 4% PFA for 5 minutes and stained with WGA-Alexa488 (1 µg/mL) for 30 minutes at room temperature to mark the plasma membrane (PM). The IFNγ deposited on the coverslip was imaged to confirm distal membrane secretion. For quantification of the density of mouse IFNγ particles, cell-free areas were manually selected on the basis of brightfield images via ImageJ. Particles within the field of view containing transfected cells were counted and normalized to the selected area (µm²). For human IFN-γ particle analysis, owing to the low transfection efficiency, the transfected cells were not in close proximity to each other in the images. Therefore, particles were manually counted within an approximately 30 µm radius around each transfected cell. The analysis results are reported as the number of particles per cell. For IFNγ intracellular distribution, the cells were washed twice with D-PBS, permeabilized, blocked, and stained with anti-GzmB-Alexa647 (BioLegend, clone GB11, 1:100). For the inhibition of protein transport, day 4 mouse CTLs were transfected with the IFNγ–mCherry plasmid. After 6 h, the cells were treated with 1 μM brefeldin A (Sigma‒Aldrich, B6542) and incubated at 37 °C for 2 h. The cells were then washed once with RPMI-based culture medium and plated on anti-CD3–coated coverslips to induce synapse formation and vesicle secretion. The cells were fixed after 30, 60, and 120 min for imaging.
For T-cell-targeted conjugates, 0.5 × 10⁴ T cells were mixed with calcein blue AM (Invitrogen)-labeled P815 target cells (1 × 10⁴) on polyornithine-coated coverslips in RPMI-based medium supplemented with 5 µg/mL anti-mCD3 (BD Pharmingen, clone 145-2C11). The conjugates were fixed after 30 or 60 minutes with 4% PFA and stained with WGA-Alexa488 to mark the PM. For human CTLs, day 5 effector T cells were cocultured with P815 target cells in the presence of 5 µg/mL anti-hCD3 (Biolegend, clone UCHT1), fixed after 1 or 2 hours, and stained with WGA-Alexa488. Following permeabilization and blocking, the cells were stained with anti-hIFNγ-Alexa594 (BioLegend, clone B27, 1:200) and anti-GzmB-Alexa647 (BioLegend, clone GB11, 1:100) antibodies. The samples were mounted in Mowiol-based mounting medium. All the experiments were performed on a Zeiss Elyra PS.1 microscopic SIM system with Zen 2010 software for device control and high-resolution image processing. Images were acquired as z-stacks with 0.2-µm intervals through the entire cell. Single-plane and maximum intensity projections were used to illustrate vesicle colocalization.
For IFNγ sorting experiments, day 4 activated WT CTLs were cotransfected with IFNγ–mScarlet or the corresponding C-terminal mutants together with mSerglycin–mNeonGreen to assess the colocalization of IFNγ and serglycin by SIM. To control for potential overexpression artifacts, an additional set of experiments was performed using day 4 activated granzyme B–tdTomato knock-in CTLs transfected with IFNγ–mNeonGreen or the corresponding mutants to analyze the colocalization of IFNγ with granzyme B. For transfection, 6 × 10⁶ CTLs were electroporated with 2 μg IFNγ–mScarlet and 2 μg mSerglycin–mNeonGreen plasmids or with 2 μg IFNγ–mNeonGreen alone. The cells were incubated for 8 h at 37°C to allow protein expression, after which they were fixed and imaged directly via SIM.
For CLEM, images of cells embedded in 100 nm ultrathin Lowicryl sections were acquired with excitation wavelengths of 405, 488 and 561 nm. Almost the entire field of view of a 200-mesh grid (approximately 90 µm2) could be observed with a 63× Plan-Apochromat objective by SIM, allowing a perfect orientation relative to the grid bars. After adjusting the highest and lowest focus planes for z-stack analysis in brightfield, images were recorded with a step size of 100 nm. The fluorescence images were excited at 405 nm to visualize the DAPI signal. A wavelength of 488 nm was used for visualization of GzmB, and a wavelength of 561 nm was used for IFNγ. The DAPI image (405 nm wavelength) was used to identify the nuclei, the plasma membranes of the CTLs, and the image plane. Three to ten images were recorded with a step size of 100 nm to scan the cells of interest. All the images were acquired with a 63× Plan-Apochromat (NA 1.4). For fluorescence analysis of isolated cytotoxic organelles from Syb2-KI CTLs, they were centrifuged on gelatin-coated coverslips from fractions 6 (MCGs) and 8 (SCGs) and permeabilized with 0.005% Triton-X-100 in Dulbecco’s PBS following blocking in PBS containing 2% BSA. Organelles were stained with anti-GzmB-Alexa647 (BioLegend, clone GB11, 1:100) and primary anti-mouse IFNγ antibodies (BioLegend, clone XMG1.2, 1:100), followed by incubation with an anti-rat IgG1-Alexa488 secondary antibody (Invitrogen). IFNγ, Syb2-mRFP, and GzmB were visualized at 488 nm, 561 nm, and 642 nm, respectively.
Cell homogenization and subcellular fractionationCytotoxic granule isolation was performed as previously described [36] and adapted for the isolation of MVBs. A total of 0.8–1.2 × 10⁸ activated CD8+ T cells from one Syb2 KI mouse were harvested and washed once in buffer (Invitrogen, PBS with 0.1% BSA and 2 mM EDTA) before resuspension in 2 mL of homogenization buffer (300 mM sucrose, 10 mM HEPES (pH 7.3), and 5 mM EDTA (pH 8.0)) supplemented with protease inhibitors (3 mM Pefabloc, 10 µM E64 and 10 µg of pepstatin A). The cell suspension was transferred into a prechilled cell disruption bomb (Parr 1019HC T304 SS) connected to a nitrogen source. After 25 minutes of equilibration at 55 bari, the nitrogen pressure was released, and the cell homogenate was collected. The cell lysate was centrifuged for 10 minutes at 1000 × g at 4 °C to pellet unbroken cells and partially disrupted cells and nuclei. The resulting postnuclear supernatant was layered on top of a discontinuous sucrose density gradient with 0.8, 1.0, 1.2, 1.4 and 1.6 M sucrose in 10 mM HEPES with 5 mM EDTA with protease inhibitors as described previously (pH 7.3), with 2 mL for each fraction. For additional MVB isolation, 2 ml of the 0.8 M sucrose fraction was replaced with 1 ml of 0.5 M sucrose and 1 ml of 0.8 M sucrose (corresponding to fractions 3 and 4). After ultracentrifugation at 100,000 × g for 90 minutes at 4 °C in a SW40Ti rotor (Beckmann), twelve 1 mL fractions were collected from the top of the gradient and supplemented with fresh protease inhibitors. For fluorescence analysis, 1 mL each of fractions 6 and 8 was diluted in 10 mL D-PBS and centrifuged for 30 minutes at 10,000 × g at 4 °C in an SW41Ti rotor (Beckmann) on gelatin-coated coverslips.
RNA isolation, cDNA synthesis, and RT–qPCRWT or Munc13-4 KO CD8⁺ T cells (1 × 10⁶ cells per well) were stimulated on anti-CD3-coated plates (30 µg/mL) or cultured on polyornithine (Sigma)-coated plates as an unstimulated control in a 24-well plate for 10 or 20 hours. Total RNA was extracted via TRIzol reagent (Thermo Fisher Scientific) following the manufacturer’s protocol. Briefly, 1 × 10⁶ CD8⁺ T cells were homogenized in 500 µl of TRIzol reagent, followed by the addition of 100 µl of chloroform. The samples were subsequently centrifuged at 12,000 × g for 15 minutes at 4 °C, after which the mixture was separated into three distinct phases, with the RNA remaining exclusively in the upper aqueous phase. The aqueous phase was carefully transferred to a fresh tube without disturbing the interphase, and the RNA was precipitated by mixing with an equal volume of 100% isopropanol. The RNA pellet was washed once with 75% ethanol, air-dried, and dissolved in DEPC-treated H₂O. The quality and quantity of the extracted RNA were assessed via a NanoDrop spectrophotometer. The isolated RNA was subsequently reverse transcribed into complementary DNA (cDNA) via the ABScript II cDNA First-Strand Synthesis Kit (ABclonal) in accordance with the manufacturer’s instructions. Briefly, 1 µg of RNA was mixed with a reaction mixture containing random primer mixture, 10 mM dNTPs and the ABScript II enzyme. The mixture was first incubated at 25 °C for 5 minutes, followed by incubation at 42 °C for 1 hour. Enzyme inactivation was achieved by heating the mixture to 80 °C for 5 minutes. RT‒qPCR was performed via the use of Genious 2X SYBR Green Fast qPCR Mix (ABclonal) on a Bio-Rad CFX96 Touch Real-Time PCR Detection System. A total of 10 ng of cDNA was used as a template in each reaction. Amplification was performed according to the manufacturer’s protocol via specific primers targeting Munc13-1 (forward: 5′-CAACTGGAATTACTTTGGC-3′, reverse: 5′-GCGAAGTCGTATAGTAGG-3′) and Munc13-4 (forward: 5′-GCCATTCTGCCCCTGATGAAAT-3′, reverse: 5′-ACCTCCACCAGCACAGTAAG-3′). TBP1 (Qiagen, QT00198443) was used as an internal reference gene to normalize target gene expression. Relative gene expression levels were quantified via the 2^(-ΔCt) method.
ELISAWT or Munc13-4 KO CD8⁺ T cells (1 × 10⁶ cells per well) were stimulated on anti-CD3-coated plates (BD Pharmingen, clone 145-2C11, 30 µg/mL) in 24-well plates containing 1 mL of AIMV-based culture medium. Unstimulated control cells were plated on polyornithine-coated plates. The supernatants were collected at the indicated time points during 20 hours of incubation at 37 °C. IFNγ concentrations were quantified via an IFNγ ELISA kit (Abcam, ab46081) according to the manufacturer’s instructions. Briefly, 100 µL of 1:10-diluted culture supernatant was added to IFNγ antibody-precoated 96-well plates and incubated for 1 hour to form antibody–antigen complexes. Following the washes, 100 µL of TMB substrate was added, and the mixture was incubated for 30 minutes at RT in the dark. The reaction was stopped with 50 µL of stop solution, and the absorbance was measured at 450 nm via a TECAN Infinite M200 Pro plate reader. Four independent coculture preparations were analyzed.
Electron microscopyPostembedding correlative light and electron microscopy (CLEM) of cryofixed mouse CTLs was performed as described previously [5]. Day 4 GzmB-mTFP KI CTLs were transfected with IFNγ-mCherry for 6–7 hours, and day 4 human effector CTLs were cotransfected with GzmB-mCherry and IFNγ-mNeonGreen for 8–10 hours at 32 °C before freezing. The cells were seeded on 1.4 mm sapphire discs coated with poly-L-ornithine (Sigma, 0.1 mg/mL) and anti-CD3 (BD Pharmingen, Clone145-2C11; 30 µg/mL) in flat specimen carriers (Leica) and vitrified in a high-pressure freezing system (EM PACT2, Leica). The frozen samples were cryo-transferred into the precooled (−130 °C) freeze-substitution chamber of the AFS2 (Leica). The temperature was increased from -130 to −90 °C for 2 h. Cryosubstitution was performed at −90 °C to −70 °C for 20 h in anhydrous acetone and at -70 to -60 °C for 24 h with 0.3% (wt/vol) uranyl acetate in anhydrous acetone. At -60 °C, the samples were infiltrated with increasing concentrations (30, 60 and 100%; 1 h each) of Lowicryl (3:1 K11M/HM20 mixture; Electron Microscopy Sciences). After 5 h of 100% Lowicryl infiltration, the samples were UV-polymerized at -60 °C for 24 h and for an additional 15 h while the temperature was increased linearly to 5 °C. The samples were stored in the dark at 4 °C until further processing. After the membrane carriers were removed, 100-nm ultrathin sections were cut via an EM UC7 (Leica) and collected on carbon-coated 200-mesh copper grids (Plano). One day after sectioning, the grid was stained with DAPI for 3 minutes (1/1000), washed and sealed between a coverslip and a glass slide for high-resolution SIM imaging. After fluorescence imaging, the grid was carefully removed, stained with uranyl acetate and lead citrate and recorded with a Tecnai12 Biotwin electron microscope. Only CTLs with well-conserved membranes, organelles and nuclei were analyzed and used for correlation. The DAPI signal of the nucleus was used to find the best overlap of the SIM image with the electron microscope image. The final alignment defines the position of the fluorescent signals within the cell of interest. The images were overlaid in CorelDRAW 2021.
Statistical analysisAll the statistical analyses were performed via Igor Pro (v6.37) or SigmaPlot (v14.0). The data are presented as the means ± SEMs (or SDs where indicated). The statistical tests used for each experiment are specified in the corresponding figure legends. Unless otherwise stated, comparisons between two groups were performed via the Mann–Whitney U test, and multiple-group comparisons were analyzed via the Holm–Šidák post hoc test. All p-values were calculated via two-tailed tests with a 95% confidence interval. Statistical significance was denoted as *p < 0.05, **p < 0.01, and ***p < 0.001. All imaging data were analyzed with ImageJ or FIJI (version 15). Colocalization analyses were performed via the JaCoP plugin. Object-based colocalization was conducted with the DiAna plugin (ImageJ v52). Individual fluorescent spots were identified through an iterative segmentation procedure with a step value of 100, a size range of 15–700 pixels, and independently adjusted thresholds for each channel.
Comments (0)