Animals
Male and female BALB/c mice weighing 30–40 g and two months of age were randomly utilized in this investigation. The mice were obtained from the Betül-Ziya Eren Genome and Stem Cell Center’s Transgenics Department, Turkey. At two months of age, head trauma was induced according to the Marmarau trauma model (Tweedie et al. 2013). The experimental animal study was conducted with the approval of the local ethics committee of Erciyes University (HADYEK) (number 21/225).
TBI model
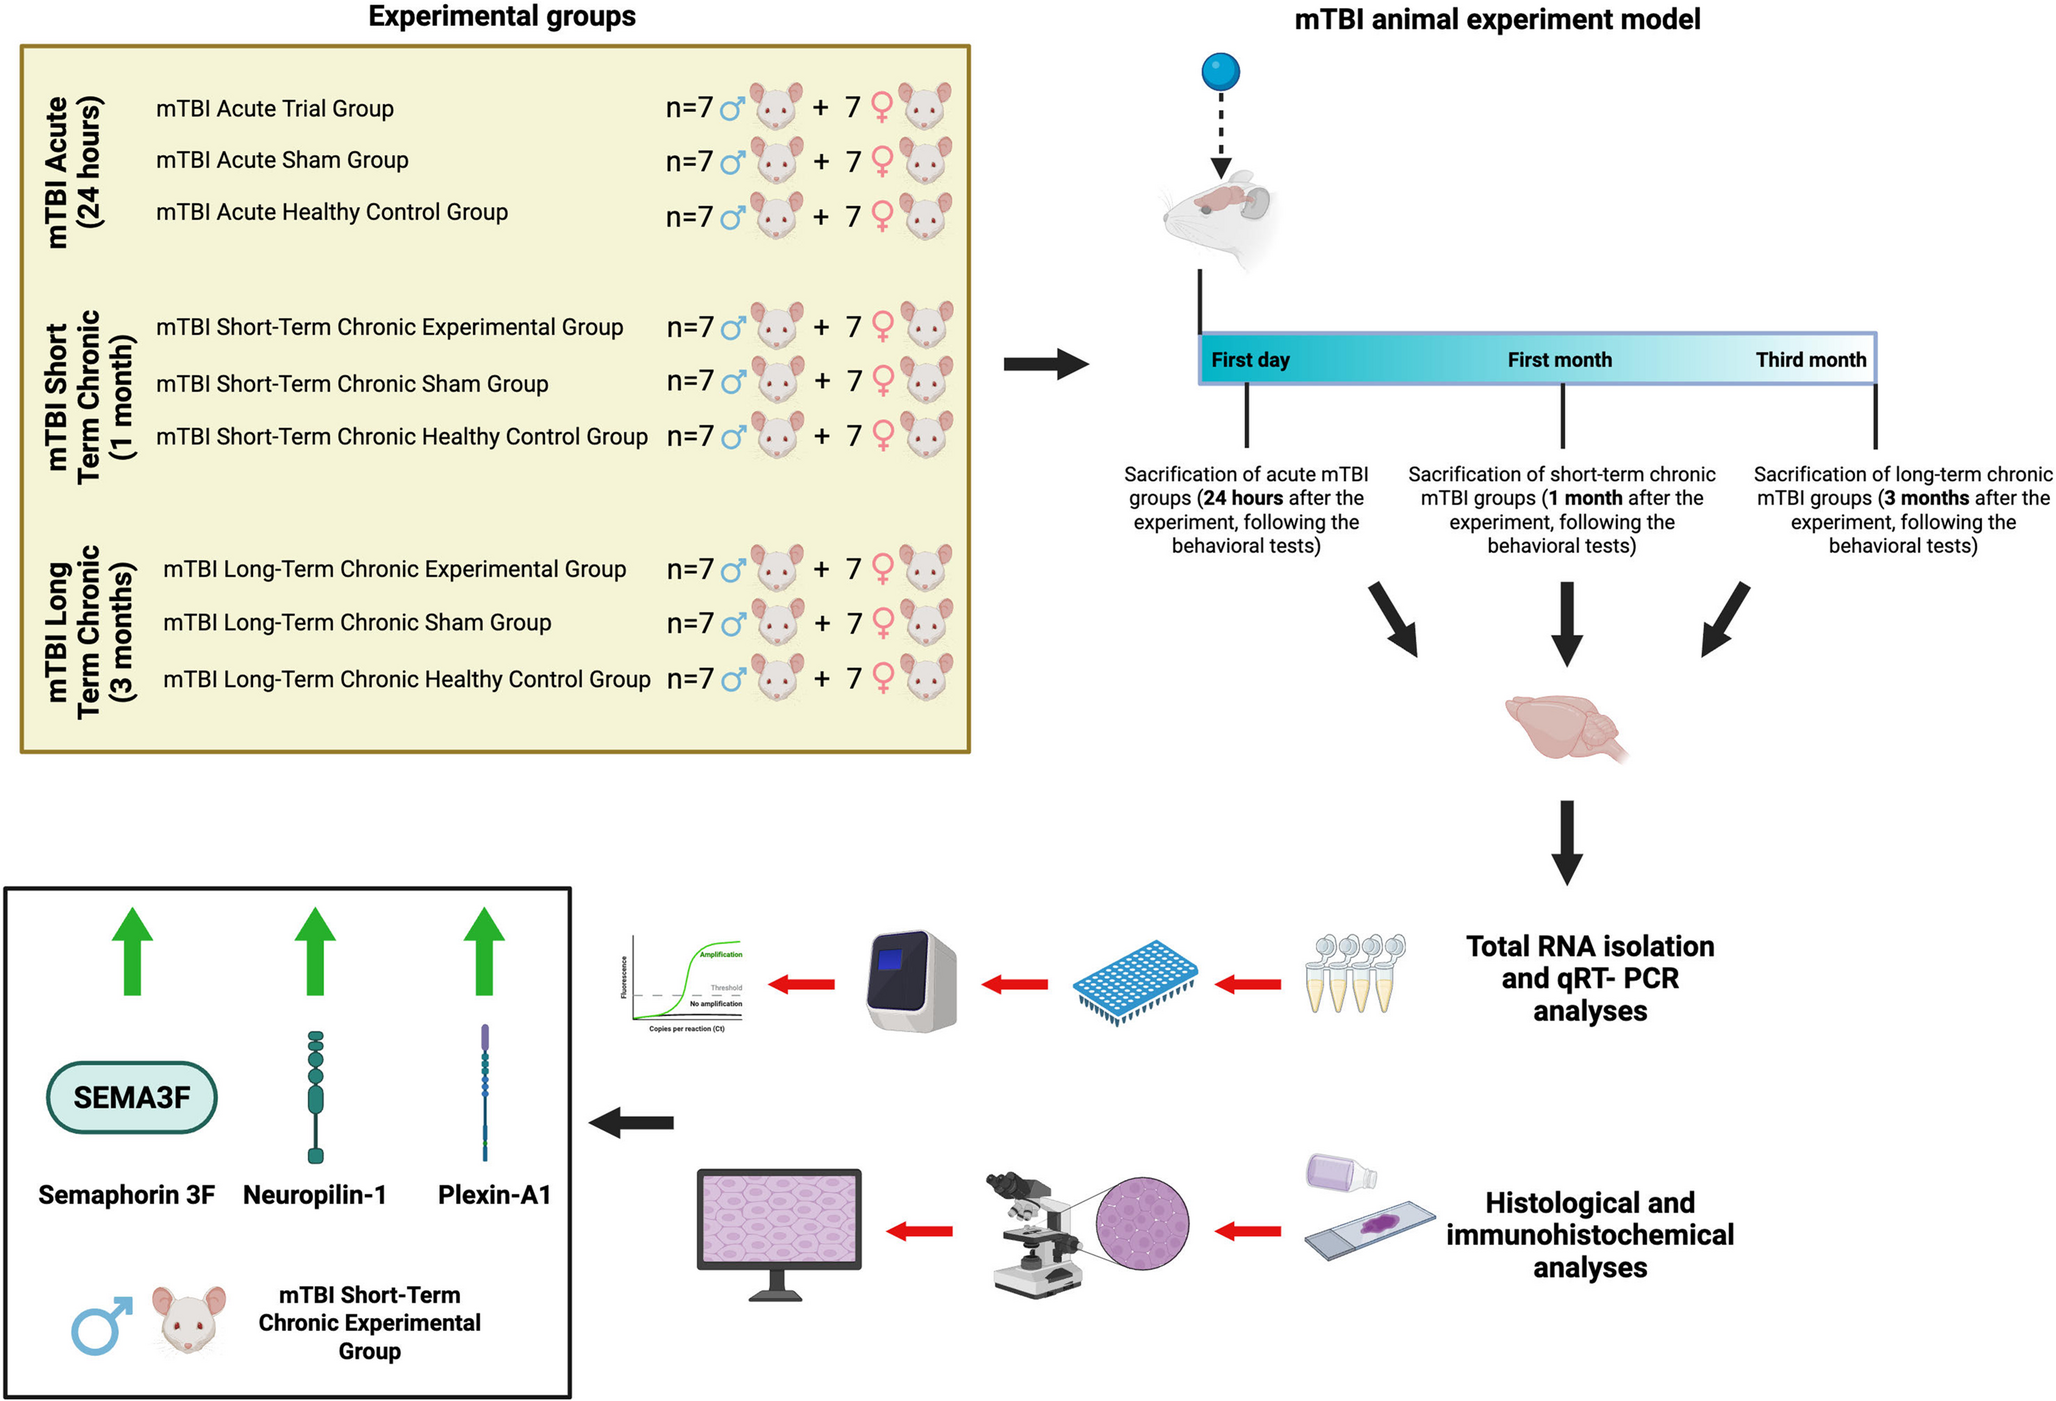
Before trauma, local anesthesia was applied to the subcutaneous tissue of the mouse heads. To create mild trauma, the scalp of the anesthetized mouse was prepared by opening it with a scalpel, and the mouse was placed on the Marmarau trauma device. Under anesthesia, a plastic disk was placed on the surgically opened head of the mouse and placed under this tube. A 30-g weight was subsequently left from the top of the tube (Tweedie et al. 2013). This procedure was performed once to create mild head trauma. Then, for the mTBI acute group, the mice were sacrificed 24 h after the operation; for the mTBI short-term chronic group (Ge et al. 2018), the mice were sacrificed 1 month after the operation; and for the mTBI long-term chronic group (McInnes et al. 2019), the mice were sacrificed 3 months after the operation, and the relevant tissues were collected. For the sham groups, under the same conditions as those used for the trauma group, the scalp was opened, and no surgical procedure was performed. Only surgical sutures were placed. Then, for the mTBI acute sham group, the mice were sacrificed 24 h after the operation; for the mTBI short-term chronic group, the mice were sacrificed 1 month after the operation; and for the mTBI long-term chronic sham group, the mice were sacrificed 3 months after the operation, and the relevant tissues were collected. Since each group was terminated at different times and a common healthy control group could not be created, separate healthy control groups were created for the 3 main experimental groups.
Animal grouping
The nine groups were divided into control, sham, and experimental groups, as indicated in Table 1.
Table 1 Experimental design of the studyBehavioral experiments
After a model for mTBI chronic short-term (1 month) and mTBI chronic long-term (3 months) mice with traumatic brain injury and healthy control group mice were created, novel object recognition (Yilmaz Sukranli et al. 2024), tail suspension (Moy et al. 2008), marble test (Nicolas et al. 2006) social interaction test (Ikeda et al. 2013) and open field test (Silvero-Isidre et al. 2018) behavioral experiments were performed.
In this study, the early acute phase was defined as the period in which the initial pathophysiological and molecular alterations occur following trauma (Lu et al. 2025). To specifically investigate these early acute changes, mice in the acute TBI group were sacrificed 24 h after injury induction, and no behavioral tests were performed in this group. A total of five different behavioral experimental analyses were conducted in the study. Performing behavioral tests in the acute group would have shifted the assessment into the sub-acute phase (Erdman et al. 2011), which would not align with the primary objective of capturing early-phase alterations. Therefore, the acute group was evaluated exclusively at the molecular and histological levels to characterize the immediate effects of mild TBI.
Total RNA isolation
After the behavioral experiments were completed, the mice were sacrificed, and tissues from the hypothalamus, pituitary, hippocampus, and prefrontal cortex were removed. The collected tissue samples were placed in 500 µL of QIAzol Lysis Reagent Isolation Reagent (Qiagen, Cat No: 79306 USA). Total RNA isolation was then performed according to the manufacturer’s instructions.
cDNA Preparation and quantitative real-time polymerase chain reaction (qRT‒PCR)
Complementary strand DNA (cDNA) was obtained via the iScript™ cDNA Synthesis Kit (Bio-Rad, Cat No: 1708891, USA) according to the manufacturer’s protocol to study gene expression in RNA samples from the study group. The mRNA expression levels of Sema3a, Nrp1, and Plxna1 were quantified from the obtained cDNA samples via the Roche Light Cycler LC480 system and the SsoAdvanced Universal SYBR Green Supermix (Bio-Rad, Cat No: 1725271, USA) kit. The primer sequences and the Roche Light Cycler LC 480 II Real-Time PCR Program used in the study are shown in Supplementary Table 1.
Histologic analysis
The total brain samples of each group (five females and five males) were fixed with formaldehyde solution (10%), washed in tap water (1 night), and then dehydrated by passing the tissues through an increasing alcohol series. Then, the tissue samples were made transparent by leaving them in xylol (Merck, 108297), and after passing through the paraffin series, they were embedded in clean paraffin. A microtome was used to cut 5 \(\:\mu\:\)m thick slices of paraffin-embedded brain tissue samples, which were then stained with Harris hematoxylin (BES LAB, BS-001) and Eosin Y (BES LAB, BS-009). A Zeiss Axiscope 3 light microscope was used for histomorphological analysis, and a Colibri 3 digital camera was used for imaging (Doğanyiğit et al. 2023). The brain tissues of the experimental groups were examined for signs of neuronal degeneration and inflammatory cell infiltration in the cortex and hippocampus. Neuron degeneration was defined as eosinophilic neurons with pyknotic nuclei, cell enlargement, or shrinking (Tambe et al. 2016). Histopathological results in each category were scored as 0 = absent, 1 = mild, 2 = moderate, and 3 = severe. Quantification was performed randomly and blindly by two investigators. Ten mice (five females and five males) per experimental group were used for histomorphological scoring, with a minimum of 10 photos per mouse.
Immunohistochemistry analysis
Anti-Semaphorin-3 F (ASR-056, Alomone labs, RRID: AB_2876826), anti-Plexin-A1 (APR-081, Alomone labs, RRID: AB_2756765), anti-Neuropilin-1 (ANR-063, Alomone labs, RRID: AB_2756695) and TNF-α (E-AB-22159, Elabscience) immunoreactivities were detected via immunohistochemical analysis in sections taken from the brain tissues of the experimental groups via the avidin-biotin peroxidase method (Okan et al. 2024). In summary, citrate buffer (pH: 6.0; Thermo Fischer Scientific, UK, AP-9003-500) was utilized to expose epitopes following the deparaffinization of 5 μm thick sections. The slides were subsequently immersed in a 3% hydrogen peroxide solution mixed with methanol to inhibit endogenous peroxidase activity. The Ultra V blocking solution (Thermo Fischer Scientific, UK, TA-125-UB) prevented nonspecific staining. Then, the samples were incubated with primary antibodies (dilution ratios of semaphorin-3 F (1:100), plexin-A1 (1:100), neuropilin-1 (1:50) and TNF-α (1:100) at 4 °C overnight. A biotinylated goat anti-polyvalent secondary antibody (Thermo Fischer Scientific, UK, TP-125-BN) was then added and incubated for 40 min at 37 °C. Following multiple washes with PBS, the mixture was incubated for 30 min at 37 °C with streptavidin peroxidase (Thermo Fischer Scientific, UK, TS-125-HR). The diaminobenzidine (DAB) chromogen (Thermo Fischer Scientific, UK, TA-125-HD) was used to visualize the antibody complex. After that, Gill III Hematoxylin (Merck, Germany, 1.05174.1000) was used to counterstain the sections. After they were subjected to a sequence of increasing alcohols to dehydrate them, they were sealed with Entellan (Merck, 1.07961). For each experimental group, six mice (three females and three males) were used for immunohistochemical analysis. A Zeiss Axiscope 5 Colibri 3 light microscope was used to examine the sections. ImageJ version 1.46 (National Institutes of Health, Bethesda, Maryland) was used to measure the levels of immunoreactivity.
Analysis of statistics
To execute all the statistical tests and create graphs, GraphPad Prism software (version 8.4.3, 2020) was used. Statistical analyses were performed using two-way ANOVA, followed by Tukey’s multiple comparison test to compare the female experimental groups among themselves and the male experimental groups within their respective categories. In addition, Šidák’s multiple comparison test was applied to evaluate potential sex-related differences between the corresponding male and female experimental groups.
Group differences were deemed significant when they were p < 0.05.

Comments (0)